


1.0 INTRODUCTION
Aircraft ditching, a controlled emergency landing on water, is an important consideration in modern aerospace design for improved safety. One of the most remarkable ditching incidents was the ‘Miracle on the Hudson’ in 2009(1). The aircraft successfully landed on the Hudson River without any casualties, thanks to the pilot’s superb skills and experience. During impact, the cabin remained mostly intact, except for the aft fuselage that succumbed to extreme loading and was ruptured.
A commercial aircraft fuselage is required to withstand hard-surface landing, according to Part 25 of the Federal Aviation Regulations (FAR). Usually, impact loads are dissipated through the primary structures of the aircraft, such as frames and ribs as well as some of the crush mechanisms that are designed to absorb the majority of the energy released to reduce the acceleration loads that would be otherwise transferred to the passengers and crew.
However, impacts on soft terrain such as water or loose soil do not allow the kinetic energy dissipating mechanisms to function properly. Instead, complex loads are applied to the fuselage and can cause unexpected fuselage failure modes. As an example, the full-scale airplane emergency crash landing test onto soft soil performed for the Discovery Channel(2) showed notable differences in damage signature compared to that of the vertical section drop test conducted by the North American Space Agency (NASA) and the Federal Aviation Administration (FAA)(Reference Jackson and Fasanella3) due to its horizontal impact velocity. Similarly, the undercarriage of Flight 1549 showed very different damage response compared to the controlled fuselage section drop test(Reference Jackson and Fasanella3) as depicted in Fig. 1.

Figure 1. Ruptured undercarriage (aft-wing section) bays of Flight 1549 after ditching into the Hudson River (Reference Satterwhite and Bayandor4).
Because of the combination of impact loads and viscous effects present in both soft and medium crash landings, a complex damage response is sustained by the fuselage. The aircraft used for the Discovery Channel experiment(2) buckled at the forward section, where the undercarriage of Flight 1549(Reference Satterwhite and Bayandor4) was sheared off at the moment of impact. In order to improve the design to withstand such complicated loads caused by impact onto deformable surfaces, further structural enhancements are required. This is while any full-scale aircraft trials to verify crashworthy modifications can be tremendously costly and logistically difficult to execute(2,Reference Jackson, Boitnott, Fasanella, Jones and Lyle5).
In an effort to contribute to improving the crashworthiness assessment, the presented work evaluates a computational approach to accurately simulate water ditching scenarios using a multidisciplinary approach. Many studies have been conducted in an attempt to model fluid-structure interactive (FSI) events, using two of the most popular monolithic finite element formulations; Coupled Lagrangian-Eulerian (CLE)(Reference Hua, Fang and Cheng6–Reference Song, Horton, Perino, Thurber and Bayandor8) and Smoothed Particle Hydrodynamics (SPH)(Reference Anghileri, Castelletti, Francesconi, Milanese and Pittofrati9,Reference Siemann and Langrand10). Considering several shortcomings of the commercial implementation of SPH, however, found in a previous investigation(Reference Horton, Song, Feaster and Bayandor11), CLE is used for the current investigation. This paper consists of two phases; (1) verification and validation of the fluid modelling using a finite element analysis (FEA) tool and (2) determination of the dynamic response of a fuselage structure ditching into water to predict the dynamic behaviour of a deformable, ground-impact-verified fuselage section (Boeing 737-200) ditching into water. Comparison will be made against the rigid and deformable (soil) ground.
2.0 COMPUTATIONAL MODELLING
The current study uses the commercial FEA framework, LS-Dyna(Reference Hallquist12), to simulate non-linear FSI events. The fluid systems modelled using CLE are then validated through comparison with both the analytical solution and the experimental observations and data. The experiments used were carried out by Shah(Reference Alexander, Carey, DiNardo, Gill, Gonzalez, Harry, Isidro, Judge, Puckett, Schoepfer, Song, Tilghman, Siddens, Satterwhite and Bayandor13) and Zhao et al.(Reference Zhao, Faltinsen and Aarsnes.14).
2.1 Coupled Lagrangian-Eulerian
To accurately predict fluidic deformation, CLE, an advanced FEA formulation, was applied. In CLE, the mesh can deform to track the boundaries of a material using the Lagrangian formulation but is periodically rezoned to the ambient Eulerian mesh that may contain multiple materials in a single cell. By combining the advantages of both Lagrangian and Eulerian formulations, a material calculation is conducted until the mesh is distorted (Eulerian), then the distorted mesh is smoothed out by rezoning algorithm (Lagrangian).
The CLE was initially proposed by Noh(Reference Noh15) and Trulio(Reference Trulio16) and has since been implemented by researchers including Hughes et al.(Reference Hughes, Liu and Zimmermann17) in 1981 and more contemporary research programs, the latest being 2014(Reference Karimi, Navidbakhsh, Razaghi and Haghpanahi18). To conserve mass, momentum and energy, an advection algorithm is required to periodically rezone the Lagrangian domain. For this study, a second-order monotone upwind discretisation, known as Van Leer mesh advection(Reference Van Leer19), is used to rezone the mesh. Using the rezoning algorithm to periodically morph the distorted mesh, conservations of mass and momentum in the Lagrangian domain are ensured(Reference Dukowicz and Kodis20). The conservation equations for mass, momentum and energy in CLE form can be written as:
Mass:
 $$\begin{equation}
{\left.\frac{\partial\rho }{\partial t}\right|}_{ref}+\left(v_m-\hat{v}\right)\cdot \nabla\left(\rho \right)=-\rho \nabla\cdot v
\label{eqn1}
\end{equation}$$
$$\begin{equation}
{\left.\frac{\partial\rho }{\partial t}\right|}_{ref}+\left(v_m-\hat{v}\right)\cdot \nabla\left(\rho \right)=-\rho \nabla\cdot v
\label{eqn1}
\end{equation}$$
Momentum:
 $$\begin{equation}
\rho \left({\left.\frac{\partial v}{\partial t}\right|}_{ref}+\left(\left(v_m-\hat{v}\right)\cdot \nabla\right)v\right)=\nabla\cdot \sigma +\rho \vec{f}
\label{eqn2}
\end{equation}$$
$$\begin{equation}
\rho \left({\left.\frac{\partial v}{\partial t}\right|}_{ref}+\left(\left(v_m-\hat{v}\right)\cdot \nabla\right)v\right)=\nabla\cdot \sigma +\rho \vec{f}
\label{eqn2}
\end{equation}$$
Total Energy:
 $$\begin{equation}
\rho \left({\left.\frac{\partial E}{\partial t}\right|}_{ref}+\left(v_m-\hat{v}\right)\cdot \nabla E\right)=\nabla\cdot {\rm (}\sigma \cdot v{\rm )+}v\cdot ~\rho \vec{f}
\label{eqn3}
\end{equation}$$
$$\begin{equation}
\rho \left({\left.\frac{\partial E}{\partial t}\right|}_{ref}+\left(v_m-\hat{v}\right)\cdot \nabla E\right)=\nabla\cdot {\rm (}\sigma \cdot v{\rm )+}v\cdot ~\rho \vec{f}
\label{eqn3}
\end{equation}$$
where
 $$$\sigma $$$
is the Cauchy stress tensor, E is the total energy and f is the body force. The right-hand side of the equation is the Eulerian formulation, while the arbitrary motion of the CLE mesh is only reflected in the left-hand side. Subscript ref is the reference domain,
$$$\sigma $$$
is the Cauchy stress tensor, E is the total energy and f is the body force. The right-hand side of the equation is the Eulerian formulation, while the arbitrary motion of the CLE mesh is only reflected in the left-hand side. Subscript ref is the reference domain,
 $v_m$
is the material velocity inside of CLE mesh and
$v_m$
is the material velocity inside of CLE mesh and
 $\hat{v}$
is the CLE mesh grid velocity.
$\hat{v}$
is the CLE mesh grid velocity.
2.2 Fluid body modelling
Conventional FEA material definitions are not suitable for predicting fluidic deformation because the fluidic motion encompasses shear stresses driven by viscous effects. Therefore, the CLE formulation requires appropriate material definitions and a corresponding equation of state (EOS).
2.2.1 Material model for water
For the presented work, a Newtonian viscous fluid model is defined to calculate deviatoric stress based on the strain rate of the continuum. The deviatoric stress
 $({\sigma {\rm '}}_{xy})$
of this material model is:
$({\sigma {\rm '}}_{xy})$
of this material model is:
 $$\begin{equation} {\sigma {\rm '}}_{xy}=2\mu \cdot {\dot{\varepsilon }}_{xy}\label{eqn4}\end{equation}$$
where
 $\mu$
is the dynamic viscosity, and
$\mu$
is the dynamic viscosity, and
 ${\dot{\varepsilon }}_{xy}$
is the strain rate tensor. To constitute a complete stress tensor to represent the total stress within the fluid continuum, the hydrostatic pressure (p) is calculated using an EOS. For the hydrostatic pressure (p) in tensor form, the hydrostatic pressure (p) is multiplied by Kronecker delta
${\dot{\varepsilon }}_{xy}$
is the strain rate tensor. To constitute a complete stress tensor to represent the total stress within the fluid continuum, the hydrostatic pressure (p) is calculated using an EOS. For the hydrostatic pressure (p) in tensor form, the hydrostatic pressure (p) is multiplied by Kronecker delta
 $({\delta }_{xy})$
and added to the previously defined deviatoric stress
$({\delta }_{xy})$
and added to the previously defined deviatoric stress
 $({\sigma {\rm '}}_{xy})$
. The total stress
$({\sigma {\rm '}}_{xy})$
. The total stress
 $({\sigma }_{xy})$
at a given state can be calculated using:
$({\sigma }_{xy})$
at a given state can be calculated using:
 $$\begin{equation}
{\sigma }_{xy}={\sigma {\rm '}}_{xy}+p\cdot {\delta }_{xy}
\label{eqn5}
\end{equation}$$
$$\begin{equation}
{\sigma }_{xy}={\sigma {\rm '}}_{xy}+p\cdot {\delta }_{xy}
\label{eqn5}
\end{equation}$$
2.2.2 EOS for water material
Using the state variables, the EOS calculates a constitutive mathematical relationship of a homogeneous material. For this study, the Mie-Gruneisen (M-G) EOS is used to estimate the dynamic response of fluids under high-velocity impact scenarios(Reference Hallquist12):
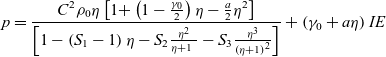 $$\begin{equation}
p=\frac{C^{{\rm 2}}{\rho }_0\eta \left[{\rm 1+}\left(1-\frac{{\gamma }_0}{{\rm 2}}\right)\eta -\frac{a}{{\rm 2}}{\eta }^{{\rm 2}}\right]}{\left[1-\left(S_{{\rm 1}}-{\rm 1}\right)\eta -S_{{\rm 2}}\frac{{\eta }^{{\rm 2}}}{\eta {\rm +1\ }}-S_{{\rm 3}}\frac{{\eta }^{{\rm 3}}}{{\left(\eta {\rm +1}\right)}^{{\rm 2}}}\right]}+\left({\gamma }_0+a\eta \right)IE
\label{eqn6}
\end{equation}$$
$$\begin{equation}
p=\frac{C^{{\rm 2}}{\rho }_0\eta \left[{\rm 1+}\left(1-\frac{{\gamma }_0}{{\rm 2}}\right)\eta -\frac{a}{{\rm 2}}{\eta }^{{\rm 2}}\right]}{\left[1-\left(S_{{\rm 1}}-{\rm 1}\right)\eta -S_{{\rm 2}}\frac{{\eta }^{{\rm 2}}}{\eta {\rm +1\ }}-S_{{\rm 3}}\frac{{\eta }^{{\rm 3}}}{{\left(\eta {\rm +1}\right)}^{{\rm 2}}}\right]}+\left({\gamma }_0+a\eta \right)IE
\label{eqn6}
\end{equation}$$
where
 $\eta$
is the relative density ratio
$\eta$
is the relative density ratio
 $(\eta ={\rho }/{{\rho }_0}-{\rm 1})$
, C is the speed of sound of the material,
$(\eta ={\rho }/{{\rho }_0}-{\rm 1})$
, C is the speed of sound of the material,
 $S_{1-3}$
are the empirical Hugoniot slope constants for the pressure-volume relationship,
$S_{1-3}$
are the empirical Hugoniot slope constants for the pressure-volume relationship,
 ${\gamma }_0$
is the Gruneisen gamma, a is the first-order dimensionless empirical volume correction factor and IE is the internal energy. Several researchers have proposed to use the M-G EOS and various material constants to govern the water behaviour in FEA. Therefore, a set of material constants was selected based on the work done by Shin et al.(Reference Shin, Lee, Lam and Yeo21). The EOS and material parameters for water are shown in Table 1.
${\gamma }_0$
is the Gruneisen gamma, a is the first-order dimensionless empirical volume correction factor and IE is the internal energy. Several researchers have proposed to use the M-G EOS and various material constants to govern the water behaviour in FEA. Therefore, a set of material constants was selected based on the work done by Shin et al.(Reference Shin, Lee, Lam and Yeo21). The EOS and material parameters for water are shown in Table 1.
Table 1 Input parameters for water (Reference Shin, Lee, Lam and Yeo21)
By using the CLE formulations and the fluidic modelling strategy (Eulerian), the FEA solver can predict non-linear fluidic motions. Coupled with the solid (Lagrangian) objects using penalty-based contact, FSI systems can be effectively simulated.
3.0 STEP-BY-STEP DEVELOPMENT OF FINITE ELEMENT MODELLING AND ANALYSIS
Prior to conducting the comprehensive study, detailed discussions regarding the virtual fuselage section model are provided. In-depth discussion concerning the verification and validation of the fuselage section model is presented in a previous work(Reference Song, Horton, Perino, Thurber and Bayandor8). Meanwhile, the verifications of the numerical fluid modelling strategy using FEA are presented with two different element formulations (CLE and SPH) to demonstrate the individual capabilities of each method, leading to the selection of effective element formulations for the FSI methodology.
3.1 Virtual fuselage section
Due to the considerable lack of publicly available information regarding contemporary aircraft fuselage structures, the current study resorts to developing and using the Boeing 737 section model, partly constructed based on the only existing references on an unrestricted physical trial. The virtual fuselage section used was previously developed and validated for hard-surface drop tests(Reference Song, Horton, Perino, Thurber and Bayandor8) by being thoroughly compared with the experiment reported by Jackson et al.(Reference Jackson and Fasanella3). The constructed section is shown in Fig. 2.
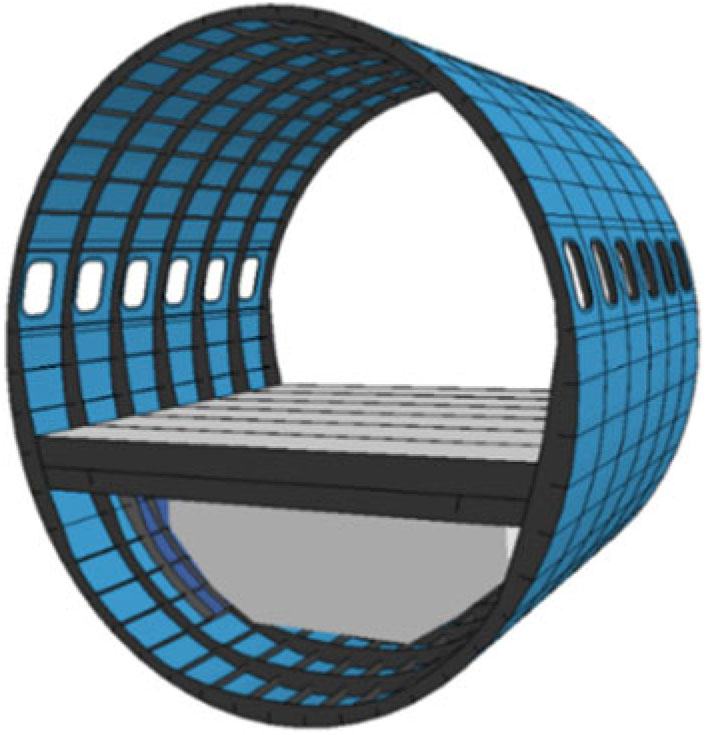
Figure 2. B-737 fuselage section model.
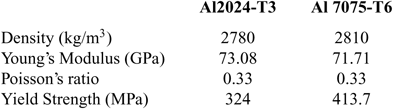
Perfect bonding assumption is applied to the entire fuselage section, except for the cargo door section. In that case, instead of a perfect attachment, the structural connection consists of hinge structures and locks on the cargo door. All components in the fuselage section are assumed to be aluminium alloys, based on an earlier work(Reference Jackson and Fasanella3), with an appropriate failure strain. The corresponding properties are listed in Table 2. The plastic failure strain is assumed to account for material aging-effect due to cyclic loading.
Table 2 Material definitions for aluminium alloys used in the simulation
The fuselage section is 4.09 m in height, 3.76 m in width and 3.05 m in length. Both a single cargo door and fuel tank are explicitly modelled in order to replicate the structural discontinuities. The overall mass of the fuselage section is 3,909 kg, which is close to the reported value of 3,977 kg. The fuel tank is 168 kg, suspended from the passenger floor by two longitudinal fuel rails.
The fuel mass inside the tank is represented by evenly distributed nodal mass over the entire mesh of the fuel tank, emulating the total tank mass of 1,694 kg. To account for auxiliary mass such as dummies, seats and other instrumentation used in the test, the overall mass of the passenger floor in the model is defined as 1,640 kg, also uniformly applied over the passenger floor and exactly matching the reported experimental mass. The impact velocity of the model is selected as 9.14 m/s, which matches the velocity reported from the experiment(Reference Jackson and Fasanella3). In addition, to ensure realistic impact kinematics, gravity is also applied over the entire domain. Instead of attaching each individual component by tie-contact or failure-enabled connection, this macroscale study assumes perfect bonding between components.
3.2 Verification of computational fluid modelling
The fluid modelling verification was conducted by simulating shear-driven flow over a square cavity. The problem is a well-known fluid mechanics benchmark that has been used in many previous studies to evaluate different fluid modelling methods. Once the model was successfully developed using CLE and SPH, the results computed based on each monolithic solver were compared against the existing literature(Reference Ghia, Ghia and Shin22) as well as Computational Fluid Dynamics (CFD) results using FLUENT(Reference Horton, Song, Feaster and Bayandor11).
As shown in Fig. 3(a), the simulated cavity flow is set up for Re = 3,200, using the advanced finite element formulations (CLE and SPH) with
 $256\times256$
grid resolution. The fluid deformation using FEA solver predicts a primary vortex at the centre of the cavity. However, the secondary vortical structures at each corner are only successfully predicted using CLE and not shown in the results using SPH formulation.
$256\times256$
grid resolution. The fluid deformation using FEA solver predicts a primary vortex at the centre of the cavity. However, the secondary vortical structures at each corner are only successfully predicted using CLE and not shown in the results using SPH formulation.
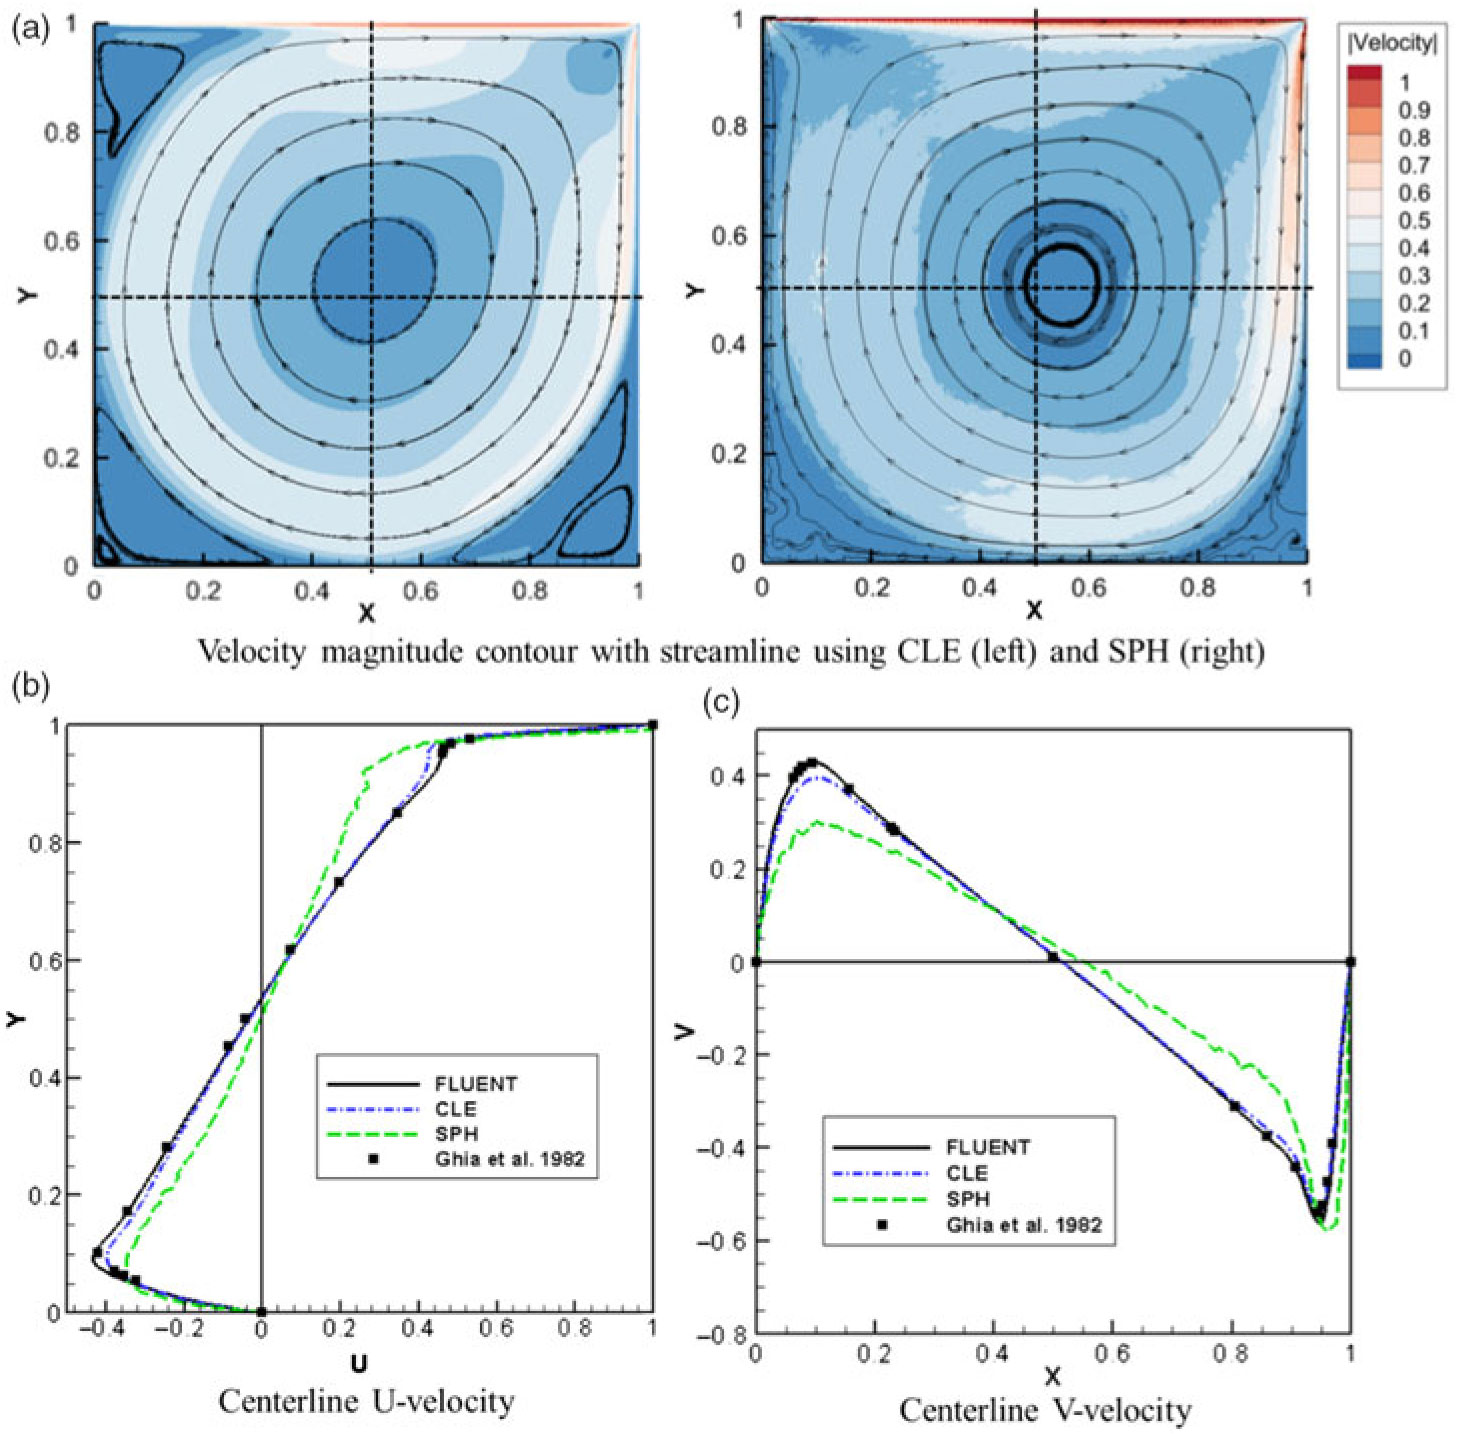
Figure 3. Streamline of the cavity for both CLE and SPH (a) with U velocity (b) and V velocity (c) along the cavity centre with various computational methods (Re=3,200) (Reference Ghia, Ghia and Shin22).
Further results are depicted in Figs. 3(b) and 3(c). The plots show U and V velocities at the centre of the cavity along the vertical and horizontal direction, respectively. The velocity plots show the quantitative accuracy of the fluid approximation using CLE and SPH by comparing the reported data from the preceding work(Reference Ghia, Ghia and Shin22) and CFD results(Reference Horton, Song, Feaster and Bayandor11). As indicated by the velocity results in each direction, the computational accuracy of CLE is superior to that of the SPH formulation with several orders of magnitude less computational effort. The modelling approach and assessment analysis developed for this study are thoroughly discussed in Ref. (bib11).
4.0 RESULTS AND DISCUSSIONS
After the numerical validation of the fluid methodology using FEA, a wedge drop simulation is performed and compared with experimental tests to assess the accuracy of the FSI strategy developed. The FEA tool used for the present study, LS-Dyna(Reference Hallquist12), offers penalty-based contact between the CLE elements and Lagrangian elements with more discrete distributions of the coupling points
 $(\sim4\ \text{points})$
, considering the dynamics of impact for the wedge drop simulations. Also, the first-order accurate advection scheme was selected based on the number of CLE elements used for the simulations.
$(\sim4\ \text{points})$
, considering the dynamics of impact for the wedge drop simulations. Also, the first-order accurate advection scheme was selected based on the number of CLE elements used for the simulations.
In order to comply with the recommended setting for contact between CLE and Lagrangian elements and to avoid instabilities, both CLE and Lagrangian element numbers within contact regions were set to a 1:1 ratio. For the wedge drop simulations using SPH, the penalty-based contact was assigned with the ratio of four SPH particles to one single Lagrangian element. After validation against the experiments, the same FSI scheme, verified using the simple wedge drop model, is applied to numerically simulate the fuselage section ditching scenario.
4.1 Validation of FSI modelling strategy using wedge drop tests
To optimise the computational time and quality of the results, multiple mesh densities are examined to represent the body of water. The optimal mesh density is then selected by conducting the grid convergence index (GCI) study(Reference Celik, Ghia, Roache, Freitas, Coleman and Raad23).
The numerical simulations are based on the experiments conducted by Zhao et al.(Reference Zhao, Faltinsen and Aarsnes.14). The wedge used for the experiment has a mass of 241 kg with a length of 1 m and a
 $30^{\circ}$
deadrise angle. For the computational work, the thickness of the water and wedge is set as 0.2 m, which corresponds to the reported instrumented length in the experiment. Gravity is applied over the entire domain, and the wedge material is defined as rigid.
$30^{\circ}$
deadrise angle. For the computational work, the thickness of the water and wedge is set as 0.2 m, which corresponds to the reported instrumented length in the experiment. Gravity is applied over the entire domain, and the wedge material is defined as rigid.
In order to reproduce the experiment numerically, a proper mesh resolution is required for both the surrounding water and the wedge. Figure 4 shows the force responses of the wedge drop simulation with three different mesh resolutions, including one that demonstrates the effect that an improper mesh size has on the wedge drop results. As shown in Fig. 4, one of the highest mesh resolution cases suffers from a contact issue when the discrepancy in the mesh resolution between the water and wedge becomes significant. In this example, a single wedge (Lagrangian) element is assigned to contact with approximately six CLE elements.
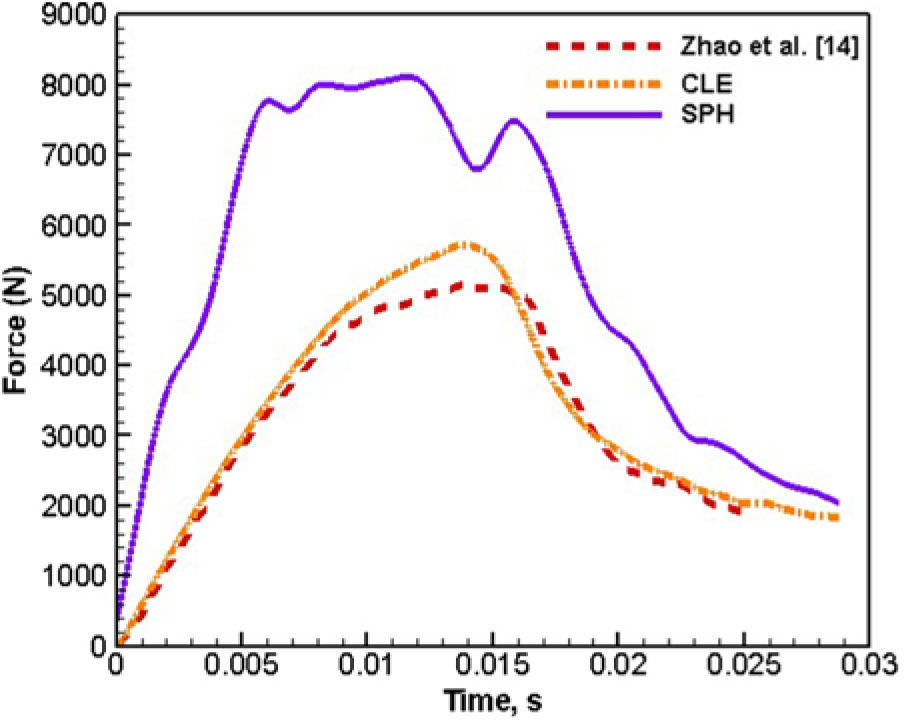
Figure 4. Force-time response between wedge and water using CLE.
To alleviate the computational error, the mesh size for the wedge is refined to a single Lagrangian element contacting with two CLE elements at the highest mesh resolution. Also, three coupling points are distributed over each Lagrangian segments to properly establish the penalty-based contact.
The same wedge model with higher mesh resolution is subsequently used in the other simulations to conduct the GCI study to assess the mesh dependence of the interactive analysis between the fluid and structure. Table 3 tabulates the result of the GCI study for the wedge drop simulation. The GCI reported in this table is calculated by averaging the GCI values at each time step. The averaged GCI between the coarse and medium mesh resolutions is 4.76%, while the medium to highest mesh resolutions shows a GCI of 2.82%. Considering the amount of computational time for each mesh density and their relative accuracy, the medium mesh resolution is selected for further simulations.
Table 3 Result of GCI study
SPH elements are also exploited in modelling the FSI event and compared with CLE results. To develop an equivalent simulation using SPH, the same number of SPH particles are assigned as the number of nodes used for the CLE medium mesh resolution to describe the water domain. To validate, the equivalent force-time response is used as a benchmark from the work done by Zhao et al.(Reference Zhao, Faltinsen and Aarsnes.14), as shown in Fig. 5. CLE produces a much more accurate result than that of the SPH formulations. Additionally, SPH requires approximately six times higher computational effort than CLE. Thus, further simulations are conducted using CLE formulation.
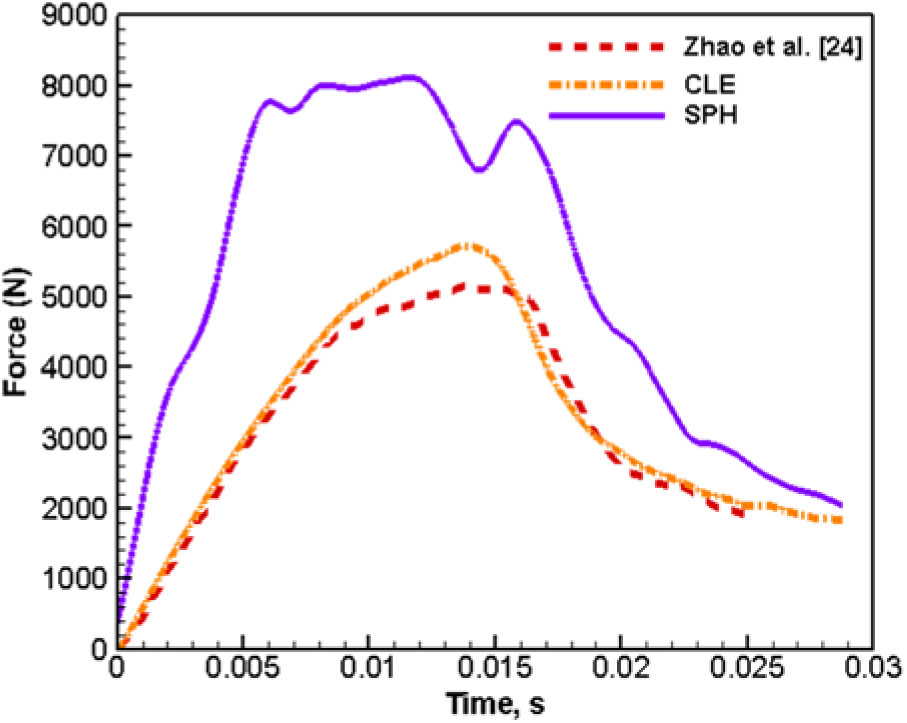
Figure 5. Force-time response of the wedge drop experiment and simulations using two different element formulations.
Given the absence of qualitative results in Ref. (14), a qualitative validation is attempted by comparing the simulations results to the work carried out by Shah(Reference Alexander, Carey, DiNardo, Gill, Gonzalez, Harry, Isidro, Judge, Puckett, Schoepfer, Song, Tilghman, Siddens, Satterwhite and Bayandor13). For an FSI event, high-speed footage offers one of the most important observations, since the impulse and g-loading signature do not describe the entire dynamic response of the interactive bi-phase system.
Figure 6 shows the comparison between the experiment and the numerical simulation of the equivalent test conducted by Shah(Reference Alexander, Carey, DiNardo, Gill, Gonzalez, Harry, Isidro, Judge, Puckett, Schoepfer, Song, Tilghman, Siddens, Satterwhite and Bayandor13). The deadrise angle for this particular experiment was reported as
 $30^{\circ}$
with an impact speed of 1.046 m/s and a mass of 1.639 kg. Further details of the experimental setup are described in Ref. (13).
$30^{\circ}$
with an impact speed of 1.046 m/s and a mass of 1.639 kg. Further details of the experimental setup are described in Ref. (13).

Figure 6. Qualitative comparison between experiment(Reference Alexander, Carey, DiNardo, Gill, Gonzalez, Harry, Isidro, Judge, Puckett, Schoepfer, Song, Tilghman, Siddens, Satterwhite and Bayandor13) and simulation.
To reduce the computational effort, the simulation uses plane symmetricity for both front and back face of the mesh. During the initial impact (0.01 s), an impinged jet flow is observed in the experiment at the interface between the free water surface and the wedge. A similar interaction is also predicted by the computational model. The thickness of the impinged flow in the computational work is significantly greater than that of the jet shown in the experiment. In the experiment, water was observed to breach the slight gap between the wedge and wall of the test section. Despite this, the comparisons between the simulation and test demonstrate a reasonable qualitative agreement. The free surface elevation during the impact remains similar between the test and analysis throughout the wedge descent window.
The disparities observed in the computational results are mostly caused by inadequate mesh resolution over the fluid domain. The CLE formulation represents the fluid body within the mesh by using volume fractions. In other words, the fluidic deformation can be more accurately presented with higher mesh density. However, the medium mesh resolution is necessary for CLE to make multiple simulations feasible.
4.2 Comprehensive analysis of fuselage section drop into water
The aforementioned fuselage model used for this study is developed based on an existing experiment(Reference Jackson and Fasanella3), with an accompanying validation thoroughly described in a preceding work by Song et al.(Reference Song, Horton, Perino, Thurber and Bayandor8). To conduct a comprehensive analysis, the FSI methodology is combined with the validated fuselage section model. Two other possible emergency landing surface candidates (soil and rigid ground) are included for comparison, with the g-loading response of the passenger floor as the common metric.
Figure 7 shows the sequential images of the water ditching simulation with the verified virtual fuselage section at 9.1 m/s impact speed. Figure 7(a) shows the initial impact, where jet flows begin to appear and interact with the fuselage. The fuselage continues to descend until 0.4 s, as shown in Fig. 7(b). At this point, the vertical motion of the fuselage is almost ceased due to the buoyancy effect. Despite gravity acting over the entire domain, the buoyancy forces stop the fuselage from uninterrupted sinking.
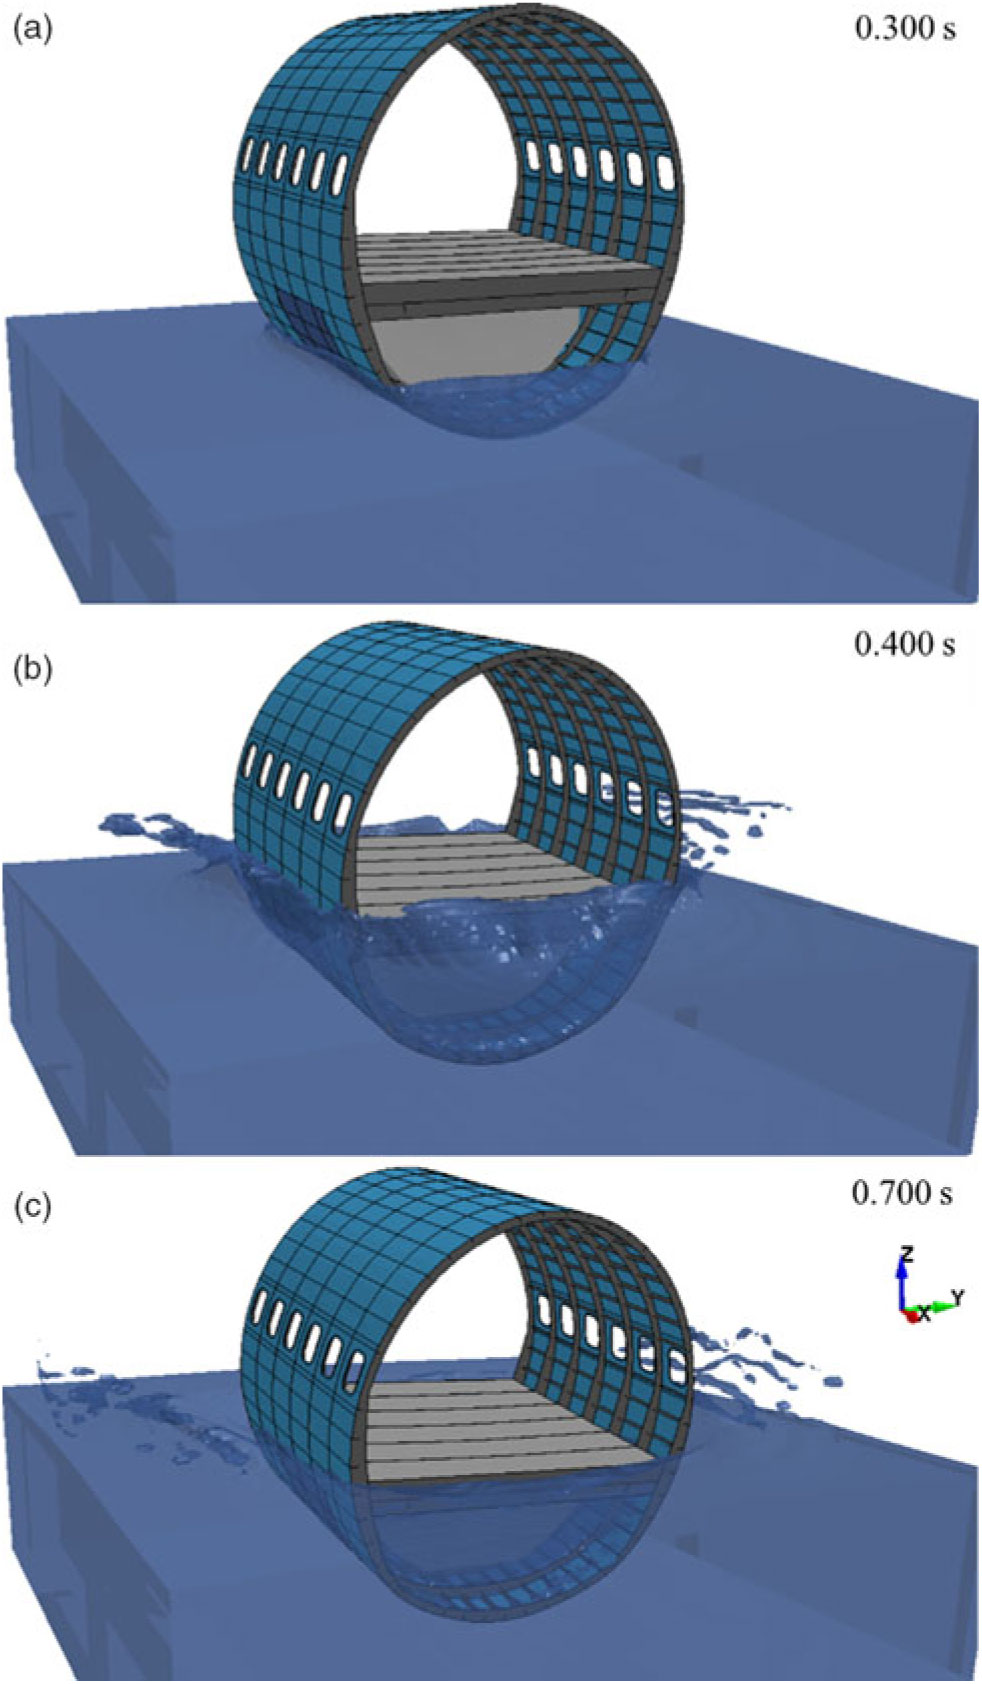
Figure 7. Fuselage section submerging into the water after impacting at 9.1 m/s.
Soon after the descending motion is stopped, shown in Fig. 7(c), the fuselage section starts rising (+Z-dir). Meanwhile, the structure tilts along its Y-axis (backward) due to the asymmetric weight distribution resulted from the location of the suspension points of the fuel tank. The section then resumes sinking as the water rushes through its front and back openings.
Figure 8 shows the computationally simulated g-loading time-history measured on the passenger floor near the cargo door for each of the landing surfaces, and Fig. 9 shows the sequential images of the stress response of fuselage section impacting at 9.1 m/s. Other than the impact surfaces, the contact conditions remain identical.
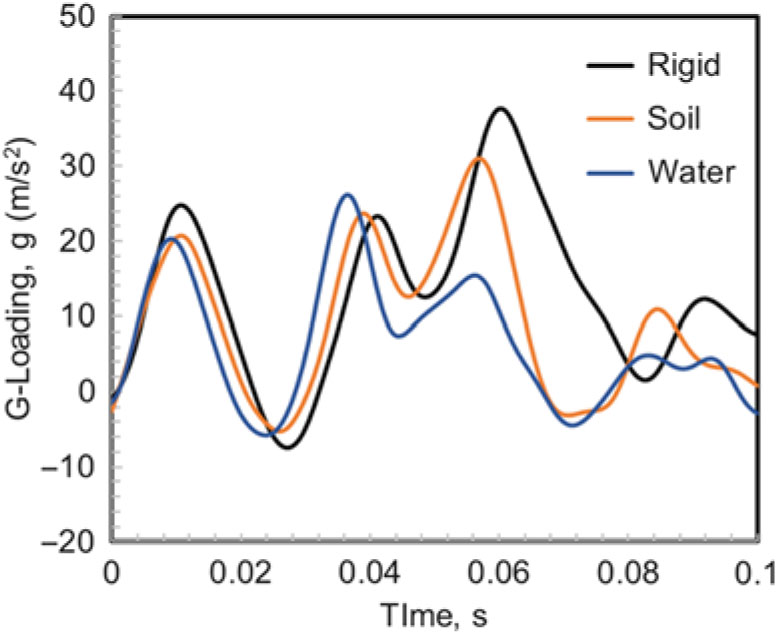
Figure 8. Comparison of g-loading on the passenger floor for three different crash-landing surfaces (9.1 m/s impact velocity).
At the moment of impact (0.01 s), the passenger floor rapidly decelerates as shown in Fig. 8. A large magnitude of stress is induced at the bottom of the fuselage section and transferred through the structure towards the passenger floor as shown in Fig. 9(a). The bottom of the fuel tank suspended from the passenger floor then comes into contact with the bottom of the fuselage section
 $(\sim 0.03\ \text{s})$
, as depicted in Fig. 9(b). Figure 9(c) highlights the moment when the top of the fuel tank, crushed by and moving in unison with the bottom of the fuselage, comes into contact with the passenger floor. The uneven stress distribution over the XY plane is due to the fuselage asymmetry resulting from the inclusion of the cargo door on the starboard side of the structure, which should not carry any shear loading. As a result, the exerted loading needs to be redistributed and carried mostly by the structure surrounding the door. This causes excess asymmetric loading on the starboard side of the structure (referring to its coordinate system, Fig. 9 depicts the back of the fuselage with the starboard side appearing on the left side of the figures).
$(\sim 0.03\ \text{s})$
, as depicted in Fig. 9(b). Figure 9(c) highlights the moment when the top of the fuel tank, crushed by and moving in unison with the bottom of the fuselage, comes into contact with the passenger floor. The uneven stress distribution over the XY plane is due to the fuselage asymmetry resulting from the inclusion of the cargo door on the starboard side of the structure, which should not carry any shear loading. As a result, the exerted loading needs to be redistributed and carried mostly by the structure surrounding the door. This causes excess asymmetric loading on the starboard side of the structure (referring to its coordinate system, Fig. 9 depicts the back of the fuselage with the starboard side appearing on the left side of the figures).
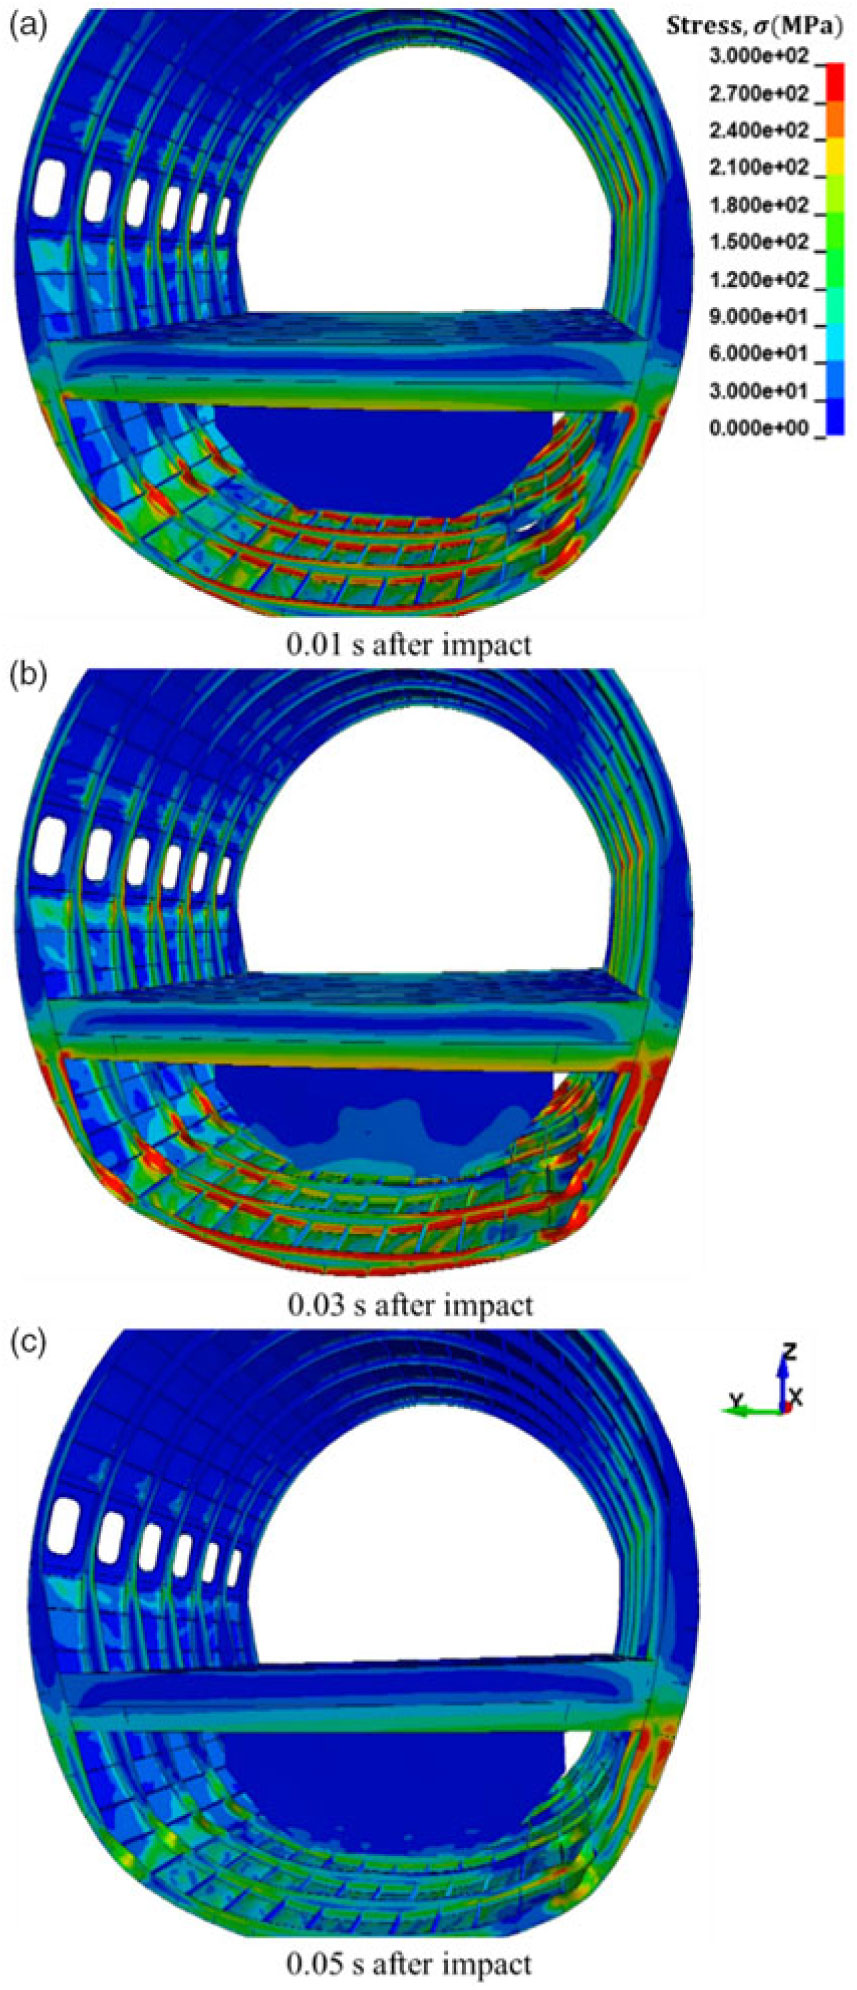
Figure 9. Sequential images of deforming fuselage section during water impact (9.1 m/s).
The corresponding g-loading is plotted in Fig. 8. The main reason why the tertiary peak loading is slightly higher in rigid terrain impact than the other soft-impact conditions is the non-deformability of the rigid ground. The dissipation of kinetic energy is strongly tied to the structural deformation. In the rigid ground impact case, the fuselage structure is allowed to deform more extensively as the impact proceeds, which contributes to higher deceleration. The structural deformation in the water impact case is, however, not as severe. Therefore, the second impact (between the bottom of the fuel tank and the fuselage) in the case of water ditching occurs earlier than that of the other two scenarios. The advanced timing of the second peak in this event can be observed in Fig. 8.
As depicted, the g-loading transferred to the passenger floor at this instance
 $(\sim 0.03\ \text{to}\ 0.04\ \text{s})$
is slightly higher than that of the rigid ground. In other words, the g-loading based on the second impact peak gradually increases inversely with the stiffness of the impact surface. This is since the kinetic energy absorbing mechanisms embedded in the fuselage structures perform less effectively when coming into contact with softer terrains.
$(\sim 0.03\ \text{to}\ 0.04\ \text{s})$
is slightly higher than that of the rigid ground. In other words, the g-loading based on the second impact peak gradually increases inversely with the stiffness of the impact surface. This is since the kinetic energy absorbing mechanisms embedded in the fuselage structures perform less effectively when coming into contact with softer terrains.
Finally, as the impact progresses, the maximum g-loading occurs at the third point of contact
 $(\sim 0.06\ \text{to}\ 0.07\ \text{s})$
, as shown in Fig. 8. As discussed, this is the moment when the fuel tank suspension rail buckles and the fuel tank collides with the passenger floor in both impact scenarios onto rigid and soil terrains. Unlike the other two cases, the passenger floor does not severely contact with the fuel tank suspended underneath the passenger floor during water ditching.
$(\sim 0.06\ \text{to}\ 0.07\ \text{s})$
, as shown in Fig. 8. As discussed, this is the moment when the fuel tank suspension rail buckles and the fuel tank collides with the passenger floor in both impact scenarios onto rigid and soil terrains. Unlike the other two cases, the passenger floor does not severely contact with the fuel tank suspended underneath the passenger floor during water ditching.
Given the distinct differences seen in the failure mechanisms of a sample fuselage section when coming into contact with soft terrains, in particular water, a closer assessment of the applicability of the sequential damage triggers used in the design of the future aircraft structures during gears up, soft emergency landing will be imperative.
5.0 CONCLUSION
Maintaining and enhancing high safety standards in modern aviation is a necessity. Currently, most aircraft crashworthiness evaluations are performed based on the hard-impact assumption, despite the fact that, depending on flight routes, an emergency landing on water is also a valid option. In short, any changes in ground substance causes changes in the structural dynamics during impact due to the differing deformation and mechanical response of the impact surface. Therefore, in the present study, a time-explicit FEA framework incorporating a fully verified and partially validated FSI strategy is uniquely applied to determine aircraft structural response during water ditching using the verified Boeing 737 fuselage section model from an earlier study.
To develop a high-fidelity fuselage section drop simulation into water, a thorough verification and validation procedure is performed for the fluid deformation as well as the coupling capabilities with structures using FEA tool, beginning with a series of wedge drop tests to ensure the accuracy of the FSI method. The modelling scheme is then extended to incorporate the validated deformable fuselage section, created in an earlier program, to characterise the dynamic response of the structure as it impacts water. Throughout the investigations, it was shown that aircraft emergency ditching could prompt a different series of damage responses as opposed to what is seen in a rigid-ground impact. This distinction is due to the non-linearity of the intricate FSI event involved and the resulting loading conditions applied to the structure.
Although this study has primarily focused on the assessment of the verified fuselage section ditching into water, the results imply the necessity for further investigation and understanding of the overall structural response of an aircraft in the event of emergency landing onto different terrains due to the significant changes in damage progression within the fuselage. The proposed FSI modelling strategy, perfected and evaluated, has the capability to be adapted to effectively predict comprehensive structural damage characteristics under soft- or hard-impact landing scenarios and can directly contribute to improving future studies aimed at advancing crashworthiness measures in future aerospace structures.


