


Introduction
Globally, the concept of soil health is associated with the continuous capacity of the soil to function as a living ecosystem to perform its functions related to maintaining environmental quality (air and water), promoting human health, and supporting crop productivity (Lal, Reference Lal2020; Haney et al., Reference Haney, Haney, Smith, Harmel and White2018; Karlen et al., Reference Karlen, Veum, Sudduth, Obrycki and Nunes2019; Chang et al., Reference Chang, Feng, Paul, Adeli and Brooks2022; Kopittke et al., Reference Kopittke, Minasny, Pendall, Rumpel and McKenna2024). Due to its broad and intricate nature, there is no direct method to measure soil health. Instead, its evaluation relies on the integration of chemical, physical, and biological indicators, along with their interactions (Cherubin et al., Reference Cherubin, Carvalho, Cerri, Nogueira, Souza and Cantarella2021).
With growing global interest and the potential to achieve sustainable development goals through healthy soils (Lal et al., Reference Lal, Bouma, Brevik, Dawson, Field, Glaser, Hatano, Hartemink, Kosaki, Lascelles, Monger, Muggler, Ndzana, Norra, Pan, Paradelo, Reyes-Sánchez, Sandén, Singh and Zhang2021), on-farm and analytical approaches have been developed. Internationally, the Soil Management Assessment Framework (SMAF) (Andrews et al., Reference Andrews, Karlen and Cambardella2004) stands out as one of the most advanced analytical models (Lehmann et al., Reference Lehmann, Bossio, Kögel-Knabner and Rillig2020) and has been successfully used in different management systems worldwide to measure soil health in various regions (Şeker et al., Reference Şeker, Özaytekin, Negiş, Gümüş, Dedeoğlu, Atmaca and Karaca2017; Bermeo et al., Reference Bermeo, Hincapie, Cherubin, Morea and Olaya2022; Becker et al., Reference Becker, Giarola, Paula, Schiebelbein and Luz2024).
SMAF is a quantitative approach that evaluates soil health using a variety of physical, chemical, and biological indicators. These indicators typically include parameters such as organic matter content, nutrient levels, and water holding capacity, among others. Although this framework provides accurate and reliable assessments, it requires the use of specialised equipment and effective data management. In Brazil, the tool was used, highlighting its applicability and sensitivity in distinguishing agricultural crop diversification and land use in the Central-Southern region of Brazil (Cherubin et al., Reference Cherubin, Karlen, Franco, Cerri, Tormena and Cerri2016b; 2017; da Luz et al., Reference da Luz, da Silva, Kochem Mallmann, Bonini Pires, Debiasi, Franchini and Cherubin2019), effects of sugarcane straw removal (Lisboa et al., Reference Lisboa, Cherubin, Satiro, Siqueira-Neto, Lima, Gmach, Wienhold, Schmer, Jin, Cerri and Cerri2019; Cherubin et al., Reference Cherubin, Carvalho, Cerri, Nogueira, Souza and Cantarella2021), agroforestry systems (Matos et al., Reference Matos, Cherubin, Damian, Rocha, Pereira and Zonta2022; Pereira et al., 2024), mangroves (Jimenez et al., Reference Jimenez, Queiroz, Ferreira and Cherubin2022), and Technosols (Ruiz et al., Reference Ruiz, Cherubin and Ferreira2020) drylands (Lima et al., Reference Lima, Cherubin, da Silva, Mota, Silva, Araujo, Melo, Verma and Pereira2024).
Soil structure plays a critical role in indicating soil health, as it directly influences water infiltration, root growth, microbial activity, and overall soil resilience (Bronick & Lal, Reference Bronick and Lal2005; Rabot et al., Reference Rabot, Wiesmeier, Schlüter and Vogel2018). The visual evaluation of soil structure (VESS) (Ball et al., Reference Ball, Batey and Munkholm2007; Guimarães et al., Reference Guimarães, Ball and Tormena2011; Giarola et al., Reference Giarola, da Silva, Tormena, Guimarães and Ball2013) is an example of an on-farm empirical and qualitative approach for assessing topsoil structure changes.
VESS integrates soil properties related to the size, strength, and porosity of aggregates and root characteristics into a single score (Sq–structural quality) that ranges from 1 (good structural quality) to 5 (poor structural quality). This method is easily assessed in the field, provides immediate results, and facilitates communication between farmers and scientists (Bünemann et al., Reference Bünemann, Bongiorno, Bai, Creamer, De Deyn, de Goede, Fleskens, Geissen, Kuyper, Mäder, Pulleman, Sukkel, van Groenigen and Brussaard2018; Franco et al., Reference Franco, Guimarães, Tormena, Cherubin and Favilla2019; Valani et al., Reference Valani, Vezzani and Cavalieri-Polizeli2020), making it a good tool for conducting faster assessments with relevant results and integrating management programmes (Emmet-Booth et al., Reference Emmet-Booth, Forristal, Fenton, Ball and Holden2016).
Interest in soil health is increasing both in the productive sector and the academic community. According to the SCOPUS platform, a search for scientific articles using the terms ‘soil quality’ OR ‘soil health’ retrieved 26.849 articles (1975–2024), which reveals that Brazil ranks fourth in the number of publications, behind India, the USA, and China. However, less than 10% of these publications integrate chemical, physical, and biological indicators to assess soil health (Simon et al., Reference Simon, Gomes, Pessoa, Soltangheisi, Bieluczyk, Camargo, Martinelli and Cherubin2022). This presents an opportunity to advance knowledge in soil health, specifically to distinguish soil health by different approaches (Bünemann et al., Reference Bünemann, Bongiorno, Bai, Creamer, De Deyn, de Goede, Fleskens, Geissen, Kuyper, Mäder, Pulleman, Sukkel, van Groenigen and Brussaard2018; Karlen et al., Reference Karlen, Veum, Sudduth, Obrycki and Nunes2019) and investigate whether the approaches lead to similar outcomes. Thus, our hypothesis is that the VESS can effectively capture variations in soil health across environmental soil properties (e.g. clay content and different slope positions) and is closely related to the results obtained from the SMAF.
Material and methods
Study area
The study area is located in Ponta Grossa, in the state of Paraná (latitude 25°5’ 48.06’S and longitude 50°2’ 46.23’W), with an altitude of 1,021.93 m. The climate of the region is Cfb (humid subtropical, without a dry season) according to Koppen’s classification (Alvares et al., Reference Alvares, Stape, Sentelhas, de Moraes Gonçalves and Sparovek2013), with an annual rainfall and temperature average of 1,545 mm and 18°C, respectively (IAPAR, 2000). The soil has a sandy clay loam texture (Table 1) with clay variation in slope evaluated (32–21% of clay), classified as a Typic Hapludox (Soil Survey Staff, 2010), and had been cultivated under a no-till system for 25 consecutive years at the time of the experiment, with the following crop rotation over the years: maize (Zea mays), soybean (Glycine max) in spring/summer, and wheat (Triticum aestivum) intercropped with black oat (Avena strigosa) + radisch (Raphanus sativus) in autumn/winter.
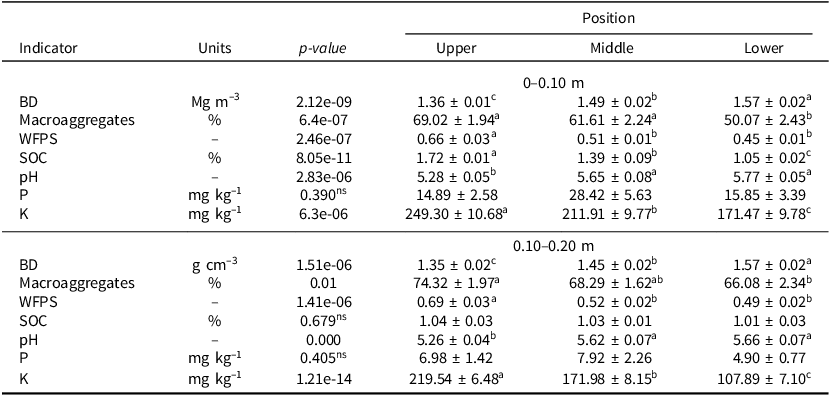
Table 1. Soil physical characterisation in a slope divided into three segments: upper, middle, and lower positions at the depth of 0–0.10 m and 0.10–0.20 m under a no-till management system

Sampling scheme and analysis
A sampling scheme was designed to cover a distance of 420 m, taking into account the textural and topographical aspects of the experimental area. The slope was divided into three different topography positions: upper, middle, and lower, and each position was distributed with 20 sampling points at 10 m intervals. Soil sampling and analysis were conducted within one metre of each sampling point (Figure 1), at depths of 0–0.10 m and 0.10–0.20 m. Disturbed samples were collected at each point and depth for biological and chemical analyses, and for physical analyses, undisturbed samples were collected using 100 cm3 volume rings at all points and layers. The sample points were georeferenced with a CR Campeiro (Giotto et al., Reference Giotto, Cardoso and Sebem2013) and can be found in the supplementary material (Table S1).

Figure 1. Slope positions: upper, middle, and lower.
Soil bulk density (BD) was calculated by dividing dry soil mass (oven-dried for 24 h at 105°C) by ring volume, according to the method described by Teixeira et al. (Reference Teixeira2017). Water-filled pore space (WFPS) was calculated by dividing volumetric moisture at -6 kPa by total porosity as indicated in Wienhold et al. (Reference Wienhold, Karlen, Andrews and Stott2009), and total porosity was used only to obtain WFPS and was calculated as TP = 1 - (BD/PD), where PD is particle density, and we used 2.65 g cm–3 as the reference value (Hillel, Reference Hillel2004). Wet macroaggregate stability was determined using a vertical oscillator according to Elliot (Reference Elliott1986) with three sieves (2000, 250, and 53 μm) moving at a speed of 30 oscillations per min for 10 min. The percentage of macroaggregates was calculated by summing aggregate mass for >2000 and 250 μm classes, dividing by the total soil mass, and multiplying by 100. For pH, available phosphorus (P) and potassium (K) were determined using analytical methods according to Teixeira et al. (Reference Teixeira2017). The soil organic matter content was determined by the loss-on-ignition method (Goldin., Reference Goldin1987), and after conversion to soil organic carbon (SOC), a conversion factor of 1.724 was used.
Soil management assessment framework (SMAF)
The SMAF tool was used to evaluate the position of slope on soil health. The SMAF assessment is based on three steps: (i) selecting a minimum dataset; (ii) interpreting measured indicators; (iii) integrating indicators into an overall index. Our dataset included seven soil indicators: pH, P, K, BD, macroaggregates, WFPS, and SOC. These measurements provide site-specific soil chemical, physical, and biological data (Andrews et al., Reference Andrews, Karlen and Cambardella2004; Wienhold et al., Reference Wienhold, Karlen, Andrews and Stott2009) that meet all criteria (i.e. conceptual, practical, sensitivity, and interpretation) for appropriate soil health indicators and are widely used in soil health studies both in Brazil (Simon et al., Reference Simon, Gomes, Pessoa, Soltangheisi, Bieluczyk, Camargo, Martinelli and Cherubin2022) and globally (Bünemann et al., Reference Bünemann, Bongiorno, Bai, Creamer, De Deyn, de Goede, Fleskens, Geissen, Kuyper, Mäder, Pulleman, Sukkel, van Groenigen and Brussaard2018). In addition, this set of indicators addresses various soil functions and ecosystem services, such as supporting crop yield and resilience; facilitating nutrient cycling and carbon sequestration; regulating water infiltration, retention, and release; and providing habitat for soil organisms (Cherubin et al., Reference Cherubin, Karlen, Cerri, Franco, Tormena, Davies and Cerri2016a).
The values measured for the soil indicators, originally expressed in different units, were transformed into scores ranging from 0 to 1, using the algorithms (scoring curves) presented in the SMAF spreadsheet. The standardisation process of the soil indicators into scores is tailored to account for variations dependent on the soil type, soil texture and mineralogy, climate, slope, crop type, and analytical method used (Andrews et al., Reference Andrews, Karlen and Cambardella2004; Wienhold et al., Reference Wienhold, Karlen, Andrews and Stott2009). The organic matter class had a factor of 4; the texture class had a factor of 4; the climate class had a factor of 1 (≥170-degree day and ≥550 mm mean annual rainfall); the mineralogy class had a factor of 3 (1:1 clay and Fe and Al oxides); the slope class had a factor of 1 for upper, 3 for middle and 4 for lower slope positions; and the weathering class had a factor of 2; for the P extractable was used Mehlich–1 (code 1). The interpretation of the limits (critical and optimal levels) of the pH, P, and K values followed the recommendations for soils and culture of the Fertilisation and Lime Manual for the State of Paraná, according to Pavinato et al. (Reference Pavinato, Pauletti, Motta and Moreira2017).
Finally, all indicator scores were integrated into an overall SHI using a weighted additive approach (Eq. (1)).
 $$SHI = {\it \Sigma} \;SiWi$$
where Si is the indicator score and Wi is the weighted value of the indicators. The indicators were weighted based on chemical (pH, P, and K), physical (BD, macroaggregates, and WFPS) and biological (SOC) components, so regardless of the number of indicators, each group had an equal weight (33.33%) in the final index (Cherubin et al., Reference Cherubin, Karlen, Cerri, Franco, Tormena, Davies and Cerri2016a).
Visual evaluation of soil structure (VESS)
The evaluation was carried out according to the methodology proposed by Ball et al. (Reference Ball, Batey and Munkholm2007) and Guimarães et al. (Reference Guimarães, Ball and Tormena2011). This method allows for a rapid, semi-quantitative assessment of soil structure. Mini trenches measuring approximately 0.20 m wide, 0.22–0.25 m long, and 0.20 m deep were opened using a spade. From each trench, semi-deformed soil blocks were carefully extracted, and VESS assessment was performed, focusing on the parameters used to describe soil structure: size, porosity, and strength of aggregates; number and distribution of roots; and colour and shape of aggregates. Based on these characteristics, the structural quality was scored using the VESS, a chart which ranges from Sq = 1 (best structural quality, with well-formed, friable aggregates) to Sq = 5 (poor structural quality, where the soil is highly compacted with large, hard clods).
Data analysis
The data were subjected to analysis of variance within a strip block with the assumption of normality being verified by the Shapiro–Wilk test (p > 0.05). In cases where significant differences were found (F test < 0.05), mean comparisons were conducted using Tukey’s test (p < 0.05). Principal component analysis (PCA) was performed to understand the relationships of each component of the clay content with the SHI (chemical, physical, and biological), the SHI scores (for the layer 0–0.20 m), and VESS scores. All analyses were carried out using RStudio software, version 4.0.4 (R Development Core Team, 2021), using the R packages ‘Agricolae’ (Mandiburu, 2017), ‘Hmisc’ (Harrell et al., Reference Harrell and Dupont2023), and ‘Factoextra’ (Kassambara, Reference Kassambara2023).
Results
SMAF indicators across the slope
The seven soil health indicators evaluated at different slope positions in the 0–10 and 0.10–0.20 m soil layers are presented in Table 1. Slope position affected soil health indicators (p < 0.05). For physical indicators, BD values increased by 10% from the upper to the middle (1.36–1.49 Mg m–3) and by 5% (1.49–1.57 Mg m–3) from the middle to the lower third in both layers. The proportion of macroaggregates decreased with an increase in slope from 70 to 50% in the 0–0.10 m layer and from 70 to 66% in the 0.10–0.20 m layer. WFPS scored highest (∼ 0.69) in the upper third in both soil layers. SOC decreased 19% from upper to middle (1.72 to 1.39%) and 25% from middle to lower (1.39 to 1.05) in the 0–0.10 m soil layer (0–0.10 m). No differences in SOC were observed in the slope position (p > 0.05) for the 0.10–0.20 m soil layer.
In addition to the physical and biological indicators, the chemical analysis revealed distinct patterns across the slope positions (Table 1). Soil pH values increased in the middle (5.66) and lower (5.77) thirds of the 0–0.10 m soil layer and similarly in the 0–0.20 m soil layer, with values of 5.62 and 5.66, respectively. No significant differences in P were observed across the slope positions (p > 0.05) in both soil layers. The K followed a similar pattern of variation as the physical and biological indicators, with changes (p > 0.05) observed between slope positions. For the superficial layer (0–0.10 m), increasing the slope of the slope caused a 15% (249 to 211 mg kg-1) reduction in the upper-to-middle position and a 19% (211 to 171 mg kg-1) reduction in the middle-to-lower position. The same pattern was observed for the subsurface layer (0.10–0.20 m) with a reduction of 22% (219 to 171 mg kg–1) in the upper-to-middle and 37% (171 to 107 mg kg–1) in the middle-to-lower position.
The overall soil health index (SHI) and its components (chemical, physical, and biological) for each soil layer 0–0.10 (A), 0.10–0.20 (B), and 0–0.20 m (C) are presented in Figure 2. For the superficial soil layer (0–0.10 m) (Figure 2-A), the soil health chemical (SHC) index was higher (p < 0.05) in the middle and lower positions, reaching values of 0.94 and 0.92, respectively, compared to the upper position (0.87). On the other hand, the physical and biological SHIs exhibited different patterns in slope positions (p < 0.05). The soil health physical (SHP) index showed a decrease from 0.77 and 0.73 to 0.69 for the upper, middle, and lower thirds, respectively. The values of the biological index (SHB) were higher in the upper and middle thirds compared to the lower third, reaching 0.98, 0.81, and 0.70, respectively. The scoring of the SHI showed changes (p < 0.05) between slope positions. The differences between the upper (0.86) and lower (0.76) thirds as well as the middle (0.82) and lower (0.76) thirds had the same magnitude of reduction (about 14%), and the upper-to-middle third had a decrease of 5% (0.86 to 0.82).

Figure 2. Overall soil health index (SHI) and weighted contribution of the chemical (SHC), physical (SHP), and biological (SHB) components for layers A (0–0.10 m), B (0.10–0.20 m), and C (0–0.20 m) under the position of slope (upper, middle, and lower). Means followed by the same letter do not differ by Tukey’s test (p < 0.05). ns: not significant.
In the subsurface soil layer (0.10–0.20 m) (Figure 2-B), no differences in SHC, SHB, and SHI were observed in relation to slope (p > 0.05). For the Soil Health Physical (SHF), the upper third (0.78) had higher values compared to the lower third (0.71). When considering the combined 0–0.20 m soil layer (Figure 2-C), the lower third had the lowest values of SHP (0.70), SHB (0.69), and SHI (0.73) compared to the middle and upper thirds (p < 0.05). The decrease in slope, represented in the upper and middle thirds, reached values of 0.77, 0.84, and 0.80 for the upper and 0.74, 0.75, and 0.78 for the middle thirds in SHP, SHB, and SHI, respectively. No effects of slope position were observed in SHC (p > 0.05).
VESS scores across the slope
The VESS scores by layers (0–0.10 m, 0.10–0.25 m) and overall (0–0.25 m) at the slope positions are presented in Figure 3. For the surface layer (0–0.10 m), the lowest scores were observed in the lower (1.45) and upper thirds (2.20), while in the middle third, scores exceeded the critical limit of 3 (p < 0.05). In contrast, for the subsurface layer (0.10–0.25 m), the slope position significantly affected soil structure quality (p < 0.05). The slope increase led to a 51% rise in scores from upper to middle (2.63 to 3.98) and a 48% rise from upper to lower (2.63 to 3.89), with both exceeding the limit of 3.
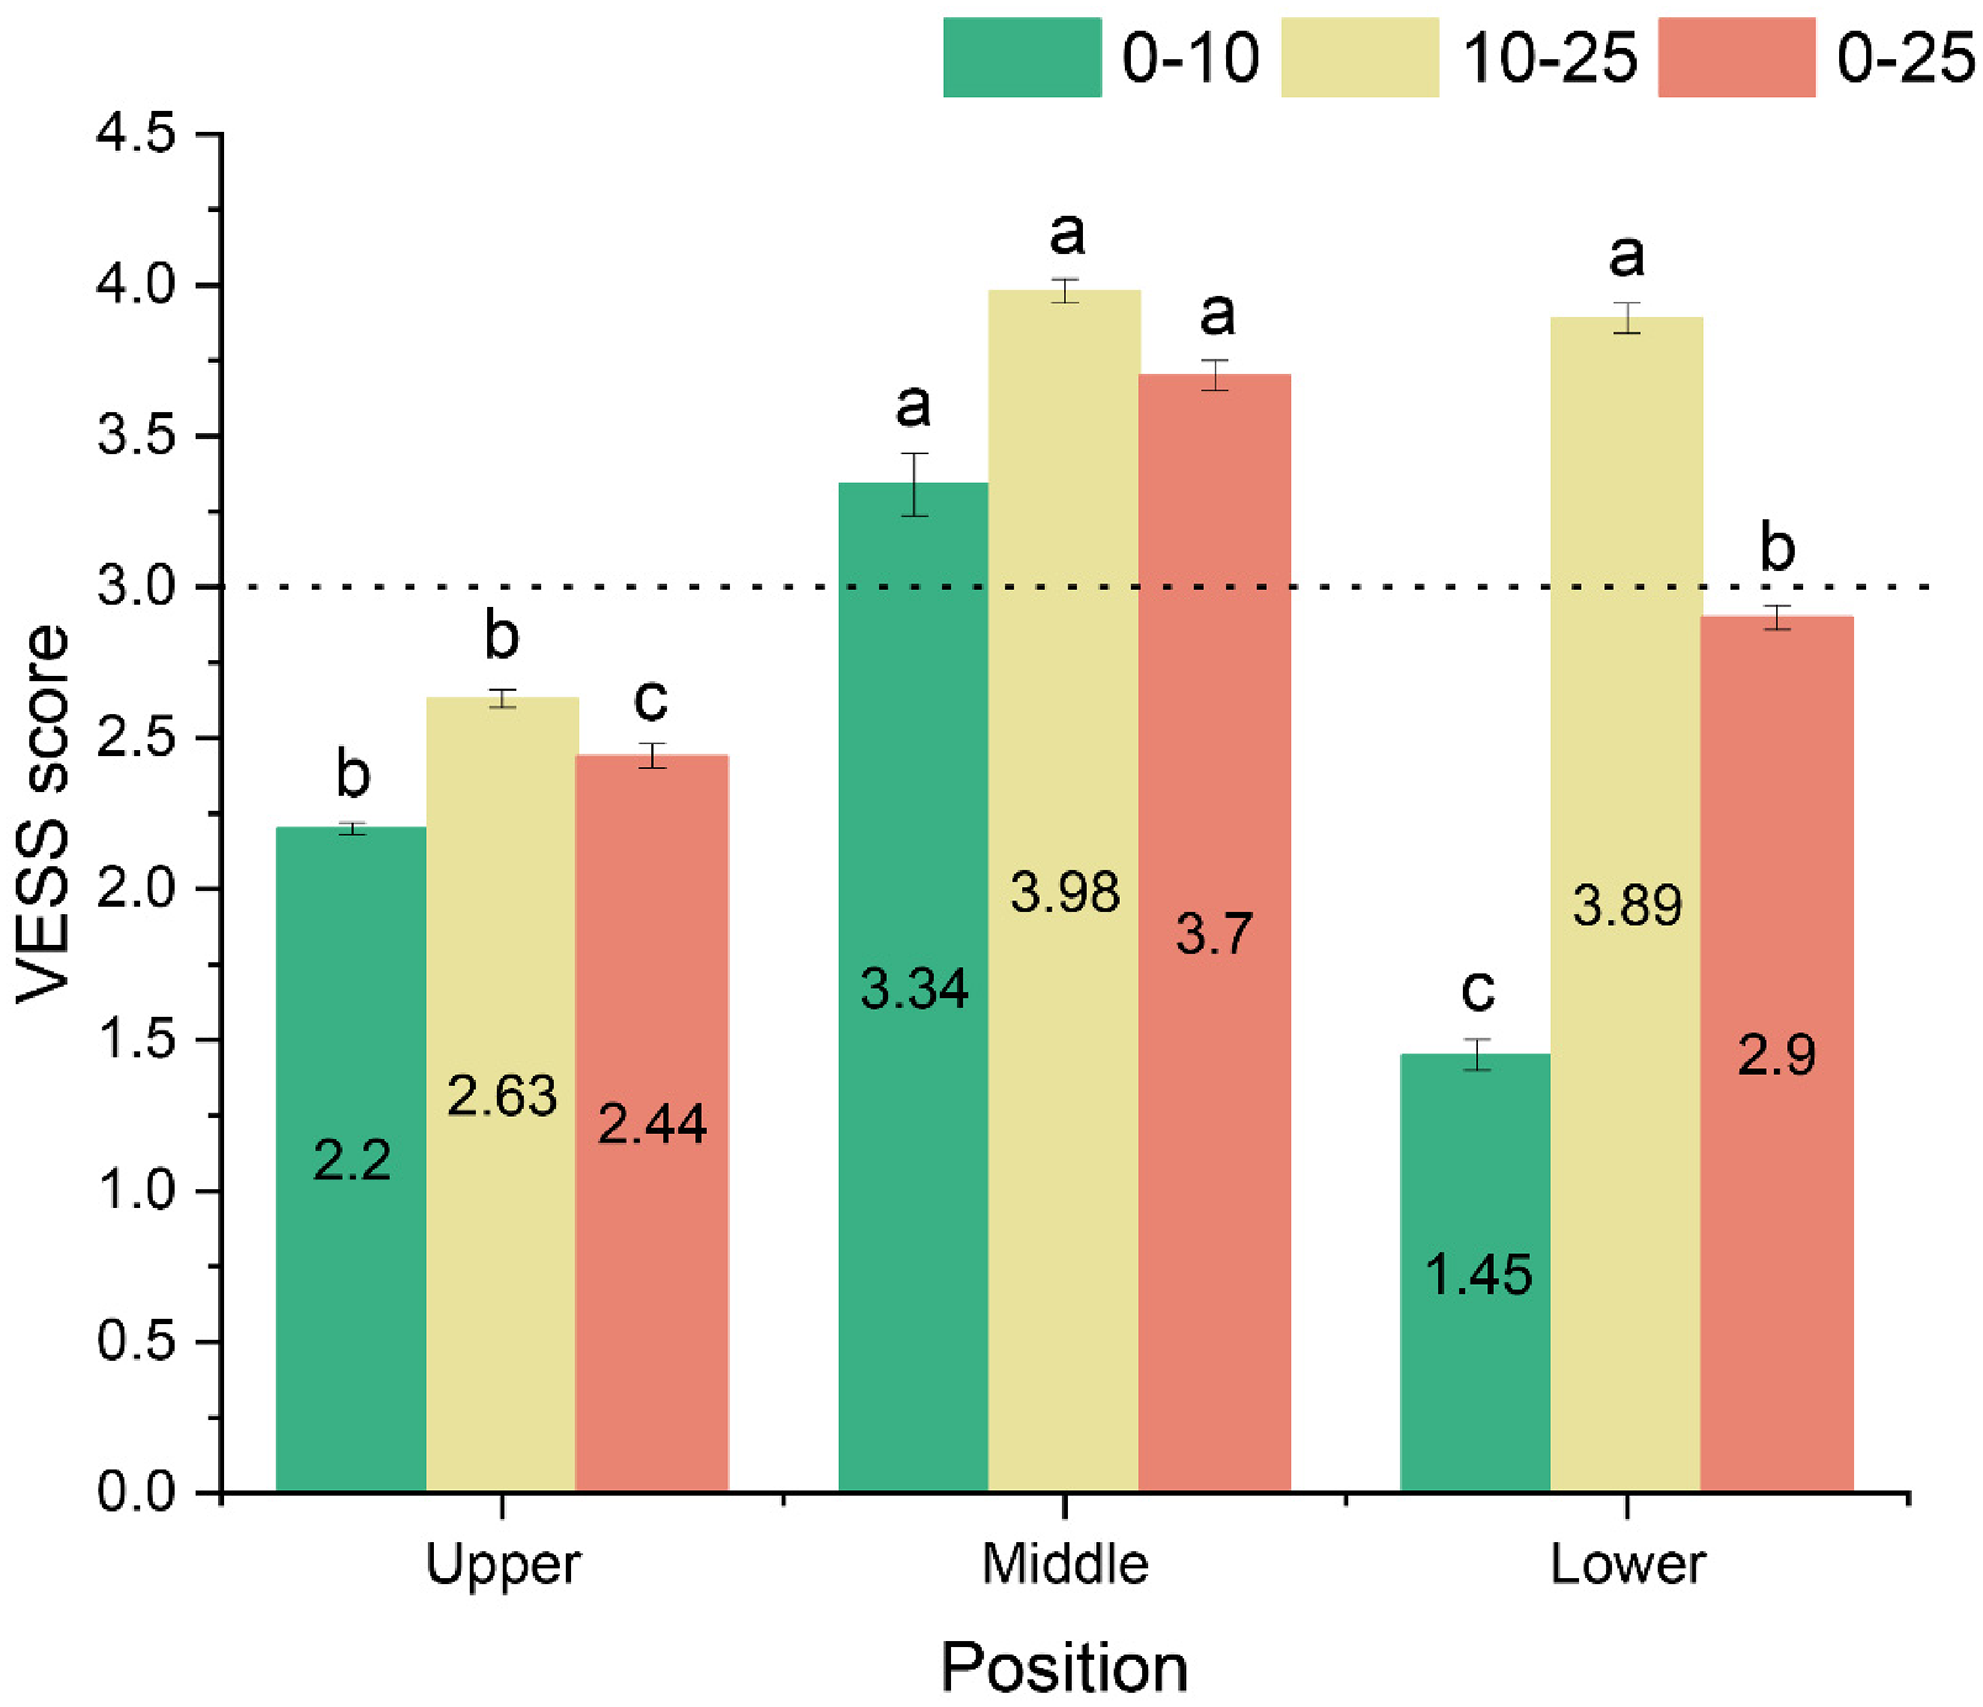
Figure 3. VESS scores by layers (0–0.10 and 0.10–0.20 m) and overall (0–0.25 m) in the position of slope (upper, middle, and lower). The black-dashed line indicated the VESS score (Sq = 3.0) considered as a threshold for suitable root growth. Means followed by the same letter do not differ by Tukey’s test (p < 0.05).
The evaluation of the 0–0.25 m layer (Figure 3) followed a similar pattern to that of the 0.10–0.20 m soil layer, with slope position significantly affecting soil structure quality, with an increase in thirds as the slope increases (p < 0.05). The upper-to-middle position showed a 52% increase in scores, rising from 2.44 to 3.7, while the upper-to-lower position exhibited a 19% increase, from 2.44 to 2.9. In contrast, the middle-to-lower position experienced a 27% decrease in scores, dropping from 3.98 to 2.9, falling below the threshold of 3.
Comparison of soil health index, visual evaluation of soil structure, and clay content between slope positions
The relationship between SHI components (physical, biological, and chemical), clay content, and VESS scores, as analysed by PCA (Figure 4). The first two principal components account for 66.5% of the total variance. Clay content, SHB, SHP, and SHI are positively correlated with each other and exhibit a strong negative correlation with VESS scores. This indicates that as clay content and SHI increase, VESS scores decrease, reflecting an improvement in soil structural quality.

Figure 4. Principal component analysis (PCA) of 0–0.20 m depth in the position of slope. Soil health biological (SHB), soil health physical (SHP), soil health (SHI), soil health chemical (SHC), and visual evaluation of soil structure (VESS).
Overall, the PCA results confirm that slope position significantly influences soil health indicators, with clear differences between the upper, middle, and lower thirds of the slope. The findings suggest that biological (SHB) and physical (SHP) indicators play a critical role in soil health (SHI) at the upper position, which exhibited the lowest VESS scores, indicating the best soil structural quality.
Discussion
Soil health affected by slope positions
The slope position significantly affects soil health (Figure 1). The upper and middle slope positions show better soil health (soil operates up to 80% of its capacity) as a result of the improvement of physical and biological components (Figure 2). These results are related to the clay content values in these thirds (Table 1). Clay is a predictor variable of soil health (Fowler et al., Reference Fowler, Basso and Maureira2024) and a critical agent in the formation of organo-mineral interactions responsible for soil aggregation, and the amount of clay present is an inherent factor that influences soil health (Hatano et al., Reference Hatano, Mukumbuta and Shimizu2024; Cherubin et al., Reference Cherubin, Carvalho, Cerri, Nogueira, Souza and Cantarella2021).
Soils containing a higher amount of clay hold more carbon because of their capacity to stabilise organic matter. This is due to a larger surface area and more reactive sites for organic carbon to bond, forming strong organo-mineral complexes (Churchman et al., Reference Churchman, Singh, Schapel, Sarkar and Bolan2020). In addition, there is greater water retention, nutrient availability, and the formation of stable aggregates (Dexter Reference Dexter2004), contributing to lower soil density, as observed in this study (Table 2).
Table 2. Mean values and standard error of the indicators under the position of slope (upper, middle, and lower) in the 0–0.10 m and 0.10–0.20 m soil layers
Means followed by the same letter do not differ by Tukey’s test (p < 0.05). ns: not significant. BD: bulk density; WFPS: water-filled pore space; SOC: soil organic carbon; P: phosphorus; K: potassium.
The soil in slope positions is derived from the Ponta Grossa and Furnas formations. In the upper slope position (Figure 1), there is a greater influence of the Ponta Grossa Formation, characterised by higher proportions of clay particles. In the lower slope position, there is a greater influence of the Furnas Formation, forming soils with higher proportions of sand (IAT; Sá, Reference SÁ1995; Melo e Giannini, 2007; Grahn et al., Reference Grahn, Mendlowicz Mauller, Breuer, Bosetti, Bergamaschi and Pereira2010). So far, no known studies have assessed soil health under these conditions, demonstrating its influence on soil health.
Soil structural quality in response to slope positions
It is well understood that the results of visual assessments are influenced by soil texture (Giarola et al., Reference Giarola, da Silva, Tormena, Guimarães and Ball2013; Newell-Price et al., 2013), as coarser and less cohesive soils tend to break up into angular and subangular fragments, often resulting in higher scores. However, clay content is a key factor in improving soil structure, largely because of its interaction with organic matter (Six et al., Reference Six, Bossuyt, Degryze and Denef2004; Lavalle et al., 2019). Higher clay content often leads to better soil aggregation (Bronick & Lal, Reference Bronick and Lal2005), which is critical for the retention of organic matter and water (Six et al., Reference Six, Bossuyt, Degryze and Denef2004), contributing to improved soil stability as we could see in this study.
Additionally, VESS may overestimate soil quality in sandy soils due to their naturally loose structure, potentially underestimating the impacts of degradation processes such as erosion or nutrient leaching. Further refinement of the VESS method is needed to account for these limitations and provide a more accurate assessment of soil quality in sand-dominated environments (Guimarães et al., Reference Guimarães, Neves Junior, Silva, Rogers, Ball, Montes and Pereira2017). As a result, it is essential to complement VESS with additional soil quality assessment tools, such as quantitative indicators of physical, chemical, and biological properties, to provide a more holistic evaluation of soil health in these contexts (Cherubin et al., 2017). Higher clay content in the upper slope position was associated with improved soil health indicators, as measured by both VESS and the SMAF. The upper position, with the highest clay content, exhibited better aggregation, lower bulk density, and higher water-filled pore space (WFPS), all of which contributed to superior soil structural quality and health (Table 2). In contrast, the middle and lower slope positions, with lower clay content, demonstrated poorer soil structure, as indicated by higher VESS scores.
To gain a more detailed understanding of these variations in soil structure, it is essential to analyse the VESS in layers rather than solely relying on block sampling. While traditional VESS assessments focus on block sampling, where overall soil quality is assessed by examining a single soil sample, layer-by-layer analysis provides a deeper insight into how soil structure differs at different depths, such as compaction, differences in water retention, or changes in root penetration zones (Pereira et al., 2022). By analysing the soil in layers, VESS allows for the identification of vertical heterogeneity within the soil profile, providing a more detailed picture of soil health (Guimarães et al., Reference Guimarães, Neves Junior, Silva, Rogers, Ball, Montes and Pereira2017). Layer-by-layer VESS analysis can help identify problems such as surface compaction or subsoil hardpans, which may not be apparent in a block analysis but are critical for root growth and water movement. For example, soil structure may appear healthy near the surface but may be significantly degraded in deeper layers or on different slopes due to factors such as excessive tillage or poor drainage, as we have seen in this study. This layered approach is particularly beneficial for assessing the impacts of management practices such as no-till farming, which often affects soil quality differently across various depths (Askari et al., Reference Askari, Cui and Holden2013).
In our study (Figure 5), we found that the structural quality of the soil, as measured by VESS, has an important influence on crop growth. While VESS values below the critical threshold of 3 (Sq = 3.0) are generally considered suitable for adequate root growth, we observed that the highest values exceeded this threshold in the middle slope positions, reaching up to Sq = 3.7. This suggests potential limitations in soil quality at these positions, which could hinder root development and crop productivity. As previous studies suggest (Franzluebbers et al., Reference Franzluebbers, Owens, Sigua, Cambardella, Haney, Liebig, Franzluebbers and Follett2012), maintaining soil structural quality through appropriate management is crucial for sustaining carbon stocks in pasture areas, similar to those found in native forests. Where carbon stocks are depleted, soil degradation can be indicated by distinct zones with markedly different structures, as noted by Guimarães et al. (Reference Guimarães, Ball and Tormena2011), Giarola et al. (Reference Giarola, da Silva, Tormena, Guimarães and Ball2013), and Munkholm and Holden (Reference Munkholm, Holden, Ball and Munkholm2015). As we can see in Figure 5, these differences in soil structure are visually apparent, highlighting the contrasting conditions between degraded areas and healthier soils (Figure S2).

Figure 5. Representative photographs and spatial variations of VESS scores across the 0–0.25 m layer at different slope positions (upper, middle, lower).
Practical implications
In this study, we found that both the SMAF and VESS produced comparable outcomes, reinforcing the reliability and effectiveness of these tools. Similar results have been documented in other studies conducted in Brazil (Guimarães et al., Reference Guimarães, Ball and Tormena2011; Giarola et al., Reference Giarola, da Silva, Tormena, Guimarães and Ball2013; Cherubin et al., Reference Cherubin, Karlen, Franco, Cerri, Tormena and Cerri2016b; Becker et al., Reference Becker, Giarola, Paula, Schiebelbein and Luz2024). In particular, VESS offers several practical advantages that make it an easy-to-handle tool for farmers, land managers, and researchers. One of its key benefits is that it provides a cost-effective and rapid means of assessing soil structural quality directly in the field, without requiring expensive laboratory equipment or extensive technical training. This makes VESS especially useful for monitoring soil health in resource-limited environments, including smallholder farms and developing regions, where soil degradation is often a major concern (Guimarães et al., Reference Guimarães, Neves Junior, Silva, Rogers, Ball, Montes and Pereira2017; Mora-Motta et al., 2024).
In addition, VESS enables critical soil problems such as compaction and poor aggregation to be identified, allowing for timely intervention and more informed management practices. This is particularly important in agriculture, where poor soil structure can negatively impact crop yields, water retention, and nutrient cycling (Emmet-Booth et al., Reference Emmet-Booth, Forristal, Fenton, Ball and Holden2016; Giarola et al., Reference Giarola, da Silva, Tormena, Guimarães and Ball2013). VESS is also useful for tracking the effects of different land management strategies, such as tillage, crop rotation, or pasture use. It provides a simple and intuitive way to compare soil health over time. Furthermore, the negative relationship observed between VESS scores and the SMAF physical sub-index (SHP) (Figure S3) indicates that soils with poorer physical health, characterised by higher bulk density, reduced porosity, and lower macroaggregation, also exhibit higher VESS scores. The visual symptoms of compaction and diminished aggregation, as assessed by VESS, correspond well with quantitative measurements, such as bulk density and water-filled pore space (Bronick & Lal, Reference Bronick and Lal2005; Six et al., Reference Six, Bossuyt, Degryze and Denef2004). This highlights the value of combining qualitative and quantitative methods when assessing soil structure and health.
However, VESS has its limitations, particularly in sandy soils or regions with complex soil profiles, where it may not capture all indicators of soil degradation. This highlights the need to complement VESS with additional soil quality indicators, such as biological and chemical assessments, to provide a more comprehensive evaluation of soil health (Cherubin et al., Reference Cherubin, Karlen, Franco, Cerri, Tormena and Cerri2016b; Becker et al., Reference Becker, Giarola, Paula, Schiebelbein and Luz2024). Proper training for personnel conducting VESS assessments is also essential to ensure accurate and consistent results across different locations and soil types.
Conclusions
The study effectively demonstrates the significant impact of soil texture, particularly clay content, on soil structural quality and health, as evaluated through both the VESS and the SMAF. The results highlight that higher clay content in the upper slope positions leads to better soil aggregation, lower bulk density, and higher water-filled pore space, all of which contribute to improved soil health. In contrast, lower clay content in the middle and lower slope positions results in poorer soil structure, as indicated by higher VESS scores, often exceeding the critical threshold for root growth (> Sq = 3).
In addition, VESS can be used to assess soil health, particularly in agricultural contexts where rapid, cost-effective assessments are required. SMAF and VESS methods proved useful in identifying the effects of management practices on soil health, with VESS offering a straightforward field-based assessment and SMAF providing a more comprehensive analytical framework.
In conclusion, the integration of tools such as VESS and SMAF is essential for the development of adaptive and sustainable soil management strategies, especially in the context of climate variability and changing agricultural demands. Our results confirm that VESS effectively captures variations in soil health related to environmental characteristics, which is consistent with SMAF results. Further long-term studies are recommended to investigate the effects of different management practices on soil health in different regions and soil types.
Supplementary material
The supplementary material for this article can be found at https://doi.org/10.1017/S0014479725100112
Acknowledgements
The authors thank the Center for Carbon Research in Tropical Agriculture/University of São Paulo (CCARBON/USP), supported by the São Paulo Research Foundation (FAPESP – process #2021/10573-4). They also thank the Coordination for the Improvement of Higher Education Personnel (CAPES) for the scholarships and the National Council for Scientific and Technological Development (CNPq) for supporting the research. M.R.C. thanks the CNPq for his Research Productivity Fellowship (311787/2021-5). B.E.S., V.S.S., and V.M. were funded by FAPESP (processes 2023/10897-0; 2024/08419-5 and #2022/16368-6; 2024/06095-8 and 2024/02508-6). They want to thank FESCON-UEPG (Fazenda Escola Capão da Onça - Universidade Estadual de Ponta Grossa) for their total technical support in conducting the experiment.
Competing interests
The authors declare no competing interests. There are no financial or personal relationships that could have influenced the work reported in this paper.


 Open access