


Impact Statement
Ophthalmic surgeries such as pars plana vitrectomy require constant infusion within the eye to maintain intraocular pressure and volume. Visibility is a crucial issue when performing surgery, particularly for staining procedures. In this context, the peeling of tissues at the internal walls of the vitreous chamber relies on injected dyes deposited on the macula, then aspirated before peeling. Employing minimally invasive surgery tools induces high velocities, generating intense fluid dynamic phenomena that may interfere with the surgical procedure and induce excessive forces on the retina. We quantify these effects revealing different flow regimes, depending on the Reynolds number, with different wall stresses and mixing intensities. The present results provide insight into the understanding of and possible improvements to surgical procedures.
1. Introduction
Pars plana vitrectomy is an ophthalmic surgical procedure employed to access the posterior part of the eye (figure 1 a) and treat various retinal and vitreous disorders such as retinal detachments (Ando et al. Reference Ando, Miyake, Oshima and Yamanaka1986; Bonnet et al. Reference Bonnet, Santamaria and Mouche1987), vitreous haemorrhage (Bahar et al. Reference Bahar, Axer-Siegel and Weinberger2006), endophthalmitis (Peyman et al. Reference Peyman, Raichand and Bennett1980), macular holes (Theocharis et al. Reference Theocharis, Alexandridou, Gili and Tomic2005), as well as complications from diabetic retinopathy (Berrocal & Acaba-Berrocal Reference Berrocal and Acaba-Berrocal2021). It consists in the removal of a gel-like substance that fills the eye behind the crystalline lens, the vitreous humor, and its replacement with a fluid substitute (Romano et al. Reference Romano, Ferrara, Nepita, Tothova, Giacometti Schieroni, Reami, Mendichi, Liggieri and Repetto2021). The standard three-port vitrectomy is a minimally invasive procedure, i.e. a surgery that limits the size of incisions needed. The set-up consists of three trocars inserted by a specific knife into the sclera, in the pars plana region. Trocars enable access within the vitreous chamber to the infusion cannula, the aspiration cannula and the endo-illumination light source (Fujii et al. Reference Fujii, De Juan, Humayun, Pieramici, Chang, Ng, Barnes, Wu, Sommerville, Surgical and St. Louis2002).

Figure 1. (a) Sketch of the eye with relevant layers. Anonymised photos of (b) triamcinolone crystals and (c) brilliant blue G dye during surgery, and (d) a sketch of the injected dye and the aspiration. The infusion cannula is not visible in the photos and comes from the top-right (i.e. inferotemporal quadrant in surgical view). (e) Sketch of the vitreous chamber with relevant dimensions from different perspectives, and indication of the inlet and outlet.
In the first phase, the vitreous humor is removed and, in the most common situation, balanced salt solution (BSS) is continuously supplied from the infusion cannula to maintain intraocular pressure and volume (Kim et al. Reference Kim, Park and Choi2015). After removal, more refined procedures imply the use of vital dyes, such as triamcinolone acetonide, a steroid injected in the form of small white crystals, that aid in the visualisation of ophthalmic structures such as residuals of vitreous cortex and internal limiting membrane (Couch & Bakri Reference Couch and Bakri2008). These particles are transported due to the continuous infusion of BSS and enable the identification of vitreous remnants where they remain caught (see figure 1 b). Surgery may also involve the peeling of translucent membranes adherent to the retinal tissue (macular pucker or epiretinal membranes, Rossi et al. Reference Rossi, Querzoli, Cosimi, Ripandelli, Placentino, Steel and Romano2024) or the creation of internal limiting membrane flaps and grafts to favour macular hole closure (Romano et al. Reference Romano, Rossi, Borgia, Catania, Sorrentino and Ferrara2022; Rossi et al. Reference Rossi, Trillo and Ripandelli2021 b). These delicate surgical manoeuvres require perfect visualisation of virtually transparent membranes as thin as 7–10 μm that require vital dyes to be detected and manipulated (Bracha et al. Reference Bracha, Ciulla and Baumal2018) (see figure 1 c). Dyes employed to stain the epiretinal membranes and internal limiting membrane include brilliant blue (Maia et al. Reference Maia, Farah, Rodrigues and Malerbi2009; Rossi et al. Reference Rossi, Trillo and Ripandelli2021 b), indocyanine green (Rizzo et al. Reference Rizzo, Belting, Genovesi-Ebert, Vento and Cresti2006) and trypan blue (Vote et al. Reference Vote, Russell and Joondeph2004), dispersed in dextran or heavy water to improve sinking. However, these dyes must be carefully managed to prevent unnecessary dispersion that may interfere with visibility within the vitreous chamber or prolong contact with retinal tissues, causing unnecessary dispersion and related toxicity (Farah et al. Reference Farah, Maia and Rodrigues2009). A dye injection within the eye filled with BSS, preliminary to the peeling procedure, is sketched in figure 1(d). After a staining period, the dye is subsequently irrigated and aspirated. The unintended blowing of the infusion cannula on the vital dye laying onto the retinal surface may compromise visibility and disperse it throughout the vitreous chamber (Rodrigues et al. Reference Rodrigues, Costa, Penha, Melo, Bottós, Dib, Furlani, Lima, Maia, Meyer, Höfling-Lima and Farah2009). This undesirable mixing can also jeopardise the stain removal process and potentially cause unwanted dispersion onto unwanted areas such as the subretinal space (Maia et al. Reference Maia, Kellner, De Juan, Smith, Farah, Margalit, Lakhanpal, Grebe, Au Eong and Humayun2004).
The interaction between the jet of BSS and the retinal surface gives rise to the formation of a stagnation region at the point of impingement, around which the fluid spreads radially and tangentially to the surface. Concurrently, a vortex ring develops, grows and possibly becomes unstable, thus generating small-scale structures. For Reynolds numbers of Re = U
m
d/
 $\nu$
< 1000 (based on the mean inlet velocity U
m
, the infusion cannula inner diameter d and fluid kinematic viscosity
$\nu$
< 1000 (based on the mean inlet velocity U
m
, the infusion cannula inner diameter d and fluid kinematic viscosity
 $\nu$
), typical of the infusion flow rates used during surgery, the jet is laminar and thus it travels the entire diameter of the vitreous chamber with limited mixing with the surrounding fluid. Only for Re > 700–1000, small-amplitude unsteady structures emerge in experimental and numerical studies (Gohil et al. Reference Gohil, Saha and Muralidhar2012; Koller-Milojevie & Schneider Reference Koller-Milojevie and Schneider1993; O’Neill et al. Reference O’Neill, Soria and Honnery2004). Therefore, though the transitional flow of impinging jets depends on various factors, such as inlet-to-surface distance and the level of lateral confinement (Ashforth-Frost & Jambunathan Reference Ashforth-Frost and Jambunathan1996; Wang et al. Reference Wang, Niu, Yuan, Zheng and Tan2015), the infusion fluid reaches the opposite retinal surface with an organised, high-velocity flow, potentially leading to significant normal and tangential wall stresses. Jet confinement also induces the formation of large recirculation zones and may thus increase mixing via flow instabilities in the surrounding domain (Wang et al. Reference Wang, Niu, Yuan, Zheng and Tan2015). The role of fluid dynamics within the vitreous chamber during and after vitrectomy is attracting growing interest (Rossi et al. Reference Rossi, Querzoli, Angelini, Rossi, Malvasi, Landi, Telani and Ripandelli2019, Reference Rossi, Querzoli, Angelini, Malvasi, Iossa, Placentino and Ripandelli2014; Yang et al. Reference Yang, Mcdonald, Everett, Johnson, Jumper and Fu2006). Concerning postoperative conditions related to tamponades, analyses have focused on steady equilibrium in realistic geometries (Isakova et al. Reference Isakova, Pralits, Romano, Beenakker, Shamonin and Repetto2017; Rossi et al. Reference Rossi, Querzoli, Badas, Angius and Ripandelli2022), shear stresses acting on the retina (Angunawela et al. Reference Angunawela, Azarbadegan, Aylward and Eames2011; Rossi et al. Reference Rossi, Querzoli, Badas, Angius, Telani and Ripandelli2021
a, Reference Rossi, Badas, Angius and Querzoli2023) and the related possible emergence of diseases (Ledda et al. Reference Ledda, Rossi, Badas and Querzoli2024), as well as emulsification of silicone oil tamponade due to everyday movements (De Silva, Reference De Silva2005; Wang et al. Reference Wang, Snead, Alexander and Ian Wilson2021). The potential impact of fluid dynamics during surgery and, specifically, dye removal calls for a better understanding of the phenomenon. In addition, hydrodynamic forces acting on the walls may attain values high enough to damage the retina (Bilgin et al. Reference Bilgin, Türkoğlu, İlhan, Ünal and Apaydın2015; Kim et al. Reference Kim, Jo, Moon, Joo and Choi2014). This issue becomes increasingly significant when considering the historical progression of minimally invasive techniques, which have progressively employed smaller diameters and increasingly higher inlet velocities for injection cannulas, from 23 to 25 gauge (Fujii et al. Reference Fujii, De Juan and Humayun2003; Lesnoni et al. Reference Lesnoni, Rossi and Gelso2004) and even 27 gauge (Oshima et al. Reference Oshima, Wakabayashi, Sato, Ohji and Tano2010). Accordingly, numerical studies observed a substantial increase in forces acting on the retina when decreasing the needle diameter (Rickels et al. Reference Rickels, Gunderman, McLellan, Shamim, Sanford and Uwaydat2024). High-velocity infusion jet flows can create retinal breaks that can evolve into retinal detachments (Bilgin et al. Reference Bilgin, Türkoğlu, İlhan, Ünal and Apaydın2015), as well as macular holes (Ruiz Del Rio et al. Reference Ruiz Del Rio, Garcí Ibor, Hernandez Perez and Duch Samper2023), thus requiring additional treatments (Rishi et al. Reference Rishi, Rishi, Sharma and Ck2018). These breaks can also cause vision loss if they develop in the macula (Belenje et al. Reference Belenje, Takkar, Agarwal, Tyagi, Aggarwal, Padhi and Narayanan2022). To provide a point of comparison, in normal conditions, capillary pressure in the retina is about 3–5 mmHg higher than the intraocular pressure: potentially, if the stresses exceed this threshold, retinal capillaries could collapse, with associated damage (Kim et al. Reference Kim, Jo, Moon, Joo and Choi2014; Takahashi et al. Reference Takahashi, Nagaoka, Yanagida, Saitoh, Kamiya, Hein, Kuo and Yoshida2009). However, despite surgical evidence and the argument presented above, no explicit clinical thresholds have been identified, yet. Within this perspective, numerical estimates of the forces generated by an infusion jet are demanded to serve as a reference for future experimental and biological studies aimed at establishing damage thresholds.
$\nu$
), typical of the infusion flow rates used during surgery, the jet is laminar and thus it travels the entire diameter of the vitreous chamber with limited mixing with the surrounding fluid. Only for Re > 700–1000, small-amplitude unsteady structures emerge in experimental and numerical studies (Gohil et al. Reference Gohil, Saha and Muralidhar2012; Koller-Milojevie & Schneider Reference Koller-Milojevie and Schneider1993; O’Neill et al. Reference O’Neill, Soria and Honnery2004). Therefore, though the transitional flow of impinging jets depends on various factors, such as inlet-to-surface distance and the level of lateral confinement (Ashforth-Frost & Jambunathan Reference Ashforth-Frost and Jambunathan1996; Wang et al. Reference Wang, Niu, Yuan, Zheng and Tan2015), the infusion fluid reaches the opposite retinal surface with an organised, high-velocity flow, potentially leading to significant normal and tangential wall stresses. Jet confinement also induces the formation of large recirculation zones and may thus increase mixing via flow instabilities in the surrounding domain (Wang et al. Reference Wang, Niu, Yuan, Zheng and Tan2015). The role of fluid dynamics within the vitreous chamber during and after vitrectomy is attracting growing interest (Rossi et al. Reference Rossi, Querzoli, Angelini, Rossi, Malvasi, Landi, Telani and Ripandelli2019, Reference Rossi, Querzoli, Angelini, Malvasi, Iossa, Placentino and Ripandelli2014; Yang et al. Reference Yang, Mcdonald, Everett, Johnson, Jumper and Fu2006). Concerning postoperative conditions related to tamponades, analyses have focused on steady equilibrium in realistic geometries (Isakova et al. Reference Isakova, Pralits, Romano, Beenakker, Shamonin and Repetto2017; Rossi et al. Reference Rossi, Querzoli, Badas, Angius and Ripandelli2022), shear stresses acting on the retina (Angunawela et al. Reference Angunawela, Azarbadegan, Aylward and Eames2011; Rossi et al. Reference Rossi, Querzoli, Badas, Angius, Telani and Ripandelli2021
a, Reference Rossi, Badas, Angius and Querzoli2023) and the related possible emergence of diseases (Ledda et al. Reference Ledda, Rossi, Badas and Querzoli2024), as well as emulsification of silicone oil tamponade due to everyday movements (De Silva, Reference De Silva2005; Wang et al. Reference Wang, Snead, Alexander and Ian Wilson2021). The potential impact of fluid dynamics during surgery and, specifically, dye removal calls for a better understanding of the phenomenon. In addition, hydrodynamic forces acting on the walls may attain values high enough to damage the retina (Bilgin et al. Reference Bilgin, Türkoğlu, İlhan, Ünal and Apaydın2015; Kim et al. Reference Kim, Jo, Moon, Joo and Choi2014). This issue becomes increasingly significant when considering the historical progression of minimally invasive techniques, which have progressively employed smaller diameters and increasingly higher inlet velocities for injection cannulas, from 23 to 25 gauge (Fujii et al. Reference Fujii, De Juan and Humayun2003; Lesnoni et al. Reference Lesnoni, Rossi and Gelso2004) and even 27 gauge (Oshima et al. Reference Oshima, Wakabayashi, Sato, Ohji and Tano2010). Accordingly, numerical studies observed a substantial increase in forces acting on the retina when decreasing the needle diameter (Rickels et al. Reference Rickels, Gunderman, McLellan, Shamim, Sanford and Uwaydat2024). High-velocity infusion jet flows can create retinal breaks that can evolve into retinal detachments (Bilgin et al. Reference Bilgin, Türkoğlu, İlhan, Ünal and Apaydın2015), as well as macular holes (Ruiz Del Rio et al. Reference Ruiz Del Rio, Garcí Ibor, Hernandez Perez and Duch Samper2023), thus requiring additional treatments (Rishi et al. Reference Rishi, Rishi, Sharma and Ck2018). These breaks can also cause vision loss if they develop in the macula (Belenje et al. Reference Belenje, Takkar, Agarwal, Tyagi, Aggarwal, Padhi and Narayanan2022). To provide a point of comparison, in normal conditions, capillary pressure in the retina is about 3–5 mmHg higher than the intraocular pressure: potentially, if the stresses exceed this threshold, retinal capillaries could collapse, with associated damage (Kim et al. Reference Kim, Jo, Moon, Joo and Choi2014; Takahashi et al. Reference Takahashi, Nagaoka, Yanagida, Saitoh, Kamiya, Hein, Kuo and Yoshida2009). However, despite surgical evidence and the argument presented above, no explicit clinical thresholds have been identified, yet. Within this perspective, numerical estimates of the forces generated by an infusion jet are demanded to serve as a reference for future experimental and biological studies aimed at establishing damage thresholds.
The primary objective of this study is to conduct a numerical analysis of the fluid dynamics arising from a constant infusion, with a specific emphasis on two critical surgical considerations. First, we investigate the pressure and shear stress distributions induced by the infusion jet on the retinal surface in the vicinity of the impingement point. Second, we examine the transport and mixing phenomena, and more broadly, the fluid motion generated by the infusion. This fluid motion can hinder surgical procedures by dispersing dyes or tracers, thus complicating their removal and/or reducing visibility. Furthermore, the induced motion can interfere with surgical manoeuvres.
To this aim, we consider the incompressible flow of BSS and quantify the hydrodynamic forces as well as the Lagrangian coherent structures (LCS) and mixing indices based on finite time Lyapunov exponent (FTLE) and other kinematics properties. Our goal is to provide useful insights for a more informed control of infusion during surgery. We consider an intermediate, the most widely used, calibre of the infusion cannula (25 gauge = 0.5 mm outer diameter) and vary the flow rate within the typical range employed by surgeons. The paper is organised as follows. Section 2 presents the governing equations and the numerical approach. Section 3 describes the flow structures that develop in the vitreous chamber. Section 4 focuses on the hydrodynamic forces acting on the retina due to infusion. Finally, § 5 studies in detail transport and mixing during the infusion.
2. Problem formulation, numerical approach
We consider the single-phase incompressible flow in the vitreous chamber of BSS, modelled as a viscous fluid of viscosity
 $\mu$
= 10–3 Pa s and density
$\mu$
= 10–3 Pa s and density
 $\rho$
= 997 kg m−3. The flow configuration is shown in figure 1(e). The vitreous chamber reproduces a typical eye geometry (Rossi et al. Reference Rossi, Querzoli, Badas, Angius, Telani and Ripandelli2021
a) and is composed of a sphere of diameter D = 24 mm, with a convex section mimicking the lens, in the anterior part. The infusion cannula and the vitrector (outlet), 25-gauge in calibre, are represented by two circular cylinders of external and internal diameters d
e
= 0.5 mm and d = 0.4 mm, respectively. Their position has been chosen by following the advice of the medical expert included in the research team, according to universally adopted surgical practice. As a matter of fact, the pars plana, a 360° belt-like region, a few millimetres wide, between the highly vascularised ciliary body (extremely hazardous to penetrate) and the retina (figure 1
a), is the only surgically safe point of access to the vitreous chamber. Also the orientation of the cannula is chosen according to the usual surgical procedure: infusion cannulas must be inserted perpendicularly to avoid misdirecting the infusion stream, which could harm the lens or cause fluid to enter the suprachoroidal space, potentially resulting in choroidal detachment and haemorrhage (Machemer, Reference Machemer1995; Machemer et al. Reference Machemer, Buettner, Norton and Parel1971). Finally, we focus on a scenario where the vitreous has been completely removed, consistent with standard intraoperative conditions. The fluid obeys the incompressible Navier–Stokes equations and is assumed to be Newtonian (Arshinoff & Khoury Reference Arshinoff and Khoury1997). At the inlet, a parabolic velocity profile with a prescribed flow rate is imposed, thus resembling the result of a laminar, developed flow within the infusion circuit, whose flow rate thus reads Q = U
m
$\rho$
= 997 kg m−3. The flow configuration is shown in figure 1(e). The vitreous chamber reproduces a typical eye geometry (Rossi et al. Reference Rossi, Querzoli, Badas, Angius, Telani and Ripandelli2021
a) and is composed of a sphere of diameter D = 24 mm, with a convex section mimicking the lens, in the anterior part. The infusion cannula and the vitrector (outlet), 25-gauge in calibre, are represented by two circular cylinders of external and internal diameters d
e
= 0.5 mm and d = 0.4 mm, respectively. Their position has been chosen by following the advice of the medical expert included in the research team, according to universally adopted surgical practice. As a matter of fact, the pars plana, a 360° belt-like region, a few millimetres wide, between the highly vascularised ciliary body (extremely hazardous to penetrate) and the retina (figure 1
a), is the only surgically safe point of access to the vitreous chamber. Also the orientation of the cannula is chosen according to the usual surgical procedure: infusion cannulas must be inserted perpendicularly to avoid misdirecting the infusion stream, which could harm the lens or cause fluid to enter the suprachoroidal space, potentially resulting in choroidal detachment and haemorrhage (Machemer, Reference Machemer1995; Machemer et al. Reference Machemer, Buettner, Norton and Parel1971). Finally, we focus on a scenario where the vitreous has been completely removed, consistent with standard intraoperative conditions. The fluid obeys the incompressible Navier–Stokes equations and is assumed to be Newtonian (Arshinoff & Khoury Reference Arshinoff and Khoury1997). At the inlet, a parabolic velocity profile with a prescribed flow rate is imposed, thus resembling the result of a laminar, developed flow within the infusion circuit, whose flow rate thus reads Q = U
m
 $\pi$
d
2/4. We consider several flow rates according to table 1, in the range 7.5 ml min−1< Q < 20 ml min−1, typically employed during surgery, while at the outlet, we impose zero pressure. The flow rate is assumed to be constant during the simulation, as happens when infusion is enabled, and aspiration is on.
$\pi$
d
2/4. We consider several flow rates according to table 1, in the range 7.5 ml min−1< Q < 20 ml min−1, typically employed during surgery, while at the outlet, we impose zero pressure. The flow rate is assumed to be constant during the simulation, as happens when infusion is enabled, and aspiration is on.
Table 1. Different inlet-flow-rate conditions considered in this work

Time is normalised as
 $t=\hat{t}/\tau$
,
$t=\hat{t}/\tau$
,
 $\hat{t}$
being the dimensional time, and
$\hat{t}$
being the dimensional time, and
 $\tau$
= D/U
m
the advective time scale. In all runs, the simulation is stopped at t = 1000. In dimensional units, this corresponds to about 25 and 10 s for the lowest and highest flow rate, respectively. With these assumptions, the Reynolds number referred to the mean velocity and the inlet diameter lies in the range 399 < Re
d
< 1059. The flow rate, mean inlet velocity U
m
and Reynolds number Re of the investigated cases (labelled with uppercase letters from A to G) are reported in table 1. The ratio of the characteristic diameter of the vitreous chamber to the inlet internal one is fixed and equal to 60, while the ratio of the distance from the inlet to the wall (denoted as L
J
) to the inlet diameter is L
J
/d ≈ 50. The problem is closed by the outlet condition and the no-slip condition on the remaining walls. In the following, all quantities are non-dimensionalised by the inlet average velocity and the vitreous chamber diameter,
$\tau$
= D/U
m
the advective time scale. In all runs, the simulation is stopped at t = 1000. In dimensional units, this corresponds to about 25 and 10 s for the lowest and highest flow rate, respectively. With these assumptions, the Reynolds number referred to the mean velocity and the inlet diameter lies in the range 399 < Re
d
< 1059. The flow rate, mean inlet velocity U
m
and Reynolds number Re of the investigated cases (labelled with uppercase letters from A to G) are reported in table 1. The ratio of the characteristic diameter of the vitreous chamber to the inlet internal one is fixed and equal to 60, while the ratio of the distance from the inlet to the wall (denoted as L
J
) to the inlet diameter is L
J
/d ≈ 50. The problem is closed by the outlet condition and the no-slip condition on the remaining walls. In the following, all quantities are non-dimensionalised by the inlet average velocity and the vitreous chamber diameter,
 $\boldsymbol{x}=\hat{\boldsymbol{x}}/D$
,
$\boldsymbol{x}=\hat{\boldsymbol{x}}/D$
,
 $\boldsymbol{u}=\hat{\boldsymbol{u}}/U_{m}$
and
$\boldsymbol{u}=\hat{\boldsymbol{u}}/U_{m}$
and
 $p=\hat{p}/\rho U_{m}^{2}$
. The numerical simulation is performed through the built-in solver pisoFoam, within the OpenFOAM® open-source environment. The discretisation is chosen after a convergence analysis, reported in Appendix A with details on mesh generation, numerical solvers and tolerances as well as a comparison with the ideal scaling for an unconfined jet.
$p=\hat{p}/\rho U_{m}^{2}$
. The numerical simulation is performed through the built-in solver pisoFoam, within the OpenFOAM® open-source environment. The discretisation is chosen after a convergence analysis, reported in Appendix A with details on mesh generation, numerical solvers and tolerances as well as a comparison with the ideal scaling for an unconfined jet.
3. General flow structure and vortex dynamics
We preliminarily characterise the velocity field and vortical structures that emerge during the infusion. Figure 2(a–c) shows the early evolution of the flow through isosurfaces of the normal-to-the-inlet velocity, for the lowest flow rate (case A in table 1). At the onset of the infusion, the jet propagates towards the retinal wall on the opposite side (figure 2 a,b). The advancing front of the jet is characterised by an annular isosurface of relatively low normal velocity. After reaching the retinal wall (figure 2 c), the annular region sweeps along the wall and progressively invades regions farther from the impact zone. Due to the orientation of the cannula, the impingement occurs in the immediate post-equatorial retina. Figure 2(d) shows the axial velocity as a function of the distance from the outlet at increasing times. After the jet reaches the wall, all profiles collapse, and, close to the impact zone, the velocity decreases at about one-fourth of its initial value. The expansion of the low-normal-velocity isosurface suggests the development of a toroidal vortex that progressively enlarges. In figure 2(e–h), we consider the plane z = 0, which cuts both the inlet and outlet. Figure 2(e) confirms the formation of a vortex ring that enlarges with time and loses symmetry about the y axis (figure 2 f–h), being attracted towards the vitrector (outlet). No other vortical structures of appreciable velocity are observed in the case under consideration.

Figure 2. Early development and impact of the inlet jet, for the lowest-velocity-case (A). (a−c) Selected isosurfaces of the normal velocity at three different times, depicting the propagation and impact of the inlet jet. (d) Velocity magnitude along the jet axis as a function of the normalised distance from the exit nozzle to the retinal surface s, at different times according to the colourbar. (e−h) Section at z = 0 that contains the inlet jet axis: colourmaps of the velocity magnitude and streamlines of the velocity field in that section, at different times. The black dashed line in (d) is the Schlichting scaling for an unconfined jet (Schlichting & Gersten Reference Schlichting and Gersten2017).
The velocity decay with the distance from the inlet follows the case of an impinging jet on a flat wall (Wang et al. Reference Wang, Niu, Yuan, Zheng and Tan2015), with the presence of several regions, namely (i) a small potential core region, where velocity remains constant, (ii) an intermediate zone, (iii) a fully developed zone where the jet profile becomes self-similar and the maximum velocity decreases linearly and (iv) an impact region where the velocity quickly decreases to zero as the jet reaches the wall. The vortex ring grows rapidly within the vitreous chamber and, already at t ≈ 25 (in dimensional units, 0.6 s), has reached an almost constant size. Therefore, the presence of an annular vortex ring developing within the vitreous chamber during ophthalmic surgery is unavoidable, even in the lowest-velocity case. In addition, the vortex ring is slightly asymmetric because of the suction at the outlet and the geometry of the vitreous chamber. Figure 3 shows the evolution of the vortical structures within the vitreous chamber using the Q-criterion, i.e. showing selected positive isosurfaces of the second invariant of the tensor: 0.5
 $(\| \boldsymbol{\Omega}\|^{\textrm{2}}-\| \boldsymbol{S}\|^{\textrm{2}})$
, where
$(\| \boldsymbol{\Omega}\|^{\textrm{2}}-\| \boldsymbol{S}\|^{\textrm{2}})$
, where
 $\boldsymbol{\Omega}$
and
S
are the antisymmetric and symmetric parts of the velocity gradient. The surfaces are represented at four non-dimensional times and three flow rates, i.e. cases A (low flow rate), D (intermediate flow rate) and G (high flow rate). The first column shows the vortical structures just after the jet impingement. Comparing the different rows shows that an increase in the flow rate leads to a slight enlargement of the vortex ring. Several hairpin vortices develop in the inner region of the vortex ring and are ejected back towards the centre of the vitreous chamber. In cases D and G, the secondary vortices are greater in number and develop while unsteadily interacting with each other as time increases (second and third columns). Differently, in case A, the few hairpin vortices developed after the impingement tend to vanish. In the highest-velocity case (G, last row of figure 3), the initial vortex ring moves significantly towards the anterior part while smaller vortex rings appear in the posterior part, close to the retina. In addition, some isosurface modulations appear along the jet in the higher-velocity cases (D and G, second and third rows of figure 3). Previous numerical results showed that unperturbed jets that amplify only numerical noise show modulations of less than a few percent of the mean velocity up to Re ≈ 925 for a distance from the inlet of 10d (Gohil et al. Reference Gohil, Saha and Muralidhar2012). Similar small intermittent oscillations at a distance from the inlet of ≈14d were experimentally observed at Re ≈ 700 (Koller-Milojevie & Schneider Reference Koller-Milojevie and Schneider1993; O’Neill et al. Reference O’Neill, Soria and Honnery2004), with appreciable unsteadiness occurring from Re ≈ 1030 (O’Neill et al. Reference O’Neill, Soria and Honnery2004). Since our limiting case is Re = 1059, large jet oscillations are not observed, upstream of the impact region. However, non-negligible unsteadiness and enhanced mixing at the scale of the vitreous chamber emerge due to the proliferation and ejection of the hairpin vortices.
$\boldsymbol{\Omega}$
and
S
are the antisymmetric and symmetric parts of the velocity gradient. The surfaces are represented at four non-dimensional times and three flow rates, i.e. cases A (low flow rate), D (intermediate flow rate) and G (high flow rate). The first column shows the vortical structures just after the jet impingement. Comparing the different rows shows that an increase in the flow rate leads to a slight enlargement of the vortex ring. Several hairpin vortices develop in the inner region of the vortex ring and are ejected back towards the centre of the vitreous chamber. In cases D and G, the secondary vortices are greater in number and develop while unsteadily interacting with each other as time increases (second and third columns). Differently, in case A, the few hairpin vortices developed after the impingement tend to vanish. In the highest-velocity case (G, last row of figure 3), the initial vortex ring moves significantly towards the anterior part while smaller vortex rings appear in the posterior part, close to the retina. In addition, some isosurface modulations appear along the jet in the higher-velocity cases (D and G, second and third rows of figure 3). Previous numerical results showed that unperturbed jets that amplify only numerical noise show modulations of less than a few percent of the mean velocity up to Re ≈ 925 for a distance from the inlet of 10d (Gohil et al. Reference Gohil, Saha and Muralidhar2012). Similar small intermittent oscillations at a distance from the inlet of ≈14d were experimentally observed at Re ≈ 700 (Koller-Milojevie & Schneider Reference Koller-Milojevie and Schneider1993; O’Neill et al. Reference O’Neill, Soria and Honnery2004), with appreciable unsteadiness occurring from Re ≈ 1030 (O’Neill et al. Reference O’Neill, Soria and Honnery2004). Since our limiting case is Re = 1059, large jet oscillations are not observed, upstream of the impact region. However, non-negligible unsteadiness and enhanced mixing at the scale of the vitreous chamber emerge due to the proliferation and ejection of the hairpin vortices.
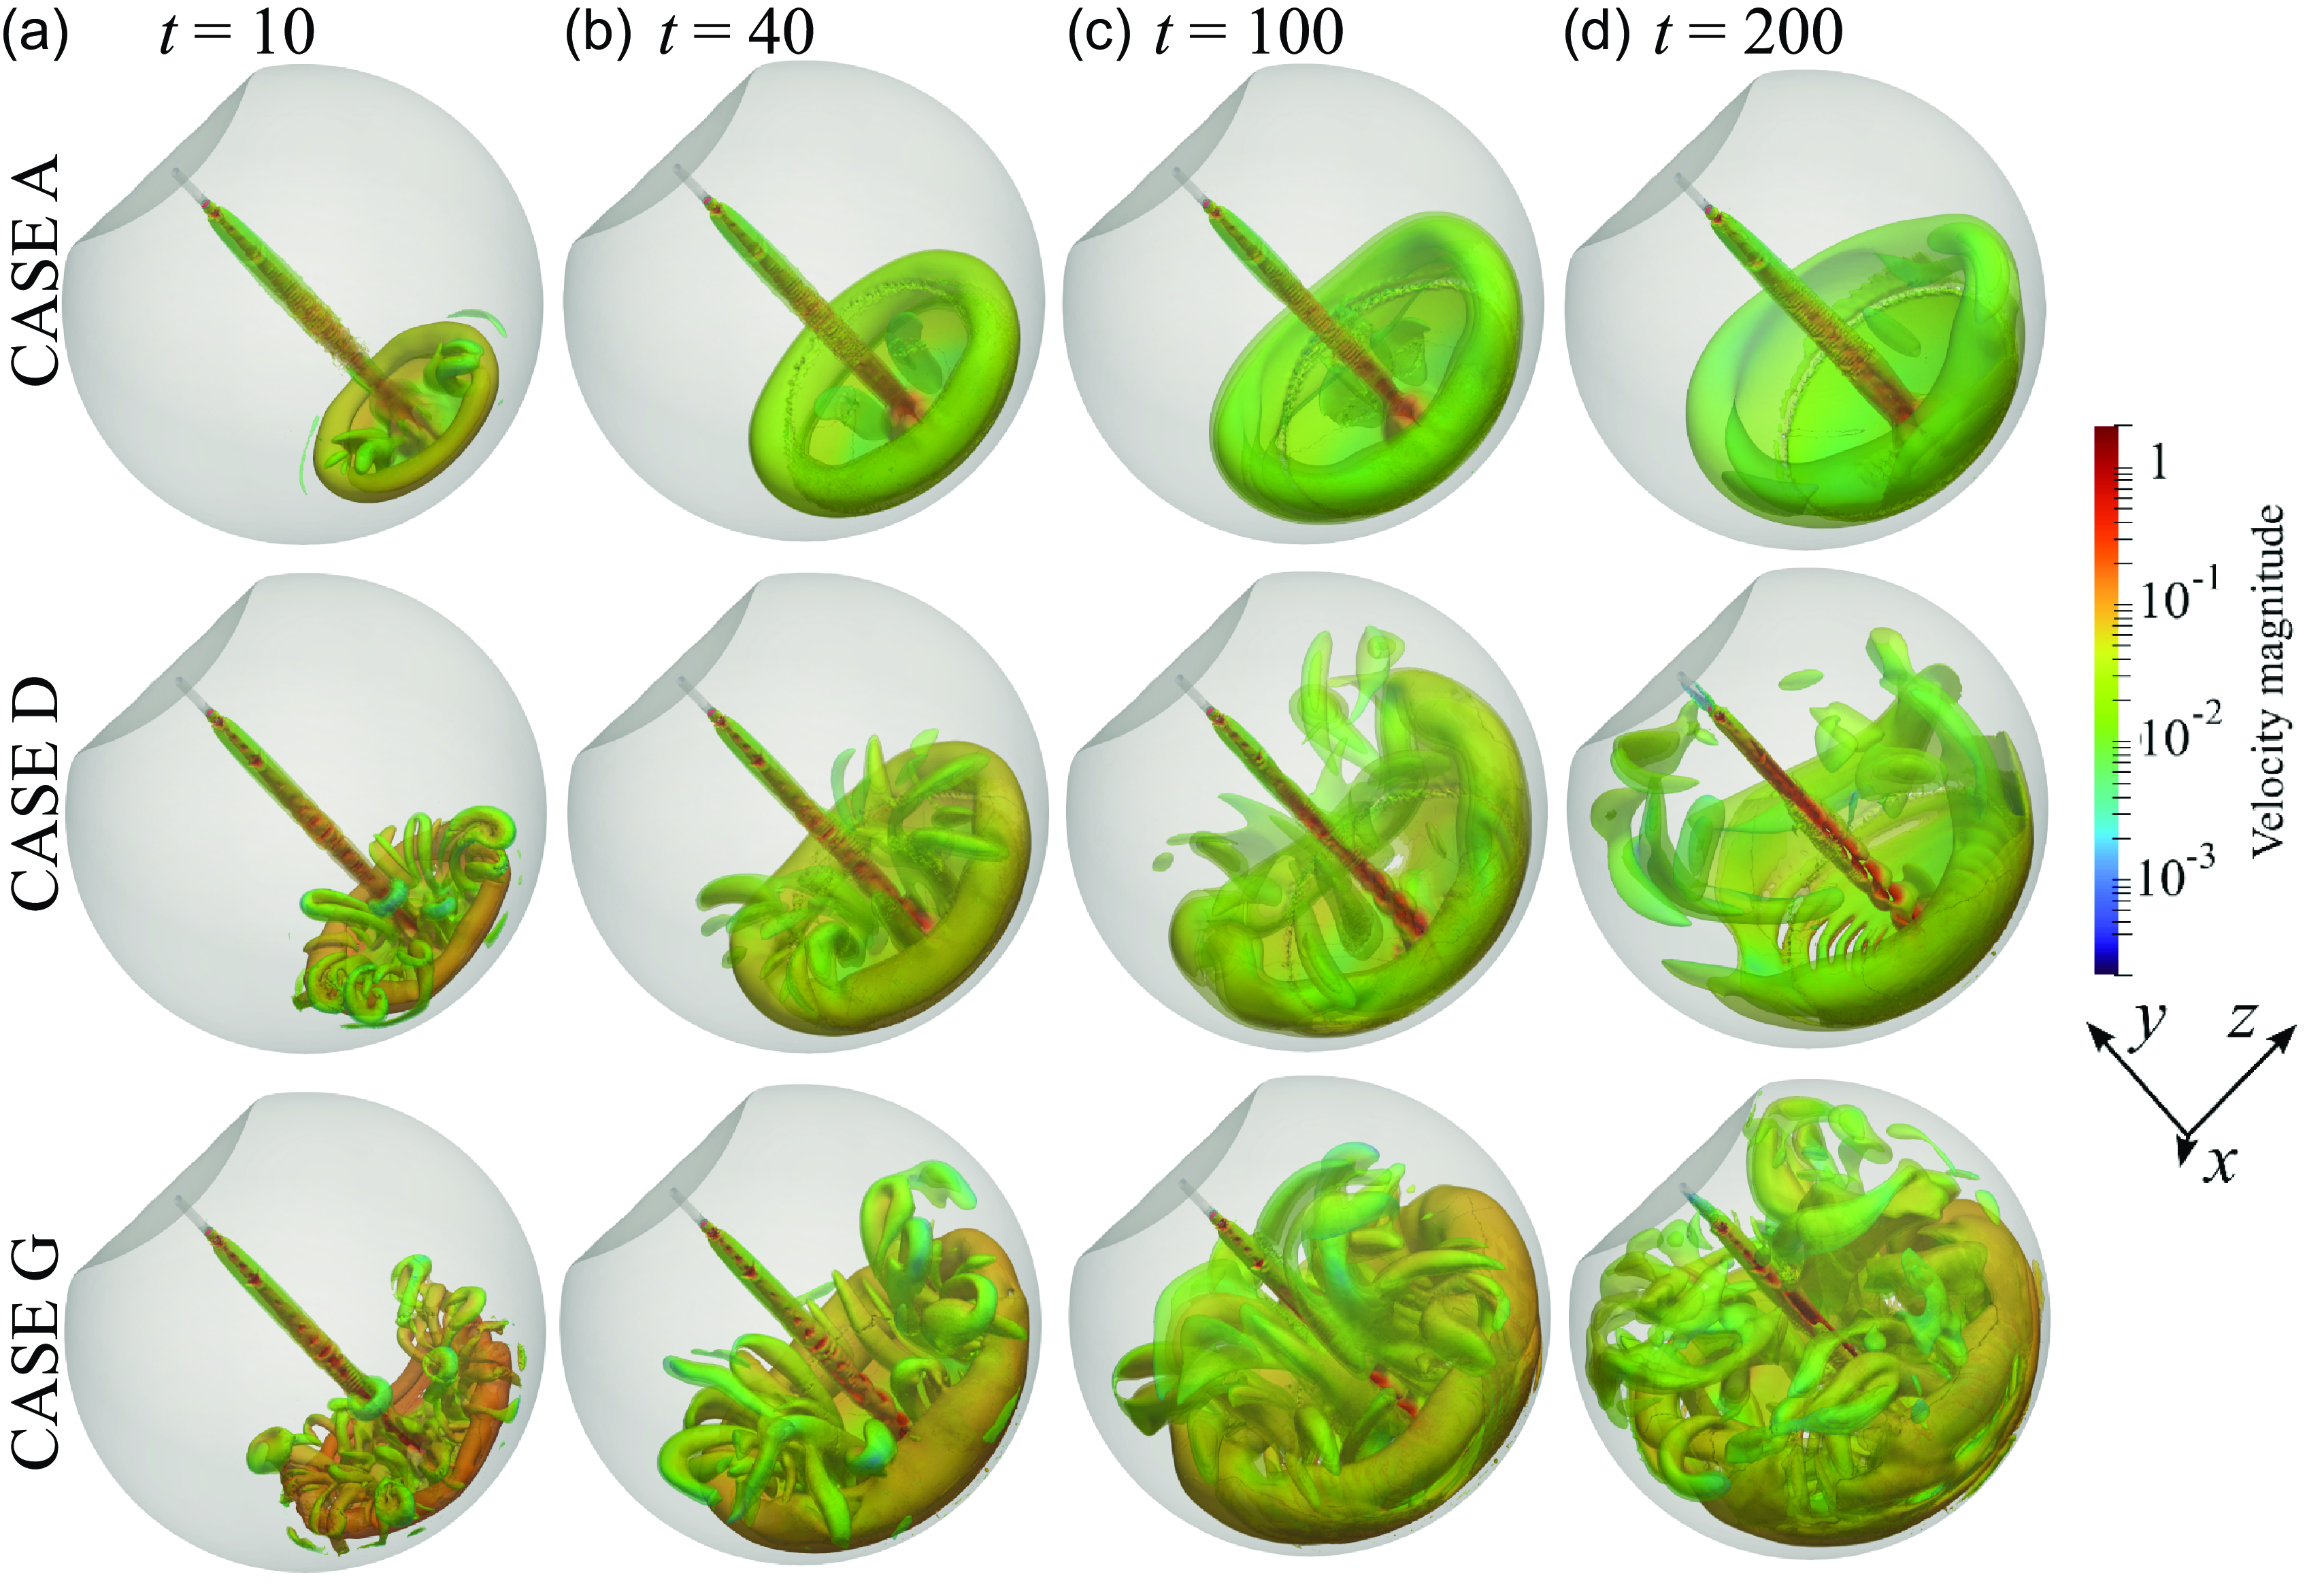
Figure 3. Selected isosurfaces of the Q-criterion coloured with the velocity magnitude. First row: case A (lowest flow rate); second row: case D (intermediate flow rate); third row: case G (highest flow rate). Each column presents the same non-dimensional time: (a) t = 10, (b) 40, (c) 100, (d) 200. The colourmap is logarithmic to appreciate the difference in velocity within the vortical structures.
The presence of a growing intricate distribution of vortices suggests enhanced mixing that involves a progressively larger portion of the vitreous chamber, as the inlet flow rate increases. Mixing in the posterior part appears to be hardly avoidable owing to the formation of a progressively larger annular vortex ring, irrespective of the inlet flow rate. The enhanced mixing and its propagation in a larger portion of the vitreous chamber promoted by the higher flow rates may cause a reduction of visibility and increased times for aspiration of injected substances during surgery. In addition, the impacting inlet jet may produce abnormal stress on the retina, which in turn may alter the physiological balance of these tissues and promote disease (Bilgin et al. Reference Bilgin, Türkoğlu, İlhan, Ünal and Apaydın2015). In the next section, we analyse the evolution with time of these forces acting on the retina.
4. Stresses acting on the retinal surface
Figure 4 shows the spatial distribution of pressure (relative to the value at the inlet centre) and wall shear stress (WSS) obtained through time averaging for 10 < t < 1000. The azimuth angle
 $\varphi$
is zero at the peak point and increases for positive x, following the spherical part of the vitreous chamber. Large stresses are localised close to the impact point, of much smaller size than the vortex ring. The non-dimensional peak pressure increases with the Reynolds number. The extent of the region of large stresses does not change appreciably with Re, corresponding to a dimensional characteristic radius
$\varphi$
is zero at the peak point and increases for positive x, following the spherical part of the vitreous chamber. Large stresses are localised close to the impact point, of much smaller size than the vortex ring. The non-dimensional peak pressure increases with the Reynolds number. The extent of the region of large stresses does not change appreciably with Re, corresponding to a dimensional characteristic radius
 $\hat{\delta }$
∼ 1 mm for both quantities. The observed spatial distributions on the surface are in good agreement with those observed for impinging jets in different conditions (Tu & Wood Reference Tu and Wood1996).
$\hat{\delta }$
∼ 1 mm for both quantities. The observed spatial distributions on the surface are in good agreement with those observed for impinging jets in different conditions (Tu & Wood Reference Tu and Wood1996).
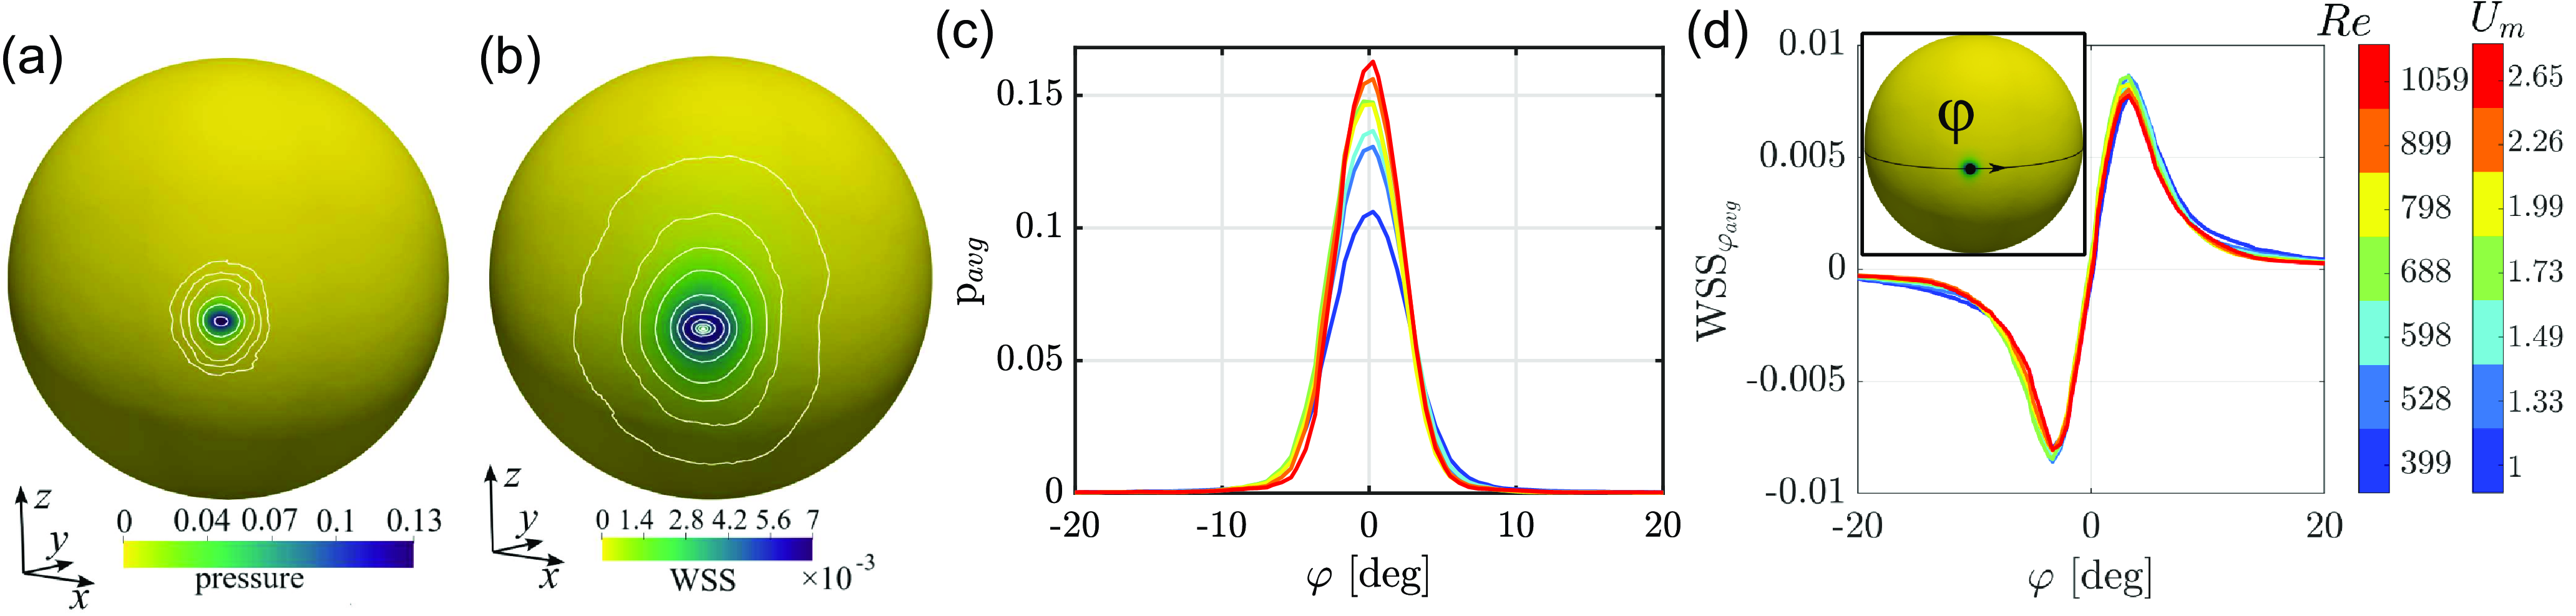
Figure 4. Colourmaps of (a) pressure and (b) magnitude of WSSs, time-averaged in the range 10 < t < 1000, for the highest-velocity case (G). Dimensional quantities can be retrieved by multiplying non-dimensional values by
 $\rho U_{m}^{2}$
≈ 7000 Pa = 52.5 mmHg. Distributions of (c) pressure and (d) tangential WSS along a line at z = 0 centred on the impact region. The angle
$\rho U_{m}^{2}$
≈ 7000 Pa = 52.5 mmHg. Distributions of (c) pressure and (d) tangential WSS along a line at z = 0 centred on the impact region. The angle
 $\phi$
is defined as the azimuth, measured from the centre of the spherical retinal surface as indicated in the insert of (d). Dimensional quantities can be retrieved by multiplying non-dimensional values by
$\phi$
is defined as the azimuth, measured from the centre of the spherical retinal surface as indicated in the insert of (d). Dimensional quantities can be retrieved by multiplying non-dimensional values by
 $\rho U_{m}^{2}$
, with
$\rho U_{m}^{2}$
, with
 $\rho$
= 997 kg m−3 and U
m
indicated by the colourbar.
$\rho$
= 997 kg m−3 and U
m
indicated by the colourbar.
We now focus on the evolution of the maximum stresses measured at the impact point, shown in figure 5. Irrespective of the case, a saturated state characterised by oscillations with time is quickly reached. As inferred qualitatively from the previous plot, pressure increases with the Reynolds number with increasing time oscillations for Re > 800 (i.e. Q > 15 ml min−1), a trend resembling that of WSS. These considerations are translated into synthetic quantities (average and standard deviation) in figure 5(c,d). The dependence on Re of pressure can be attributed to the non-negligible viscous effects at the lower Reynolds numbers considered in this work, which well follows the scaling p ∼ |u|1/2 ∼ Re 1/2, obtained by balancing the orders of magnitude of pressure and momentum flux and exploiting the expression of the Schlichting jet velocity (valid under laminar, steady, flow conditions for an unconfined jet; Schlichting & Gersten Reference Schlichting and Gersten2017). The standard deviation reaches progressively larger values, of the order of 8 % for the highest-velocity case.

Figure 5. (a,b) Maximum values of pressure and magnitude of WSS within the domain as functions of time. (c,d) Average in time of the pressure and WSS maximum values as functions of the Reynolds number. The total error bar length corresponds to two standard deviations. The red dashed line in (c) denotes the scaling p ∼ Re
1/2. Dimensional quantities can be retrieved by multiplying non-dimensional values by
 $\rho U_{m}^{2}$
, with
$\rho U_{m}^{2}$
, with
 $\rho$
= 997 kg m−3 and U
m
according to the colourbar.
$\rho$
= 997 kg m−3 and U
m
according to the colourbar.
In summary, WSSs, in dimensional form, reach values of ≈50 Pa. The dimensional peak pressure reaches a value of approximately 1200 Pa. The highest flow rate gives a dimensional peak pressure about ten times larger than the value reached by the lowest flow rate. Compared with physiological conditions, the value of WSS ∼ 50 Pa is about ten times the magnitude of WSS on the retina during saccadic eye rotation (Meskauskas et al. Reference Meskauskas, Repetto and Siggers2012). Peak pressure (∼9 mmHg) is of the same order as intraocular pressure (∼16 mmHg) and comparable to increases typical in ocular hypertension. Above 15 ml min−1, peak pressure also exceeds the reference value of capillary pressure within the retina, which is 3–5 mmHg higher than the intraocular pressure: potentially, these large stresses may damage retinal tissues, in the case of a prolonged jet impact on the wall, due to the collapse of capillaries (Kim et al. Reference Kim, Jo, Moon, Joo and Choi2014; Takahashi et al. Reference Takahashi, Nagaoka, Yanagida, Saitoh, Kamiya, Hein, Kuo and Yoshida2009). These considerations have to be balanced with other surgical requirements, such as mixing and surgery times, intrinsically related to mixing and transport within the vitreous chamber. The next section is devoted to the understanding of transport and mixing during surgery and their impact on the overall process.
5. Mixing and transport within the vitreous chamber through FTLEs
Transport and mixing are related to fluid motion and the associated vortical structures. As shown above, the most relevant vortical structures are characterised by a velocity magnitude of about u = 0.01, as indicated by the colourmaps in figure 3. Figure 6 shows the isolines of u = 0.01 for the lowest (figure 6 a) and highest (figure 6 b) flow-rate cases, on the symmetry plane z = 0. The isolines qualitatively resemble the boundary of the regions enclosing the vortex ring (figure 3). As time increases, the region enclosed by the isolines expands from the impact region towards the anterior part of the vitreous chamber. While with low inlet velocity in figure 6(a) depicts a progressive, ordered, growth of the vortex ring in an almost quiescent surrounding flow, the highest-inlet-velocity case shows the emergence of a disordered flow with several islands of non-negligible velocity (figure 6 b). This difference is shown by figure 6(c,d), with the red u = 0.01 isosurface at t = 500: in case A, the fluid motion induced by the infusion is substantially limited to the volume of a well-organised vortex ring whereas, in case G, almost the whole vitreous chamber is involved.

Figure 6. (a,c) Lowest (case A) and (b,d) highest (case G) flow-rate cases. (a,b) Isolines of u = 0.01 on the plane z = 0 for increasing time, according to the colourbar. (c,d) Isosurfaces u = 0.01 at t = 500. (e) Fraction of volume of the vitreous chamber where u > 0.01, as a function of time. Line colours indicate the Reynolds number according to the colourbar. (f) Time average of volume fraction against the Reynolds number. The error bars indicate ± the standard deviation.
Transport and mixing can be quantitatively assessed by identifying the so-called hyperbolic LCS. They are distinguished surfaces, extremely robust to changes in the initial or boundary conditions, that act as barriers or attractors of nearby trajectories, thus individuating regions of the flow with transport and mixing features (see Haller (Reference Haller2015) for an extensive review). The FTLEs are a well-assessed tool for identifying LCS. Formally, they measure the rate of exponential divergence of nearby trajectories in a flow. Consequently, the LCS can be identified as the ridges of relatively high FTLE values (Haller Reference Haller2001). LCS surfaces delimit regions of the fluid with different kinematical characteristics and thus offer a tool for the interpretation of the fluid dynamics phenomena and mixing, as in the present case. Owing to their ease of interpretation, FTLEs have been employed in geophysical (Shadden et al. Reference Shadden, Lekien and Marsden2005), environmental (Badas & Querzoli Reference Badas and Querzoli2011) and cardiovascular (Badas et al. Reference Badas, Domenichini and Querzoli2017) flows, to name a few. Operatively, FTLE calculation is based on the evaluation of the largest eigenvalue
 $\lambda_{max}$
of the Cauchy–Green deformation tensor
$\lambda_{max}$
of the Cauchy–Green deformation tensor
 $\boldsymbol{D}=\left(\frac{\mathrm{d}\mathbf{X }^{t+T}\left(\boldsymbol{x}\right)}{\mathrm{d}\boldsymbol{x}}\right)^{2}$
, where
$\boldsymbol{D}=\left(\frac{\mathrm{d}\mathbf{X }^{t+T}\left(\boldsymbol{x}\right)}{\mathrm{d}\boldsymbol{x}}\right)^{2}$
, where
 $X^{t+T}(\boldsymbol{x})$
is the so-called flow map that advects the initial grid
x
(t) to
x
(t + T) within a time T, and evaluated as
$X^{t+T}(\boldsymbol{x})$
is the so-called flow map that advects the initial grid
x
(t) to
x
(t + T) within a time T, and evaluated as
 ${\rm FTLE}=\frac{1}{\left| T\right| }\ln \left(\sqrt{\lambda _{max}}\right)$
(Haller Reference Haller2015). If T > 0, FTLEs measure the divergence of nearby trajectories, thus identifying repelling LCS (so-called forward FTLEs); vice versa, attracting LCS are identified with backward FTLEs, which correspond to T < 0. The FTLE computation is performed as a post-process on the three-dimensional computed velocity fields using the public domain Visual Computing Group Heidelberg plugins for Paraview (Hanser et al. Reference Hanser, Klein, Rieck, Wiebe, Selz, Piatkowski, Sagristà, Zheng, Lukácová-Medvidová, Craig, Leitte, Sadlo, Bebis, Boyle, Parvin, Koracin, Turek, Ramalingam, Xu, Lin, Alsallakh, Yang, Cuervo and Ventura2018; Sadlo & Peikert Reference Sadlo, Peikert, Hege, Polthier and Scheuermann2009). After a preliminary analysis, the advection time was set at 25
${\rm FTLE}=\frac{1}{\left| T\right| }\ln \left(\sqrt{\lambda _{max}}\right)$
(Haller Reference Haller2015). If T > 0, FTLEs measure the divergence of nearby trajectories, thus identifying repelling LCS (so-called forward FTLEs); vice versa, attracting LCS are identified with backward FTLEs, which correspond to T < 0. The FTLE computation is performed as a post-process on the three-dimensional computed velocity fields using the public domain Visual Computing Group Heidelberg plugins for Paraview (Hanser et al. Reference Hanser, Klein, Rieck, Wiebe, Selz, Piatkowski, Sagristà, Zheng, Lukácová-Medvidová, Craig, Leitte, Sadlo, Bebis, Boyle, Parvin, Koracin, Turek, Ramalingam, Xu, Lin, Alsallakh, Yang, Cuervo and Ventura2018; Sadlo & Peikert Reference Sadlo, Peikert, Hege, Polthier and Scheuermann2009). After a preliminary analysis, the advection time was set at 25
 $\tau$
= 25D/U
m
, chosen as a compromise to capture also the most important low-velocity ridges.
$\tau$
= 25D/U
m
, chosen as a compromise to capture also the most important low-velocity ridges.
Figure 7 presents the colourmaps of forward FTLEs,
 $\varLambda_{+}$
, in the plane z = 0. The LCS ridges delimit two independent regions. The first region consists of the portion of the chamber involved in the irrigation flow, which includes the volume around the jet and precisely identifies the developing vortex ring. The second region delimits the nearly spherical domain intersected by the outflow through the vitrector. At their common boundary, they are separated by an intense ridge that sharply divides the fluid moving towards the outlet from the fluid entraining the jet. The transversal dimension around the jet axis of the first region gives the radius of fluid attraction due to the entrainment into the infusion jet. Since forward FTLE ridges are barriers to transport, the portion of the vitreous chamber outside these two LCS is not directly involved in the infusion and the related mixing process. Figure 7(a–d), describing the time evolution of case A, depicts a well-organised structure that does not change during the entire period. Subsequently, a significant portion of the vitreous chamber is not intersected by the infusion flow during the observation period.
$\varLambda_{+}$
, in the plane z = 0. The LCS ridges delimit two independent regions. The first region consists of the portion of the chamber involved in the irrigation flow, which includes the volume around the jet and precisely identifies the developing vortex ring. The second region delimits the nearly spherical domain intersected by the outflow through the vitrector. At their common boundary, they are separated by an intense ridge that sharply divides the fluid moving towards the outlet from the fluid entraining the jet. The transversal dimension around the jet axis of the first region gives the radius of fluid attraction due to the entrainment into the infusion jet. Since forward FTLE ridges are barriers to transport, the portion of the vitreous chamber outside these two LCS is not directly involved in the infusion and the related mixing process. Figure 7(a–d), describing the time evolution of case A, depicts a well-organised structure that does not change during the entire period. Subsequently, a significant portion of the vitreous chamber is not intersected by the infusion flow during the observation period.

Figure 7. Colourmaps of forward FTLEs in the plane z = 0 for (a−d) case A (U m = 1.00 m s−1) and (e−h) case G (U = 2.65 m s−1). The colourmap is saturated at both the bottom and the top to highlight the ridges, i.e. repelling LCS.
The transport of previously deposited substances thus occurs mostly within the annular vortex region. At high flow rates (case G; figure 7 e–h), the scenario is initially similar (figure 7 e) but the small-scale structures that develop with time interact with both the LCS-related incoming jet and its entrainment zone and the LCS associated with the outflow. As a result, the LCS generated by the infusion flow spread over the whole vitreous chamber in a disordered pattern. Substances released in the posterior portion of the chamber would undergo mixing throughout the entire volume.
The shape of the repelling LCS in the low-velocity case resembles the region bounded by the isosurface u = 0.01, thus corroborating the hypothesis that relevant flow structures are characterised by u > 0.01, at least. We introduce a first hydrodynamic integral index to assess the portion of the vitreous chamber involving relatively intense fluid motion, defined as the volume V of the region where u > 0.01, rescaled with the chamber volume V 0. The evolution of V/V 0 with time is reported in figure 6(e). In all cases, after a short transient, V/V 0 reaches a plateau. In the low-flow-rate case, the value is around 0.3. As Re increases, the plateau increases and, at the same time, larger oscillations around this plateau value are observed. However, beyond Re ≈ 800 (Q > 15 ml min−1), V/V 0 oscillates around an almost constant value, ≈0.5, with a similar oscillation amplitude as shown by figure 6(f), where the average value and the standard deviation (for t > 300) are plotted versus the Reynolds number.
To complete the description, we present in figure 8(a–f) the backward FTLEs, denoted as
 $\varLambda_{-}$
, that confirm the picture drawn by the forward FTLEs. In the low-flow-rate case (A), the flow remains ordered and the vortex ring stable, whereas the high-flow-rate case (G) displays a disordered flow, where the vortex ring becomes unstable. Interestingly, the ridges identifying the attracting LCS of the vortex ring depict small-scale Kelvin−Helmholtz vortices (figure 8
f), as already noticed for these flow structures (Fontane et al. Reference Fontane, Joly and Reinaud2008).
$\varLambda_{-}$
, that confirm the picture drawn by the forward FTLEs. In the low-flow-rate case (A), the flow remains ordered and the vortex ring stable, whereas the high-flow-rate case (G) displays a disordered flow, where the vortex ring becomes unstable. Interestingly, the ridges identifying the attracting LCS of the vortex ring depict small-scale Kelvin−Helmholtz vortices (figure 8
f), as already noticed for these flow structures (Fontane et al. Reference Fontane, Joly and Reinaud2008).

Figure 8. (a−f) Colourmaps of backward FTLEs in the plane z = 0 for case A (a−c) U = 1 m s−1 and case G (d−f) U = 2.65 m s−1. The colourmap is saturated at both the bottom and the top to highlight the ridges, which approximately identify the attracting LCS. (g) Variation of the mixing measure, M =
 $\int _{V}(\varLambda _{+}\varLambda _{-})^{0.5}\,\mathrm{d}V$
, with time, for different values of Re. (h) Average in time of the mixing measure as a function of Re. The error bars represent a range of two standard deviations. The black solid line is a fit to guide the eye.
$\int _{V}(\varLambda _{+}\varLambda _{-})^{0.5}\,\mathrm{d}V$
, with time, for different values of Re. (h) Average in time of the mixing measure as a function of Re. The error bars represent a range of two standard deviations. The black solid line is a fit to guide the eye.
A mixing index can be defined by combining forward and backward FTLEs. In regions with high values of forward and backward FTLEs, stable and unstable manifolds intersect. These zones exhibit high mixing activity, as nearby fluid particles undergo both stretching and accumulation along distinct directions. Consequently, tracer particles within these regions potentially include fluid parcels that have very different origins and destinations in the future, thereby experiencing ideal conditions for effective mixing. Based on this, we introduce an integral mixing measure defined as M(t) =
 $\int _{V}(\varLambda _{+}\varLambda _{-})^{0.5}\,\mathrm{d}V$
(d’Ovidio et al. Reference d’Ovidio, Fernández, Hernández-García and López2004; Kameke et al. Reference Kameke, Kastens, Rüttinger, Herres-Pawlis and Schlüter2019) and plot M as a function of time in figure 8(g). Note that we included also FTLEs stemming from the inlet jet since the terminal part, close to the impact region, may play a key role in transport. Similarly to the integral index V/V
0 defined above, we observe a steep initial increase, followed by a plateau, irrespective of the flow rate. Therefore, the size of the regions intersected by non-negligible fluid motion reaches an asymptotic state whose intensity depends on the Reynolds number. This dependence is highlighted in figure 8(h), showing the time-averaged value M as a function of Re. The increase of the inlet flow rate from case A to case G leads to an increase of the mixing measure of about twofold with significant oscillations in time, of the order of 10 %.
$\int _{V}(\varLambda _{+}\varLambda _{-})^{0.5}\,\mathrm{d}V$
(d’Ovidio et al. Reference d’Ovidio, Fernández, Hernández-García and López2004; Kameke et al. Reference Kameke, Kastens, Rüttinger, Herres-Pawlis and Schlüter2019) and plot M as a function of time in figure 8(g). Note that we included also FTLEs stemming from the inlet jet since the terminal part, close to the impact region, may play a key role in transport. Similarly to the integral index V/V
0 defined above, we observe a steep initial increase, followed by a plateau, irrespective of the flow rate. Therefore, the size of the regions intersected by non-negligible fluid motion reaches an asymptotic state whose intensity depends on the Reynolds number. This dependence is highlighted in figure 8(h), showing the time-averaged value M as a function of Re. The increase of the inlet flow rate from case A to case G leads to an increase of the mixing measure of about twofold with significant oscillations in time, of the order of 10 %.
In summary, at low infusion flow rate, the flow remains well organised, and predominant ordered flow structures mainly consisting of the jet and the vortex ring are localised in the posterior part of the vitreous chamber. An increase in the inlet velocity promotes a progressive proliferation of smaller vortical structures, that spread over the entire volume and increase mixing, as demonstrated by the behaviour of the index M. However, an increase in the infusion flow rate above 15 ml min−1 (Re ≈ 800) does not seem to induce relevant variations in the fraction of chamber volume where infusion flow generates important fluid motion (u > 0.01) above the limiting value V/V 0 ≅ 0.5. Both the mixing region size and the average mixing index are doubled when the infusion ranges from the minimum up to the maximum flow rate considered. From a medical perspective, in the staining procedure, it may be counterproductive to employ high inlet flow rates. As a matter of fact, they may significantly enhance mixing within the entire volume, thus causing undesired staining of remote structures or dangerous migration in the subretinal space, a more difficult removal and reduced visibility, also associated with an increased risk of retinal damage due to pressure and shear stresses. Vice versa, for triamcinolone particle injections, uniform mixing may be desirable since they are used as a tracer of vitreous gel cortex remnants that may adhere to any retinal region.
5.1. A practical example: Lagrangian transport of particles deposited at the bottom
We conclude our analysis with an example reminiscent of the clinical situation with triamcinolone particles shown in figure 1(b). To this aim, we present the tracking of 300 000 non-buoyant particles purely advected by the flow, initially deposited in a bottom region, 0.5 ml in volume, a typical amount injected during surgery. Integration is performed using the built-in post-processing ParticleTracer module in Paraview®, with a dimensional time step equal to 0.5
 $\tau$
.
$\tau$
.

Figure 9. Transport of approximately 300 000 particles (dots) deposited at the bottom of the vitreous chamber, coloured with the velocity magnitude: (a−d) case A and (e−h) case G. (i) Fraction of particles below a certain height y at t = 200. (l) Horizontally averaged mixing index, MH , as a function of the height, y, at time t = 1000.
In the lowest-velocity case (A), figure 9(a–d), the particle motion appears to be ordered. Accumulation occurs along the annular vortex ring, following the attracting manifold described in the previous section (figure 8 a–c). Particles are initially advected within the lower part of the vortex ring core. Then, they propagate azimuthally along the core and reach also the upper part of the ring. At the same time, a small fraction of the particles is ejected from the separation point upwards to be redirected downwards as they interact with the jet. No significant mixing occurs at very large heights. Interestingly, the dye distribution observed during surgery of figure 1(c) suggests the same transport observed in figure 9(a–d), at the bottom of the vitreous chamber. Conversely, case G (figure 9 e–h) depicts a disordered distribution of particles driven by the secondary vortical structures observed in the panels of the last row of figure 3.
To summarise how the particle distribution changes with the infusion flow rate, in figure 9(i) we report the fraction of particles below a given height (along the y direction) for the investigated cases, at t = 200. In cases A and B the particles remain significantly more confined in the lower portion of the chamber, while cases C–G collapse quite well together, a trend similar to that observed in figure 9(l), which shows the horizontally averaged mixing index as a function of the height,
 $M_{H}(y,t)=\int _{S(y)}(\varLambda _{+}(x,z,t)\varLambda _{-}(x,z,t))^{0.5}\,\mathrm{d}S$
, for t = 1000.
$M_{H}(y,t)=\int _{S(y)}(\varLambda _{+}(x,z,t)\varLambda _{-}(x,z,t))^{0.5}\,\mathrm{d}S$
, for t = 1000.
In summary, the general hydrodynamic observations of previous sections hold, giving faithful qualitative and quantitative indications on dispersion within the vitreous chamber, also when tracers are initially deposited at the bottom of the chamber. As expected, injected tracers tend to accumulate along the attracting manifolds for the low-flow-rate case (A), whereas there is spreading within the entire vitreous chamber at high flow rate (case G), due to instability of vortical structure that drives the disordered distribution (figure 3) of attracting (figure 8) and repelling (figure 7) manifolds and, ultimately the dispersion of particles in the whole vitreous chamber. In principle, the same analysis applies to diluted staining dyes, since their diffusivity is extremely small, the Schmidt number, i.e. the ratio between the kinematic viscosity of water and the diffusivity, being of the order of 103 (Lee et al. Reference Lee, Ahn, Kim, Kim, Yeom, Kim, Park and Ryu2023). This suggests that both the surgical situations shown in figure 1 depict very similar accumulation and dispersion properties that can be accurately described within the present FTLE approach.
6. Discussion and conclusion
In this study, we investigated the fluid dynamics of the infusion of BSS within a model of the vitreous chamber during ophthalmic surgery. The infusion generates a jet characterised by high velocities (ranging from 1.00 to 2.65 m s−1 with the clinically typical flow rates considered). On the opposite wall, the jet generates a vortex ring that expands with time. At high flow rates (Re > 700, Q > 13 ml min−1), smaller hairpin vortices develop from the vortex ring and interact with each other, resulting in a disordered flow that eventually invades the entire chamber (figures 3 and 7). The LCS suggested that the disordered flow does not stem from the instability of the infusion jet but rather from the instabilities of the structures developing after the jet impingement and occurring at the scale of the vitreous chamber (figures 7 and 8). The high-velocity, coherent jet impacting the retinal wall results in large relative pressures on the retinal surface constantly increasing with the flow rate and reaching approximately 1200 Pa in the highest-velocity scenario (figure 5 c). Differently, the WSSs exhibit a saturation for Re > 600, suggesting that the mixing due to the flow instability promotes more effective momentum fluxes that mitigate the increase of WSS (figure 5 d). Mixing is localised in the region where the velocity exceeds 0.01U m . The mixing index, M, and the size of the mixing region increase with the flow rate, involving larger and larger portions of the vitreous chamber, both saturating at about 15 ml min−1 to twice the values attained at the lowest clinical flow rate (figures 6 f and 8 h).
Our work aims at characterising the most important fluid dynamics properties within the vitreous chamber during infusion and giving first indications towards guidelines adapted for these conditions, to optimise outcomes and minimise potential complications during and after surgery. We provided numerical estimates of the forces generated by the infusion jet, which can serve as a reference for future experimental and biological studies aimed at establishing damage thresholds. In the staining procedure, excessive mixing may jeopardise the process by redistributing the dye throughout the chamber. In that case, a flow rate below 13 ml min−1 may significantly limit the dispersion to the lower vitreous chamber. Conversely, in the case of triamcinolone, uniform mixing may be desired, thus suggesting an opposite choice. In addition, abnormal peak pressures that emerge at large flow rates may easily damage retinal tissues. Our results suggest that flow rates exceeding 15 ml min−1 may result in significantly high forces at the retinal wall, with a pressure (∼9 mmHg) of the order of the intraocular pressure of the eye (∼16 mmHg) and WSS magnitude about ten times that observed in physiological saccadic motions (Meskauskas et al. Reference Meskauskas, Repetto and Siggers2012), for a 25-gauge surgery set, compatible with retinal tears related to infusion jetstream (Bilgin et al. Reference Bilgin, Türkoğlu, İlhan, Ünal and Apaydın2015). Indeed, peak pressure higher than theoretical estimates of the capillary pressure within the retina (∼3−5 mmHg), for a flow rate exceeding 15 ml min−1, could be associated with retinal damage due to collapse of capillaries (Kim et al. Reference Kim, Jo, Moon, Joo and Choi2014; Takahashi et al. Reference Takahashi, Nagaoka, Yanagida, Saitoh, Kamiya, Hein, Kuo and Yoshida2009). However, excessively low flow rates may compromise the efficiency of surgery by slowing down fluid replacement.
It should be noted that our study presents some approximations. First, the model boundary conditions and geometrical simplifications might not fully capture the complexity of the procedure, although the essential elements are considered. For example, the use of simplified cylindrical cannulas may not perfectly represent the varying shapes and sizes of surgical instruments or the irregularities in the eye geometry. Second, simulations were performed with a constant flow rate, which may not fully reflect the dynamic nature of the surgical procedure due to adjustments performed by the surgeon, also in the vitrector (outlet) position and the possible presence of vitreous fragments which may locally alter the flow. Finally, we did not consider the possible density difference of the dye compared to BSS. However, we are reasonably confident that the main features in terms of vortical structures and the onset of unsteady mixing remain the same. Further studies may involve the evaluation of the jet-induced stress values for biological samples as well as flow optimisation through numerical simulations and experimental set-ups mimicking in detail the infusion instruments to optimise clinical indices of relevance, as well as the optimisation of the inlet geometry to tune mixing depending on the phase of the surgery while reducing forces acting on the retina.
Funding statement
We acknowledge the CINECA award under the ISCRA initiative, for the availability of high-performance computing resources and support.
Competing interests
None.
Author contributions
P.G.L.: conceptualisation, methodology, software, formal analysis, investigation, visualisation, writing – original draft, writing – review and editing. T.R.: conceptualisation, investigation, writing – review and editing. M.G.B.: conceptualisation, methodology, investigation, writing – review and editing. G.Q.: conceptualisation, methodology, investigation, visualisation, writing – review and editing, supervision. All authors approved the final submitted draft.
Data availability statement
The data that support the findings of this study are available from the corresponding author upon reasonable request.
Appendix A. Mesh convergence analysis
The numerical implementation is performed with the finite-volume solver OpenFOAM®. The eye geometry is provided as an STL file. BlockMesh generates a background mesh of hexahedral elements, employed by snappyHexMesh to generate the actual computational mesh enclosed within the vitreous chamber surface. We employ a cylindrical and a hemispherical local refinement, the first extruded along the jet direction while the latter localised in the vicinity of the impact region (see figure 10). Near the inlet and outlet, additional refinements are employed, so that at least 15 points along the radial direction describe the velocity profiles at the inlet and at the outlet. At the walls, three layers with an expansion ratio of 1.2 are extruded. We exploit second-order spatial schemes. Time-marching is obtained through a second-order backward differentiation formula with a time step equal to 0.0025
 $\tau$
. Solvers for the resulting nonlinear systems are set to a tolerance of 10–5 for pressure and of 10–8 for all other variables. Mesh convergence is assessed by varying the background mesh through the utility blockMesh so that the mesh is uniformly refined. As a test case, we consider the highest-flow-rate case (G), characterised by the most complex flow. We consider 0 < t < 330, and four different mesh refinements, labelled M0 (1 099 110 elements), M1 (1 332 680 elements), M2 (2 062 022 elements) and M3 (3 019 449 elements). Figure 10 shows the results of the convergence analysis, in terms of integral quantities, i.e. average velocity magnitude (figure 10
a) and enstrophy (the integral of the square of vorticity magnitude; figure 10
b) with time, the latter shown since it amplifies both errors stemming from numerical discretisation due to derivation and integration. This case is characterised by unsteady oscillations of these integral quantities. Results for different refinements agree with each other, suggesting that the simulations reached spatial convergence. In more detail, the insets in figure 10 show the relative difference between the time average of each case and that of the most refined solution. As inferred, the error progressively decreases when increasing the mesh refinement, reaching 0.8 % for the average velocity and 5 % for enstrophy, when mesh M2 is considered. Further convergence tests were performed for the other cases by comparing the same quantities for meshes M1 and M2, showing a decreasing error as the inlet velocity decreases. Consequently, mesh M2 has been employed as a good compromise between accuracy and computational times. Figure 10(c) shows a section of the employed mesh to appreciate the overall resolution and mesh refinements.
$\tau$
. Solvers for the resulting nonlinear systems are set to a tolerance of 10–5 for pressure and of 10–8 for all other variables. Mesh convergence is assessed by varying the background mesh through the utility blockMesh so that the mesh is uniformly refined. As a test case, we consider the highest-flow-rate case (G), characterised by the most complex flow. We consider 0 < t < 330, and four different mesh refinements, labelled M0 (1 099 110 elements), M1 (1 332 680 elements), M2 (2 062 022 elements) and M3 (3 019 449 elements). Figure 10 shows the results of the convergence analysis, in terms of integral quantities, i.e. average velocity magnitude (figure 10
a) and enstrophy (the integral of the square of vorticity magnitude; figure 10
b) with time, the latter shown since it amplifies both errors stemming from numerical discretisation due to derivation and integration. This case is characterised by unsteady oscillations of these integral quantities. Results for different refinements agree with each other, suggesting that the simulations reached spatial convergence. In more detail, the insets in figure 10 show the relative difference between the time average of each case and that of the most refined solution. As inferred, the error progressively decreases when increasing the mesh refinement, reaching 0.8 % for the average velocity and 5 % for enstrophy, when mesh M2 is considered. Further convergence tests were performed for the other cases by comparing the same quantities for meshes M1 and M2, showing a decreasing error as the inlet velocity decreases. Consequently, mesh M2 has been employed as a good compromise between accuracy and computational times. Figure 10(c) shows a section of the employed mesh to appreciate the overall resolution and mesh refinements.

Figure 10. Mesh convergence analysis. (a) Average velocity and (b) enstrophy, as functions of time, for different meshes according to the legend. The insets show the relative error with the most refined solution as a function of the number of elements. (c) Slice of the computational grid, at z = 0, for the employed mesh M2. (d) Comparison of the axial jet velocity (as of figure 2) between the numerical results, at t = 50, for different Re (solid lines) and the ideal scaling of the Schlichting jet axial velocity (dashed lines).
In figure 10(d), we also compare our results with the classical self-similar solution for an unconfined jet (Schlichting & Gersten Reference Schlichting and Gersten2017). For an axisymmetric, unconfined, laminar jet, the centreline velocity follows u/U m ∼ (3dRe)/(32x) (Andrade & Tsien Reference Andrade and Tsien1937). At low Reynolds numbers, the flow conditions align well with the assumptions of the Schlichting jet theory after the initial flow establishment zone, and the numerical results closely follow the expected theoretical scaling, provided the flow within the vitreous chamber remains predominantly steady. Despite the strong confinement near the inlet and the presence of significant entrainment due to the chamber size, our results remain consistent with theory, thereby validating our numerical set-up and supporting the convergence analysis. However, as Re increases, the asymptotic trend is achieved at larger distances from the inlet, and deteriorates particularly for Re > 600, mainly due to onset of flow unsteadiness, which breaks down the hypotheses of the theory and increases mixing and entrainment (see § 3).


 Open access