

Cumulative antimicrobial susceptibility reports, commonly known as antibiograms, are essential tools for assessing microbial susceptibility rates, monitoring resistance trends over time, guiding empiric antimicrobial selection, and assisting in antimicrobial formulary decisions.1 The importance of the antibiogram is underscored by the Centers for Disease Control and Prevention (CDC) Core Elements of Hospital Antibiotic Stewardship Programs, which recommends that abiogram be produced and distributed as part of the tracking and reporting antibiotic use and outcomes element.2 Despite their known value, creating a reliably accurate antibiogram can be challenging for many institutions due to low isolate volumes, a lack of necessary expertise, and/or a shortage of personnel.Reference Moehring, Hazen, Hawkins, Drew, Sexton and Anderson3 Even when constructed appropriately, institutional antibiograms are only useful within a given institution because they do not provide information regarding regional variations in susceptibility, nor do they allow for benchmarking against other comparable institutions within a geographic area or against national or international surveillance data. Conversely, large surveillance databases such as SENTRY (JMI Laboratories, North Liberty, IA) are vital for monitoring resistance patterns over time and providing comparative antimicrobial susceptibilities using standardized reference methods.Reference Fuhrmeister and Jones4 Unfortunately, given that these data are aggregated from only a few facilities per state, they are not presented with sufficient granularity to depict variations in susceptibilities within discrete metropolitan regions in the United States. Additionally, they can be misleading in that they give equal weight to susceptibility data gathered from facilities with varying institution-level factors such as bed size, patient case-mix index, and rates of microbial resistance.
One method to overcome these challenges is to develop a regional antibiogram that combines susceptibility data from hospitals within a given geographic area. This tool could then be used by hospitals within the region to assess susceptibilities for infrequently encountered organisms or novel antimicrobials that are infrequently tested. The data can be compared back to individual institutions and national data to allow benchmarking and to guide antimicrobial stewardship and infection control efforts across a broader geographic network. Previous studies have demonstrated the feasibility and value of developing a regional antibiogram, although most utilized outdated susceptibility information; were performed primarily in small, community settings with relatively low resistance rates; or analyzed only a select set of pathogens.Reference Fuhrmeister and Jones4–Reference Var, Hadi and Khardori7 Therefore, the objectives of this study were to develop a robust regional antibiogram within the Chicagoland metropolitan area and to compare these regional susceptibilities against individual hospitals within the area and to national surveillance data.
Methods
Development of the Chicagoland regional antibiogram
The Chicago–Naperville–Elgin Metropolitan Statistical Area, hereafter referred to as Chicagoland, is the third-largest Metropolitan Statistical Area in the United States by population, encompassing counties within the states of Illinois, Indiana, and Wisconsin.6 All available inpatient antibiogram data in Chicagoland from within Illinois only were combined from 2 sources: 33 hospitals in aggregate from the Becton Dickinson Insights Research Database (BD Insights cohort, Franklin Lakes, NJ), and 18 discrete, nonduplicative local hospitals (collaborators). Data from the BD Insights cohort were provided deidentified, whereas data from collaborators were aggregated and anonymized after collection. Together, these 51 facilities spanned 6 counties within the Chicagoland region (Supplementary Fig. 1 online); they represented 36% of the 141 hospitals across the state of Illinois6; and they spanned the spectrum of care from small, nonteaching, community hospitals to large, university-affiliated, academic medical centers.
The BD Insights cohort included all susceptibility data from calendar year 2017, including overall percent susceptibility and isolate counts for each pathogen–antibiotic combination as reported according to standards of each contributing institution. Only the first adult inpatient isolate per patient per 30 days was included, excluding catheter tip, surveillance, and environmental cultures. Data from collaborating institutions were provided in the form of their antibiogram from calendar year 2017 in accordance with each facility’s standards. To generate the composite Chicagoland antibiogram, data from the 51 facilities were aggregated to calculate a regional mean (±SD) susceptibility rate for each pathogen–antibiotic combination. Weighted averages were used to account for differences in the total isolate count for each species per antibiogram and are reported as % susceptible for each available pathogen–antibiotic combination. All isolates were included in the aggregate Chicagoland antibiogram, even if <30 isolates were contributed by an individual facility. The final Chicagoland antibiogram was then compared internally to collaborators and externally to national surveillance data to assess its applicability and utility. Comparative analyses were restricted to bacteria given the low number of fungal and mycobacterial isolates reported by collaborators and the lack of available susceptibility data for these pathogens in the public-facing SENTRY database.
Internal comparison
First, the Chicagoland data were compared to the 18 individual collaborating institutions’ antibiogram to determine how well it the data represented each facility. Of the 360 possible pathogen–antibiotic combinations (89 gram-positive and 271 gram-negative pathogens), 25 were selected for this analysis due to their clinical relevance, variability in susceptibility rates, and consistency in reporting across the individual collaborating facilities. A comparison was then performed by determining how many facilities fell within 1 and 2 standard deviations (SD) of the Chicagoland susceptibility rate for each of these combinations.
Additionally, because each of the 18 collaborator facilities contributed a different proportion of isolates to the final Chicagoland antibiogram for each of the 25 selected pathogen–antibiotic combinations, the variability in susceptibility rates was also assessed as a function of the percentage of isolates contributed versus dispersion from the Chicagoland mean using the Pearson correlation coefficient. As available, each collaborator facility’s specific susceptibility rate for the 25 selected pathogen–antibiotic combinations was plotted as the percentage of isolates that facility contributed for that combination to the Chicagoland antibiogram against the difference between facility-specific susceptibilities and overall Chicagoland mean susceptibilities. Only the 25 pathogen–antibiotic combinations were assessed for the BD Insights cohort as data were not facility specific.
External comparison
Second, the Chicagoland data were compared to data from the SENTRY Antimicrobial Surveillance Program from the United States in calendar year 2017. Given the large number of isolates, discrepancies between Chicagoland and national data were assessed using clinical thresholds rather than statistical differences. These thresholds were (1) a difference in susceptibility of ≥10% for a given pathogen–antibiotic combination and (2) discordance around the 80% susceptibility threshold typically used to guide empiric antibiotic selection.1
Results
The 51 hospitals included in the Chicagoland antibiogram provided susceptibility information on 167,394 gram-positive, gram-negative, fungal, and mycobacterial isolates (Table 1). In the gram-positive Chicagoland antibiogram, 26 distinct species or phenotypes are represented against 15 different antimicrobials (390 pathogen-antibiotic combinations) (Fig. 1A). Importantly, 100% of the distinct species displayed included at least 30 isolates. Conversely, among the 18 collaborating facilities, the median number of gram-positive species reported on their institutional antibiogram was 6 (min–max, 4–18). Additionally, 8 facilities (44%) reported at least 1 gram-positive species on their institutional antibiogram with <30 isolates, and 2 facilities (11%) reported 2 species. Staphylococcus aureus (total, 21,973 isolates; min–max, 352–2,011) was the most prevalent gram-positive species in Chicagoland, and Streptococcus intermedius (S. milleri group, n = 63) was the least prevalent. The most active antimicrobial agents across all gram-positive pathogens were tigecycline, linezolid, and daptomycin, with 99.4%, 99.4%, and 98.3% susceptibility, respectively. The least active agents were erythromycin, penicillin G, clindamycin, and levofloxacin at 42.9%, 61.5%, 65.4%, and 68.0% susceptibility, respectively. Evaluating specific clinically relevant pathogens revealed that 99% and 96% of the 8,700 Enterococcus faecalis strains were susceptible to ampicillin and vancomycin, respectively, whereas only 16% and 30% of the 2,260 E. faecium were susceptible, respectively (Fig. 1). Daptomycin, linezolid, and tigecycline maintained >98% susceptibility against all enterococci, regardless of vancomycin phenotype. These 3 agents, along with vancomycin and trimethoprim-sulfamethoxazole (TMP-SMZ), also demonstrated excellent activity (>95% susceptibility) against the 21,973 S. aureus isolates, 62% of which were methicillin-resistant S. aureus (MRSA). Tetracycline also demonstrated adequate activity (>80% susceptibility) against all coagulase-positive and most coagulase-negative staphylococci, whereas susceptibility to clindamycin and TMP-SMZ among coagulase-negative staphylococci (other than S. lugdunensis) was poor overall (28%–71%). Finally, just 57% of the 743 S. pneumoniae isolates tested were susceptible to erythromycin, whereas the susceptibility to other commonly utilized agents such as levofloxacin (98%) and ceftriaxone (97%) remained reliably high.
Table 1. Overall Isolate Count by Organism and Data Source
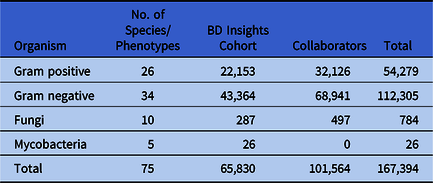
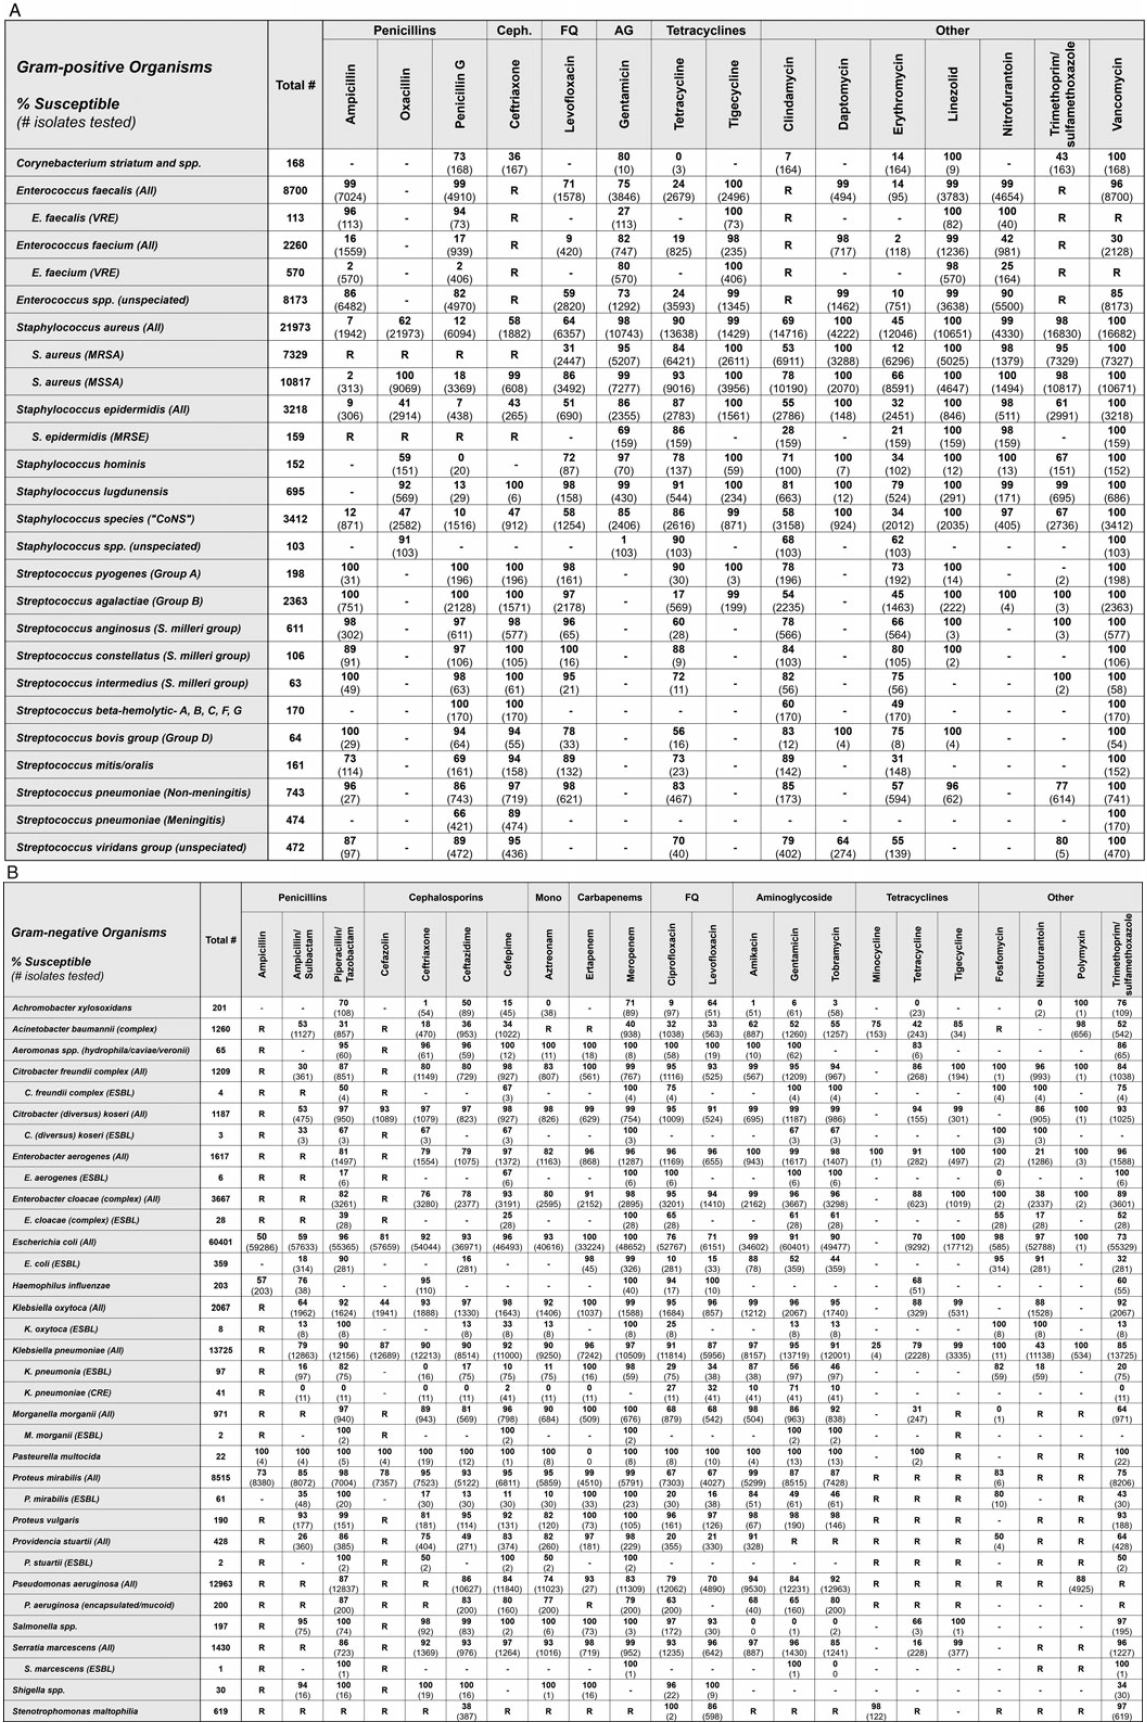
Fig. 1. Chicagoland regional antibiogram from calendar year 2017 for gram-positive (A) and gram-negative bacteria (B). Note. AG, aminoglycoside; Ceph, cephalosporin; FQ, fluoroquinolone; Mono, monobactam; spp, species, isolate only identified to the genus level, or listed species provided in aggregate; ESBL, extended-spectrum β-lactamase–producing; CRE, carbapenem-resistant Enterobacteriaceae; R, Definitive or intrinsic resistance per CLSI M100-S30 or M45-A3; -, no data.
In the gram-negative Chicagoland antibiogram, 34 distinct species or phenotypes are represented against 22 different antimicrobials (748 pathogen-antibiotic combinations) (Fig. 1B). Importantly, all but 1 of the distinct species displayed included at least 30 isolates (Pasteurella multocida, n = 22). Conversely, among the 18 collaborating facilities, the median number of gram-negative species reported on their institutional antibiogram was 9 (min–max, 7–16). Additionally, 9 facilities (50%) reported at least 1 gram-negative species on their institutional antibiogram with <30 isolates, 6 facilities (33%) reported 2 isolates, 1 facility (5.6%) reported 3 isolates, and 1 facility (5.6%) reported 5 isolates. Escherichia coli (total, 60,401 isolates; min–max, 130–8,309) was the most prevalent gram-negative species in the Chicagoland antibiogram, and P. multocida (n = 22 isolates) was the least prevalent. The most active agents across all gram-negative pathogens were tigecycline, amikacin, and meropenem, to which 98.6%, 97.4%, and 96.5% of reported isolates were susceptible, respectively. The least active agents were ampicillin/sulbactam, tetracycline, and cefazolin at 63.5%, 68.7%, and 76.3% susceptibility, respectively. Notable clinically important trends among the gram-negative pathogens evaluated included ceftriaxone-resistant Enterobacteriaceae (ESBL), carbapenem-resistant Enterobacteriaceae (CRE), Pseudomonas aeruginosa (CRPA), and Acinetobacter baumannii (CRAB). Among the Enterobacteriaceae, ceftriaxone resistance was the highest among E. cloacae complex at 24%, the lowest among Citrobacter koseri at 3%, and 10% overall among Klebsiella pneumoniae. Only 4% and 3% of the 13,725 K. pneumoniae tested were resistant to ertapenem and meropenem, respectively. The susceptibility rates of the 12,963 P. aeruginosa isolates to piperacillin-tazobactam (87%), ceftazidime (86%), and cefepime (84%) were adequate and higher than that of meropenem (83%). Conversely, only 40% of the 1,260 A. baumannii were meropenem susceptible, and only tigecycline (85%) and polymyxin (98%) retained >80% susceptibility. Finally, minocycline demonstrated improved susceptibility (98%) over TMP-SMZ (97%) and levofloxacin (86%) against the 619 Stenotrophomonas maltophilia tested.
In the fungal Chicagoland antibiogram, 10 distinct species or phenotypes of Candida (n = 784 isolates) are reported against 9 antifungals (Supplementary Fig. 2 online). Candida albicans (n = 368) was the most prevalent species, followed by C. glabrata (n = 235). Each of the azoles, echinocandins, and polyenes demonstrated ≥96% susceptibility against C. albicans, whereas fluconazole, itraconazole, and posaconazole were <80% susceptible to C. glabrata. Otherwise, each Candida-antifungal combination with ≥30 isolates tested maintained >80% susceptibility, except for itraconazole against non-albicans Candida spp (n = 73, 55%).
In the mycobacterial Chicagoland antibiogram, 5 distinct species or phenotypes (n = 27 isolates) are reported against 11 antimicrobials (Supplementary Fig. 3 online). The most common species was Mycobacterium avium complex (MAC, n = 18 isolates), followed by M. tuberculosis complex (n = 6), M. abscessus (n = 1), M. xenopi (n = 1), and unspeciated Mycobacterium (n = 1). Of the reported MAC isolates, 100% (n = 7) were susceptible to clofazimine, 88% (n = 18) were susceptible to clarithromycin, and 14% (n = 7) were susceptible to ethambutol. None of the 7 MAC isolates tested were susceptible to fluoroquinolones or aminoglycosides.
Internal comparison
Demographics in terms of bed size, type, and teaching status were well distributed across the 18 collaborator hospitals (Table 2). Of the 167,394 isolates from the Chicagoland antibiogram, 69,291 from the 18 collaborator facilities were used in the internal comparison across the 25 selected pathogen-antibiotic combinations (Table 3). Overall, 219 (64%) facility-specific susceptibility rates were within 1 SD of Chicagoland, and 326 (96%) were within 2 SD. There was no correlation between the % of isolates contributed to a given pathogen-antibiotic combination and the SD from the overall susceptibility mean across the 18 collaborator hospitals (r = 0.06; P = .260) (Fig. 2).
Table 2. Demographics of 18 Collaborator Facilities According to 2019 American Hospital Association Handbook
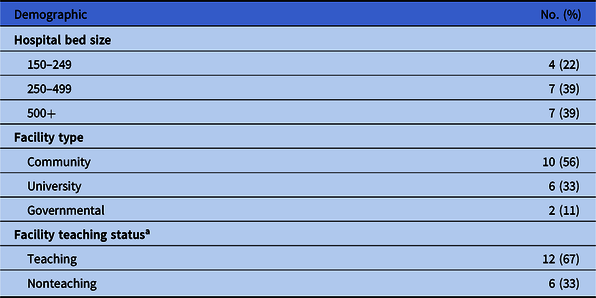
a Teaching status defined as accreditation by Accreditation Council for Graduate Medical Education.
Table 3. Regional Susceptibilities and Variability Among 18 Collaborator Hospitals for Select Gram-Positive and Gram-Negative Pathogen–Antibiotic Combinations
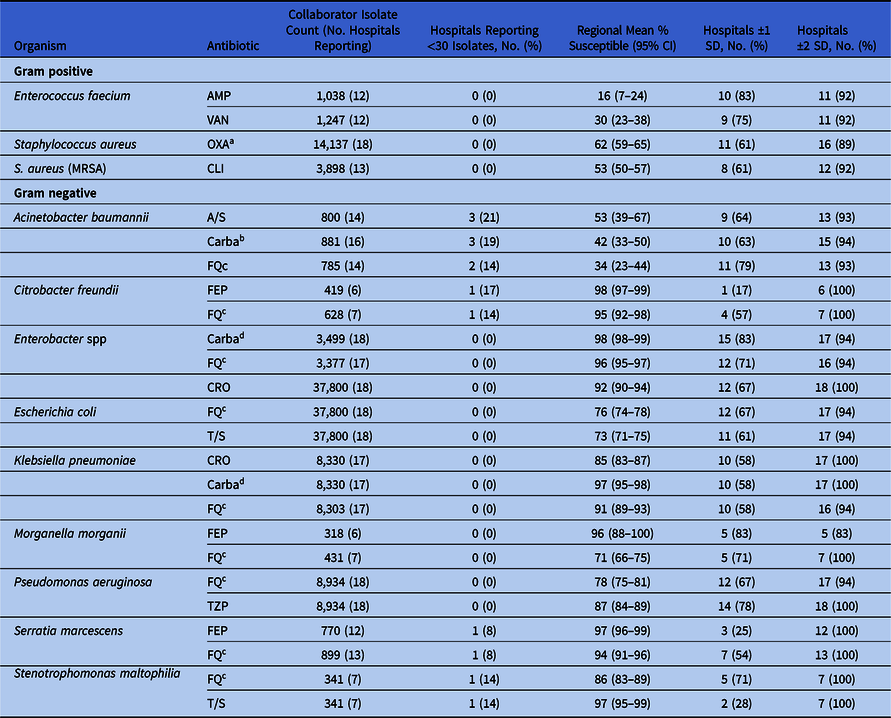
Note. AMP, ampicillin; A/S, ampicillin/sulbactam; Carba, carbapenem; CRO, ceftriaxone; CLI, clindamycin; FEP, cefepime; FQ fluoroquinolone; OXA, oxacillin; TZP, piperacillin/tazobactam; T/S, trimethoprim/sulfamethoxazole; VAN, vancomycin.
a Anti-staphylococcal penicillin susceptibility as reported to either methicillin, nafcillin, or oxacillin.
b Most susceptible to either imipenem-cilastatin or meropenem if both were reported.
c Most susceptible to either ciprofloxacin or levofloxacin if both were reported.
d Most susceptible to ertapenem, imipenem-cilastatin, or meropenem if >1 was reported.
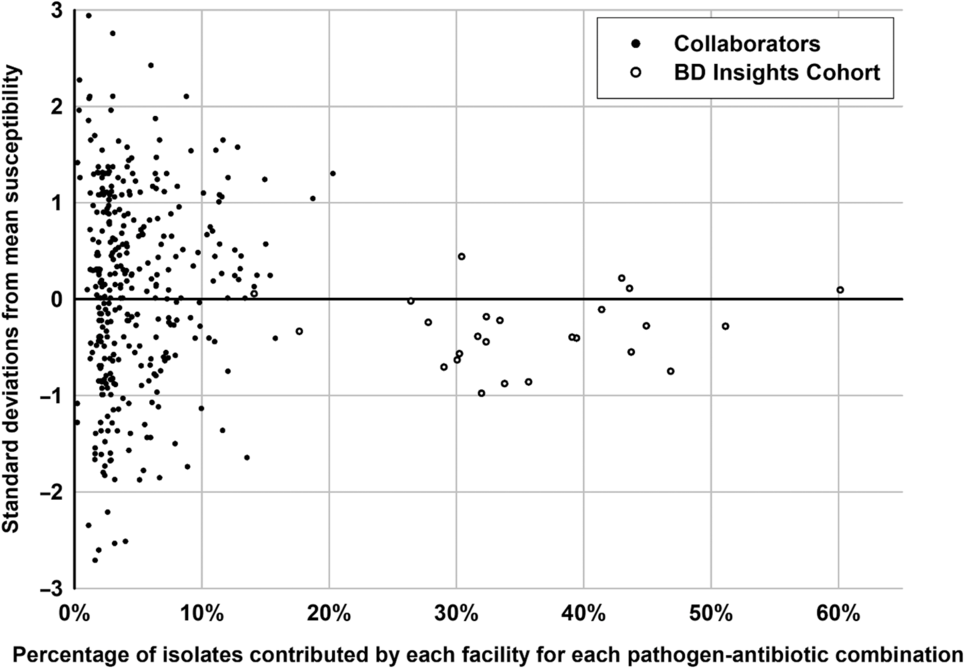
Fig. 2. Distribution of hospital-specific deviance from the Chicagoland regional mean susceptibility by percentage of isolates contributed to the 25 select pathogen–antibiotic combinations.
The selected 4 clinically relevant gram-positive pathogen–antibiotic combinations comprised 15,384 gram-positive isolates from the 18 collaborator antibiograms. Across this internal analysis, 73% of facility-specific pathogen–antibiotic susceptibilities were within 1 SD of the Chicagoland rate, and 93% were within 2 SD (Table 3). No facility-specific gram-positive pathogen–antibiotic combinations fell below 2 SD of the Chicagoland mean. None of the collaborator facilities reported <30 isolates for any of these 4 combinations.
The 21 clinically relevant gram-negative pathogen–antibiotic combinations selected included 61,743 gram-negative isolates from the 18 collaborator antibiograms. Across this internal analysis, 63% fell within 1 SD of the Chicagoland rate and 97% fell within 2 SD (Table 3). For 6 pathogen-antibiotic combinations, a single facility reported susceptibility rates >2 SD below the Chicagoland rate. In all 6 cases, each respective facility contributed <5% of the isolates from that pathogen–antibiotic combination to the Chicagoland antibiogram. Additionally, the 95% confidence intervals around the regional mean susceptibility rates were the widest for the 3 A. baumannii–antibiotic combinations, likely due to these 3 combinations having the greatest number of hospitals reporting <30 isolates on their antibiogram.
External comparison
For the external comparison to national susceptibility data, a total of 149,533 isolates from the Chicagoland data were compared to 21,049 isolates from the national 2017 US SENTRY data.
The gram-positive analysis included 39,257 isolates from Chicagoland and 9,516 from SENTRY across 89 pathogen–antibiotic combinations (Table 4). Overall, 6 of 89 combinations (6.7%) crossed the prespecified threshold of ≥10% difference in susceptibility rates, had disparity around the 80% empiric susceptibility threshold, or both. All 6 combinations had ≥10% difference in susceptibility rates, although 4 of these 6 (67%) combinations demonstrated susceptibility rates <80% on both the Chicagoland and SENTRY antibiograms. The only 2 pathogen–antibiotic combinations demonstrating disparity across this clinically relevant threshold were clindamycin against S. aureus overall and against methicillin-susceptible S. aureus (MSSA), in which both cases Chicagoland was >10% less susceptible (69% vs 86% and 78 vs 95%, respectively). Of the other 4 combinations demonstrating a ≥10% difference in susceptibility rates, 2 (50%) were >10% higher in Chicagoland and 2 (50%) were lower, although all susceptibilities for these combinations were <80% on both antibiograms, and 3 of 4 were <50% susceptible.
Table 4. Comparison of Select Gram Positive Organism Susceptibilities Between the Chicagoland Regional Antibiogram and 2017 US SENTRY Surveillance Dataa, b, c, d, e, f

Note. AMP, ampicillin; PEN, penicillin G; OXA, oxacillin; CPT, ceftaroline; CRO, ceftriaxone; DPT, daptomycin; VAN; vancomycin; LEVO, levofloxacin; MIN, minocycline; TET, tetracycline; TGC, tigecycline; CLI, clindamycin; ERY, erythromycin; LZD, linezolid; T/S, trimethoprim/sulfamethoxazole; --, no data; NR, not reported
a Reported as percent susceptible for Chicagoland/SENTRY.
b Signifies >10% increased susceptibility in Chicagoland compared to US SENTRY.
c Signifies >10% decreased susceptibility in Chicagoland compared to US SENTRY.
d Signifies increased susceptibility in Chicagoland that crosses the 80% susceptibility threshold.
e Signifies decreased susceptibility in Chicagoland that crosses the 80% susceptibility threshold.
f <30 isolates.
The gram-negative analysis included 110,276 isolates from Chicagoland and 11,533 from SENTRY across 271 pathogen–antibiotic combinations (Table 5). Overall, 61 (22.5%) combinations crossed the prespecified threshold of ≥10% difference in susceptibility rates, disparity around the 80% empiric susceptibility threshold, or both. Of these 61 combinations, 53 had a difference of ≥10%, although 30 of these 53 (57%) combinations demonstrated susceptibility rates <80% on both the Chicagoland and SENTRY antibiograms. Also, 13 pathogen–antibiotic combinations (4.7%) showed discordance around the 80% empiric susceptibility threshold, with 7 (2.6%) having higher susceptibility rates and 6 (2.2%) with lower susceptibility rates in Chicagoland, respectively. Most of these disparities occurred among resistant phenotypes of specific organisms such as ESBL-producing Enterobacter cloacae and K. pneumoniae, and organisms with high baseline resistance such as A. baumannii and Providencia stuartii. Conversely, the susceptibility of common, nonresistant phenotypes of E. coli, K. pneumoniae, and P. aeruginosa were comparable between Chicagoland and SENTRY data.
Table 5. Comparison of Select Gram-Negative Organism Susceptibilities Between the Chicagoland Regional Antibiogram and 2017 US SENTRY Surveillance Dataa, b, c, d, e, f
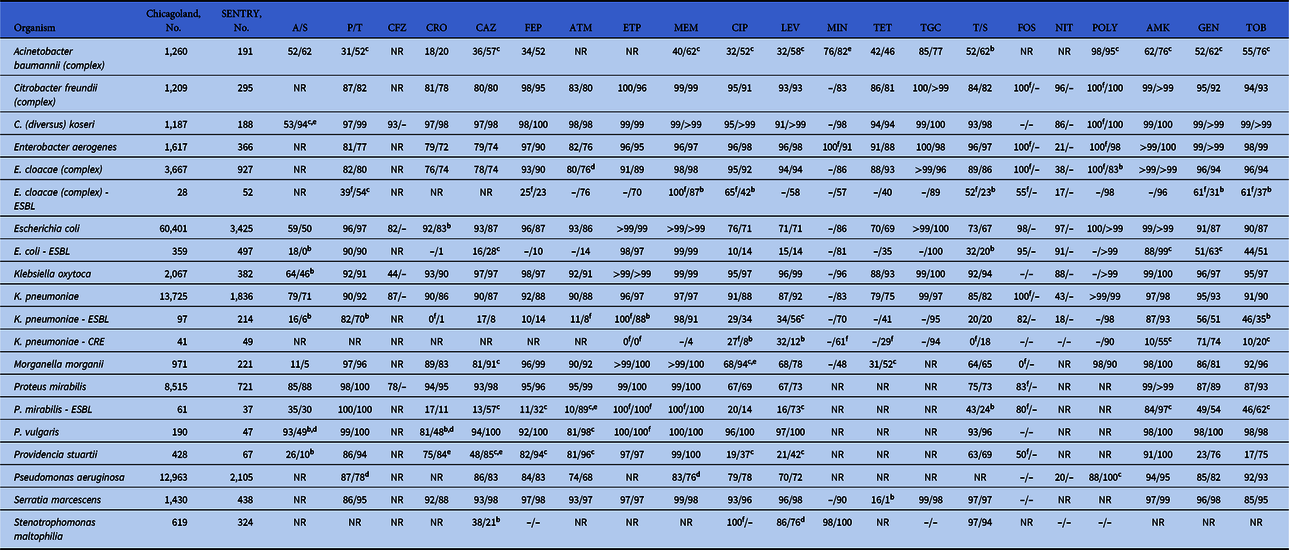
Note. A/S, ampicillin/sulbactam; P/T, piperacillin/tazobactam; CFZ, cefazolin; CRO, ceftriaxone; CAZ, ceftazidime; FEP, cefepime; ATM, aztreonam; ETP, ertapenem; MEM, meropenem; CIP, ciprofloxacin; LEVO, levofloxacin; MIN, minocycline; TET, tetracycline; TGC, tigecycline; T/S, trimethoprim/sulfamethoxazole; FOS, fosfomycin; NIT, nitrofurantoin; POLY, colistin or polymyxin B; AMK, amikacin; GEN, gentamicin; TOB, tobramycin; --, no data; NR, not reported.
a Reported as percent susceptible for Chicagoland/SENTRY.
b Signifies >10% increased susceptibility in Chicagoland compared to US SENTRY.
c Signifies >10% decreased susceptibility in Chicagoland compared to US SENTRY.
d Signifies increased susceptibility in Chicagoland that crosses the 80% susceptibility threshold.
e Signifies decreased susceptibility in Chicagoland that crosses the 80% susceptibility threshold.
f <30 isolates.
Discussion
This study demonstrates the feasibility and importance of developing a regional antibiogram for one of the largest metropolitan areas in the United States. We aggregated >167,000 isolates from 51 facilities; we internally compared all available facility-specific susceptibilities across 25 clinically relevant pathogen–antibiotic combinations; and we compared data from 360 pathogen–antibiotic combinations from Chicagoland to the US SENTRY surveillance database.
Importantly, our Chicagoland antibiogram was representative of the contributing facilities given that exceedingly few fell outside 2 SDs from the mean, and the percentage of isolates contributed by any 1 facility did not impact the frequency of that facility deviating from the regional mean. This is particularly notable given that we included hospitals across the spectrum of bed size, type, and teaching status. Additionally, our 18 collaborator facilities contributed ~1.5-fold as many total isolates, as did the 33 additional hospitals included from the BD Insights cohort, suggesting that future regional antibiograms could potentially be developed more efficiently from just these facilities. Moreover, the robustness of our data allowed us to report ~3-fold more gram-positive and gram-negative species, with ≥30 isolates compared to the 18 collaborators, who either were not able to report a given species due to low isolate counts or reported it anyway, despite having <30 isolates. Finally, we observed clinically relevant disparities between our Chicagoland data and national surveillance data, both for common pathogens such as the Staphylococcus spp and gram-negative bacteria with resistant phenotypes. Together, these results support the use of our regional antibiogram over institutional or national surveillance data for facilities in the Chicagoland area who are not able to generate reliably accurate antibiograms for the isolates included within our regional antibiogram. Finally, this study provides a framework for other regions looking to formulate a geography-based antibiogram.
Other assessments of community-wide antibiograms have been published at the regional and state levels.Reference Var, Hadi and Khardori7–Reference Legenza, Barnett and Lacy10 These consistently focus on the feasibility and value of such efforts by assessing components of intraregional susceptibility variations. Var et alReference Var, Hadi and Khardori7 analyzed the regional differences in susceptibility among facilities that refer to their own tertiary-care facility, and more recently, Guarascio et alReference Guarascio, Brickett, Porter, Lee, Gorse and Covvey8 assessed susceptibility among ESKAPE pathogens in hospitals across the state of Pennsylvania. Both of these studies reemphasize the difference in antimicrobial susceptibility rates in urban and suburban regions compared to rural regions. Hostler et alReference Hostler, Moehring and Ashley9 demonstrated the value of a regional antibiogram among a group of community hospitals in North Carolina and Virginia by showing the near uniformity of susceptibility rates. Additionally, previous work from our group evaluated antimicrobial susceptibility patterns from 26 hospitals in the Chicagoland area from 1994 to 2005.Reference Quinn, Joseph and Garey11 These data demonstrated similar rates of MRSA (42.3%), ESBL K. pneumoniae (~10%), and fluoroquinolone resistant E. coli (~20%) from 2005 to our current 2017 data. Conversely, the rates of CRAB (47%) and fluoroquinolone-resistant P. aeruginosa (40%) were significantly lower and higher, respectively, in 2005. Our data add to and improve on this body of literature by including a much larger number of facilities, organisms, and pathogen–antibiotic combinations as well as comparisons to widely used reliable national surveillance data.
Efforts to slow the spread of antimicrobial resistance are multifaceted and include novel infection prevention and epidemiologic control strategies, judicious antibiotic use, and tracking data at all levels.2 Increasingly, strategies are focused on tracking patient movement and sharing that occurs among healthcare facilities via enhanced interfacility communications such as the use of electronic registries to track patients colonized or infected with an extensively drug-resistant organism (XDRO).Reference Ray, Lin, Weinstein and Trick12,Reference Lee, Bartsch and Wong13 An XDRO registry is currently available within the Chicagoland area through the Illinois Department of Public Health (www.XDRO.org), and modeling has shown that utilization of the XDRO registry may be able to reduce the spread of CRE carriage by >15%.Reference Lee, Bartsch and Hayden14 In conjunction with the XDRO registry and formal antimicrobial stewardship, the availability of a Chicagoland regional antibiogram places more information in the hands of clinicians than previously available and may allow for more informed and optimal use of antimicrobials as well as increased tracking and monitoring of antimicrobial resistance over time. Expansion of regional antibiogram efforts in Chicago would be particularly helpful for long-term care settings where resources are often limited, and the low number of isolates at each facility can restrain utility of an individual antibiogram, particularly Chicago skilled-nursing facilities. Anticipated use of the regional antibiogram may be to supplement existing facility-level antibiograms for less commonly isolated pathogens to help guide selection of empiric therapy of transfer patients for which no culture and susceptibility data are available and to inform formulary considerations and epidemiologic studies.
Despite our efforts to maximize the robustness of this analysis, our analysis has several limitations. Facility-specific demographic information was only available for the 18 collaborator facilities, whereas the BD Insights cohort data were provided anonymized and in aggregate, limiting our ability to correlate differences in susceptibilities with hospital-specific factors. Our aggregated susceptibility data relied upon each institution’s standard for antibiogram reporting; thus, we could not ensure that their methods were consistent with current CLSI guidelines, interpretive criteria, or standardized across hospitals. Additionally, we were not always able to obtain “offline” testing results such as those performed by Etest. Furthermore, susceptibilities for certain agents may have only been performed on more resistant isolates based on institution-specific rules (eg, polymyxin and/or minocycline for CRAB) and, therefore, could have skewed susceptibility results for certain pathogen-antibiotic combinations. Finally, external comparisons were performed at the time of this writing so specific isolate counts and susceptibility percentages may have changed over time as JMI Laboratories continues to update their SENTRY database.
In conclusion, this work demonstrates that developing an accurate, reliable regional antibiogram is feasible even in one of the largest metropolitan areas in the United States. These data are also invaluable in assessing susceptibilities to less commonly encountered organisms and providing a more accurate representation of local antimicrobial resistance rates compared to national surveillance databases. In the current postantibiotic era, understanding bacterial epidemiology and resistance patterns above the individual facility level is crucial to assisting in more comprehensive antimicrobial stewardship efforts. In the future, these data will be stratified by facility demographics, more discrete geographic locations, and trended over time to continue to improve the utility for clinicians and antimicrobial stewardship programs.
Supplementary material
To view supplementary material for this article, please visit https://doi.org/10.1017/ice.2020.334
Acknowledgments
We thank Kalvin Yu, MD, for his review of the manuscript.
Financial support
No financial support was provided relevant to this article.
Conflicts of interest
E.W. serves on the advisory board for GenMark Diagnostics and Shionogi and on the speaker’s bureau for Astellas Pharma and Allergan Plc. V.G. is a current employee of Becton, Dickinson and Company. All other authors declare no relevant conflicts.


