

Healthcare outcomes, including healthcare-associated infections (HAIs), are often used in quality improvement for public reporting and with the intent of comparing rates across different facilities. However, patients at one facility may be significantly different from patients at another facility and thus, risk adjustment is necessary in order to make comparisons meaningful across providers and healthcare centers. Numerous groups have outlined weaknesses with the current risk adjustment methodology for HAIs.Reference Moehring and Anderson 1 – Reference Roy, Herwaldt, Embrey, Kuhns, Wenzel and Perl 3 A major weakness in the current method is a lack of adjustment for patient-level factors.Reference Moehring and Anderson 1 – Reference Roy, Herwaldt, Embrey, Kuhns, Wenzel and Perl 3
The Centers for Disease Control and Prevention (CDC) modifies its risk adjustment methodology for surgical site infections (SSIs) on an ongoing basis. Prior methodology included adjustment for the American Society of Anesthesiologists score; the duration of surgery; and whether the procedure was clean, clean contaminated, or dirty.Reference Haley, Culver, Morgan, White, Emori and Hooton 4 Present methodology is procedure specific. For example, for renal transplantation, more recent methodology takes into account age, American Society of Anesthesiologists score, procedure duration, and size of facility.Reference Mu, Edwards, Horan, Berrios-Torres and Fridkin 5 However, for each procedure, the CDC’s updated SSI risk adjustment does not take into account patient-level comorbid conditions.
The aim of this study was to identify comorbid conditions associated with SSI and to develop risk adjustment scores from electronically available comorbidity data. We hypothesized that these scores and their components would improve upon the current CDC risk adjustment methodology. To test this hypothesis we used a data set that included a cohort of patients undergoing renal transplantation, from which the main results have been previously published.Reference Harris, Fleming and Bromberg 6
METHODS
We identified a retrospective cohort of patients (≥18 years old) who underwent renal transplantation at the University of Maryland Medical Center from January 1, 2010, through December 31, 2011. Study recruitment has been reported elsewhere.Reference Harris, Fleming and Bromberg 6 Briefly, eligible patients were identified from the transplant database of the University of Maryland Medical Center. Trained infection preventionists reviewed the inpatient and outpatient medical records of all eligible renal transplant patients to identify SSIs that had developed within 30 days of transplantation, using CDC National Healthcare Safety Network (NHSN) criteria. 7 , Reference Horan, Andrus and Dudeck 8 Patients who underwent dual transplantations were excluded from our cohort. Supplemental surveillance through medical chart review was conducted to identify additional patient demographic characteristics and risk factors for SSIs. Covariates analyzed with the outcome of SSI included age, sex, race, body mass index (calculated as weight in kilograms divided by height in meters squared), American Society of Anesthesiologists score, procedure duration (time from incision to wound closure), and discharge International Statistical Classification of Disease, Ninth Revision, Clinical Modification (ICD-9-CM) codes. Electronically available ICD-9-CM codes were used to analyze individual component comorbid conditions and calculate the Charlson (Deyo) and Elixhauser scores, 2 previously validated comorbidity scores.Reference Deyo, Cherkin and Ciol 9 , Reference Elixhauser, Steiner, Harris and Coffey 10
The most widely used measure in studies of infectious diseases is the Deyo adaptation of the Charlson comorbidity index.Reference Tacconelli, Cataldo and De Pascale 11 The Charlson consists of 17 comorbid conditions, assigned a weight of 1, 2, 3, or 6, and summed to create a total score between 0 and 33.Reference Deyo, Cherkin and Ciol 9 Originally developed to predict 1-year in-hospital mortality, the Charlson has been used to predict outcomes such as postoperative mortality and infectious disease outcomes, in a number of patient populations.Reference McGregor, Kim and Perencevich 12 , Reference Verceles, Lechner, Halpin and Scharf 13 The Elixhauser index, on the other hand, is the sum of 30 unweighted comorbid conditions in which possible scores range from 0 to 30.Reference Elixhauser, Steiner, Harris and Coffey 10 , Reference Quan, Sundararajan and Halfon 14 Though a relatively new risk adjustment method, the Elixhauser has been validated in hospital administrative dataReference Quan, Sundararajan and Halfon 14 and has a larger list of comorbid conditions than the Charlson.
Means and standard deviations or medians and interquartile ranges were generated for the continuous variables including Charlson and Elixhauser scores. The t test or Wilcoxon rank sum test was used to compare those who developed an SSI and those who did not. Frequencies and proportions were generated for the categorical variables, including individual components of Charlson and Elixhauser scores, and the χ2 test was used to compare distributions between those who developed an SSI and those who did not. Components significant at the alpha=.10 level were candidates for inclusion in the logistic regression models to predict occurrence of SSI.
Five separate logistic regression models were built as follows: (1) the “CDC NHSN model,” which is based on the variables in the current CDC NHSN SSI risk adjustment modelReference Mu, Edwards, Horan, Berrios-Torres and Fridkin 5 ; (2) the “Charlson model” using components of the Charlson Comorbidity Index; (3) the “Elixhauser model” using components of the Elixhauser Index; (4) the “Charlson/Elixhauser model” using nonoverlapping components of both Charlson and Elixhauser model; and (5) the “Charlson/Elixhauser/CDC NHSN” model using nonoverlapping components of Charlson and Elixhauser, as well as components of the NHSN model.
The CDC NHSN model for kidney transplantation (procedure code KTP) is based on age (>59 vs ≤59), American Society of Anesthesiologists score (>3 vs ≤3), and bed size (>500 vs ≤500) and codes the continuous variable procedure duration as the number of 10-minute increases in duration. Bed size was dropped from our model because these data come from a single site and thus did not vary among this patient population. For the Charlson, Elixhauser, and combined models, components from the bivariate analyses were selected if P≤.10 and were entered into the model and retained if P≤.05. All 4 models were compared with the referent CDC NHSN model.
Comparison of risk adjustment models is generally performed via both discrimination and calibration. Model discrimination refers to the ability of the model to discriminate between patients who had the event and those who did not based on the predictor variables. The c-statistic is defined by the area under the receiver operating characteristic curve, a plot of sensitivity versus “1 − specificity” for all values of the predictor variable. Discrimination was assessed by calculating the c-statistic and associated 95% confidence interval to test the equality of the model’s c-statistics for each model. A c-statistic of 0.50 is no better than random chance, whereas 1.0 is perfect discrimination. Calibration of the models, or how well the predicted risk correlates to the observed risk, was assessed with the Hosmer-Lemeshow goodness of fit statistic. This statistic divides the sample into 10 deciles of increasing risk to compare the number of observed events with the number of events predicted by the model. Thus a smaller value between observed and expected is desired. Therefore, a model with good fit would have a low Hosmer-Lemeshow χ2 statistic and a nonsignificant P value (>.05).Reference Merkow, Hall and Cohen 15 All analyses were performed using SAS, version 9.4 (SAS Institute).
RESULTS
This cohort consisted of 441 adult patients who underwent renal transplantation. Patient characteristics are presented in Table 1. Of the 441 patients, 66 (15%) developed an SSI. Among the 66 SSIs, 31 (47%) were superficial-incisional and 35 (53%) were deep-incisional or organ-space SSIs. There was no difference between those who developed an SSI and those who did not with respect to age, sex, or race. Body mass index was significantly higher in those who developed an SSI than those who did not. The median (interquartile range) Charlson score was 3.0 (2), and the mean (SD) Elixhauser score was 4.0 (2). These scores did not differ significantly between the outcome groups.
TABLE 1 Patient Characteristics in Study of Improving Risk Adjustment Methodology

NOTE. ASA, American Society of Anesthesiologists; BMI, body mass index (calculated as weight in kilograms divided by height in meters squared); IQR, interquartile range; SSI, surgical site infection.
a χ2 test.
b Wilcoxon rank sum test.
TABLE 2 Comparison of Charlson and Elixhauser Component Conditions in 66 SSI Positive and 375 SSI Negative Patients in Study of Improving Risk Adjustment Methodology
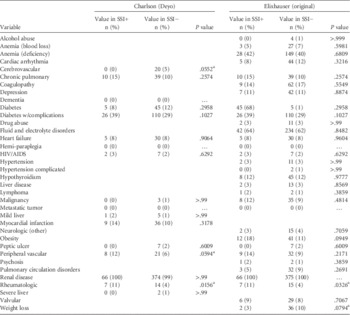
NOTE. HIV, human immunodeficiency virus.
a Significant at the P=.10 level.
In the bivariate analysis (Table 2), the Charlson components of cerebrovascular disease, peripheral vascular disease, and rheumatologic disorders and Elixhauser components of obesity, rheumatoid arthritis, and weight loss were significantly associated with the outcome. Owing to sparse cell counts, cerebrovascular disease was dropped from the final Charlson model whereas all 3 Elixhauser components were significant and retained in the final Elixhauser model. The final combined model of nonoverlapping Charlson and Elixhauser components included obesity, peripheral vascular disease, rheumatologic disorders, and weight loss.
Table 3 presents the calibration and discrimination results, and Figure 1 shows the receiver operating characteristic curves for the CDC NHSN model and the full model. For the current CDC NHSN model, the c-statistic was 0.56 (95% CI, 0.48–0.63). For the Charlson model the c-statistic was 0.56 (0.51–0.61). The c-statistic was 0.59 (95% CI, 0.53–0.65) for the Elixhauser model and compared with the NHSN model there was no difference in discrimination between the 2 models. For the combined model that included nonoverlapping Charlson/Elixhauser components, the c-statistic was 0.63 (95% CI, 0.56–0.69). This model was not different from the NHSN model. The Charlson/Elixhauser/CDC NHSN model had a c-statistic of 0.65 (95% CI, 0.58–0.73), which does represent a statistically significant difference in discrimination compared with the NHSN model. The Hosmer-Lemeshow χ2 test indicated that all the models had good calibration as demonstrated by nonsignificant P values (see Table 3).
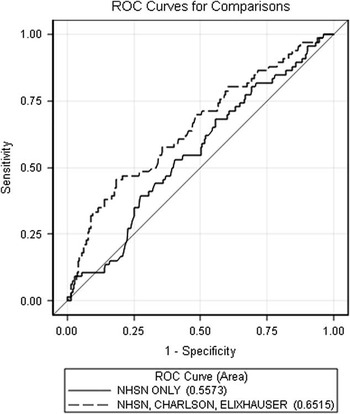
FIGURE 1 The receiver operating characteristic (ROC) curves for the Centers for Disease Control and Prevention National Healthcare Safety Network (NHSN) model and the full model.
TABLE 3 Comparison of Discrimination Abilities and Calibration Between NHSN, Charlson, Elixhauser, and Combined Models in Study of Improving Risk Adjustment Methodology
NOTE. CDC, Centers for Disease Control and Prevention; N/A, not applicable; NHSN, National Healthcare Safety Network.
a A nonsignificant P value indicates good model fit.
DISCUSSION
We found that the addition of comorbid conditions obtained from ICD-9-CM codes improved the current CDC NHSN SSI risk adjustment model among a cohort of patients undergoing renal transplantation. Further, the current CDC NHSN SSI model had little ability to discriminate between patients with an SSI and those without following renal transplantation based on a c-statistic of 0.56. In fact, since the confidence interval for the c-statistic included 0.50, the data are consistent with the possibility that the NHSN score performs no better than random chance in this setting. The models that included the Elixhauser comorbid components alone and the combination Charlson/Elixhauser indices had better discrimination than the NHSN model (as indicated by a higher c-statistic). The model that included all 3 risk adjustment scores performed the best and was statistically different from the CDC NHSN model alone as demonstrated by improvement in the c-statistic (0.65 compared with the CDC model of 0.56).
The improved performance of the Charlson/Elixhauser/CDC NHSN model may be because the CDC’s updated SSI risk adjustment for renal transplantation does not take into account patient-level comorbid conditions. Numerous studies have shown that comorbid conditions such as obesity and diabetes have been shown to increase risk for SSI.Reference Yokoe, Anderson and Berenholtz 16 – Reference Sivrikoz, Karamanos, Beale, Teixeira, Inaba and Demetriades 18 Because the Elixhauser Index includes additional comorbidities such as obesity, this score may have greater predictive ability than the either the NHSN or the Charlson models and allows the exploration of additional comorbid conditions.Reference Southern, Quan and Ghali 19 , Reference Menendez, Neuhaus, van Dijk and Ring 20
A common criticism of using ICD-9 codes in risk adjustment measures is that these codes represent patient comorbidities recorded at discharge. Often the condition under study, such as a HAI, occurs during the hospital stay. Because comorbid conditions are measured after the HAI has occurred, they may not be able to serve as predictors of the outcome. However, in our sample, more than 80% of SSIs developed after the patient was discharged from the hospital. Further, the conditions we found to be associated with SSI, such as obesity, peripheral vascular disease, and rheumatologic disorders, were likely preoperative conditions. Therefore, comorbid conditions recorded at discharge can be used as valid predictors of SSI.
The comorbid condition variables found to be statistically significant have biologic plausibility of being risk factors for SSI and have been demonstrated as risk factors in other studies. For example, previous studies have identified obesity as a risk factor for the development of SSI.Reference Huttunen and Syrjanen 21 , Reference Menezes, Wey, Peres, Medina-Pestana and Camargo 22 As well, patients with peripheral vascular disease likely have altered blood flow that could increase the risk of SSI.Reference Dryden, Baguneid and Eckmann 23 Many patients with rheumatoid arthritis receive medications that affect the immune system and may place patients at higher infection risk.
The major limitations of our study are that it is a single-site study and it addresses a single surgical procedure. Further, the SSI rate for deep incisional of 7.9% found in our analysis is higher than the CDC NHSN estimate of 3.8% to 6.6% for patients undergoing renal transplantation between 2006 and 2008; therefore, the generalizability of our results may be limited.Reference Edwards, Peterson and Mu 24 Another limitation is that our c-statistics are low (close to 0.50) owing to similar patient case-mix. Patients who undergo renal transplantation often have similar comorbid conditions that lead them to a transplant. Even with this limitation, Merkow et alReference Merkow, Hall and Cohen 15 has demonstrated that the c-statistic is still a valid measure of discrimination in small sample sizes of homogenous patient populations. Though low c-statistics do not necessarily mean inferior risk adjustment, we also looked at calibration to assess model performance. However, we recommend that these indices be validated in samples with a more varied patient case-mix, different surgical procedures, and larger number of outcomes, and for different HAI outcomes, to assess their predictive utility across HAIs.
Future research and healthcare policy in risk adjustment should start incorporating comorbid conditions. As hospitals move from ICD-9 to ICD-10 and as electronic health records become more readily available, there are unique research opportunities and improvements in risk adjustment that can be explored and implemented.
ACKNOWLEDGMENTS
Financial support. The Agency for Healthcare Research and Quality (grant R01 HS 022291); the National Institute for Allergy and Infectious Diseases (grant K24AI079040 to A.D.H.).
Potential conflicts of interest. All authors report no conflicts of interest relevant to this article.


