


Introduction
Dementia with Lewy bodies (DLB) and Alzheimer's disease (AD) are common forms of dementia, yet distinguishing DLB from AD continues to be difficult because of overlapping of clinical and neuropathological features (McKeith et al., Reference McKeith, Fairbairn, Perry and Thompson1994; Galasko, Reference Galasko2001). Techniques that can improve our understanding of their etiology are therefore of great importance. Structural magnetic resonance imaging (MRI) has been widely used to investigate patterns of gray matter (GM) atrophy in AD but to a lesser extent in DLB. Compared with controls, AD demonstrates a pattern of cortical atrophy with particular gray matter loss of the medial temporal lobe structures and the temporoparietal association cortices (Burton et al., Reference Burton2002; Karas et al., Reference Karas2003; Whitwell et al., Reference Whitwell2007; Takahashi et al., Reference Takahashi2010; Watson et al., Reference Watson, O’Brien, Barber and Blamire2012b). In DLB, there is some degree of overlap with the AD pattern, but atrophy is less diffused with relative preservation of the medial temporal lobe structures (Burton et al., Reference Burton2002; Karas et al., Reference Karas2003; Whitwell et al., Reference Whitwell2007; Takahashi et al., Reference Takahashi2010), and there is some evidence for greater subcortical involvement (Cousins et al., Reference Cousins, Burton, Burn, Gholkar, McKeith and O’Brien2003; Hanyu et al., Reference Hanyu, Shimizu, Tanaka, Hirao, Iwamoto and Abe2007; Whitwell et al., Reference Whitwell2007) in keeping with the neuropathological changes (McKeith et al., Reference McKeith2005).
We investigated limbic and subcortical brain volumes in DLB, AD, and healthy older individuals using 3 T MR imaging data and the automated segmentation tool FreeSurfer (https://surfer.nmr.mgh.harvard.edu/; Fischl et al., Reference Fischl2002). We hypothesized that relative to healthy aging, atrophy of the subcortical brain structures would be greater in DLB than in AD.
Methods
Participants, assessments, and diagnosis
Sixty-five individuals over the age of 60 years (32 patients with probable AD (McKhann et al., Reference McKhann, Drachman, Folstein, Katzman, Price and Stadlan1984) and 33 with probable DLB (McKeith et al., Reference McKeith2005)) were recruited from a community dwelling population of patients referred to local old age psychiatry, geriatric medicine, or neurology services. All patients underwent clinical and neuropsychological evaluations as previously described (Watson et al., Reference Watson, O’Brien, Barber and Blamire2012b). Thirty-five similarly aged control participants were also recruited from relatives and friends of patients with dementia or volunteered via advertisements in local community newsletters. The research was approved by the local ethics committee. All participants or, where appropriate, their nearest relative, provided written informed consent. Assessment of global cognitive measures included the Cambridge Cognitive Examination (CAMCOG) incorporating the Mini-Mental State Examination (MMSE; Folstein et al., Reference Folstein, Folstein and McHugh1975). Motor parkinsonism was assessed with the Unified Parkinson's Disease Rating Scale, Part III (UPDRS III; Fahn et al., Reference Fahn, Elton, Marsden, Goldstein, Fahn, Marsden, Calne and Goldstein1987).
MRI data acquisition
Patients underwent T1 weighted MR scanning on a 3T MRI system using an 8-channel head coil (Intera Achieva Scanner, Philips Medical Systems, Eindhoven, the Netherlands) within two months of the study assessment, as previously described (Watson et al., Reference Watson, O’Brien, Barber and Blamire2012b). The sequence was a standard T1 weighted volumetric sequence covering the whole brain (3D MPRAGE, sagittal acquisition, 1-mm isotropic resolution and matrix size of 240 (anterior-posterior) × 240 (superior-inferior) × 180 (right-left); repetition time (TR) = 9.6 ms; echo time (TE) = 4.6 ms; flip angle = 8o; SENSE factor = 2). The acquired volume was angulated such that the axial slice orientation was standardized to align with the anterior commissure–posterior commissure line.
FreeSurfer
Estimates of subcortical brain volumes were performed from subcortical segmentations calculated from T1 images using FreeSurfer (v.5.1.0, http://surfer.nmr.mgh.harvard.edu/). The technical aspects have been described elsewhere (Dale et al., Reference Dale, Fischl and Sereno1999; Fischl et al., Reference Fischl, Sereno and Dale1999; Fischl and Dale, Reference Fischl and Dale2000). In brief, the processing stream involved intensity non-uniformity correction, Talairach registration, removal of non-brain tissue (skull stripping), segmentation of white matter (WM) as well as limbic and subcortical gray matter structures (comprising the amygdala, caudate, hippocampus, pallidum, putamen, thalamus, and brainstem; Fischl et al., Reference Fischl2002). Visual inspection of images at each step of the FreeSurfer processing stream was carefully carried out by a single operator (Sean J. Colloby) to check the accuracy of segmentations. Any images with segmentation errors that could not be corrected were excluded. Figure 1 depicts the subcortical and selective limbic segmentations of a representative patient in the anterior, posterior, and lateral views by FreeSurfer. FreeSurfer global brain measures were also estimated, including total intracranial volume (TIV) and total subcortical gray matter (containing the thalamus, caudate, hippocampus, amygdala, accumbens, ventral diencephalon, substantia nigra, and brainstem).
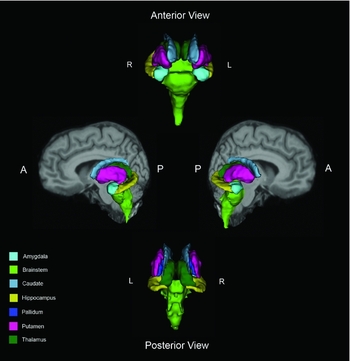
Figure 1. Subcortical and selective limbic FreeSurfer segmentations of a representative participant in the anterior, posterior, and lateral views displayed with their brain T1 MRI for anatomical reference (R = right, L = left, A = anterior, P = posterior).
Statistical analysis
For demographic, clinical, and volumetric data, the Statistical Package for Social Sciences software (SPSS version 22.0.0.1, http://www-01.ibm.com/software/analytics/spss/) was used for statistical evaluation. Continuous variables were examined for normality using the Shapiro–Wilk test and visual inspection of their histograms. Demographic and clinical data were assessed where appropriate using parametric (ANOVA, t-tests) and non-parametric tests (Kruskall–Wallis H, and Mann–Whitney U). For categorical measures, χ 2 tests were applied. Subcortical volume estimates were expressed as percentage values of their total intracranial volumes. Group differences on the normalized subcortical volume measures were conducted using multivariate analysis of covariance (MANCOVA), with age and gender as nuisance covariates, followed by univariate post hoc tests on the adjusted data. Where appropriate, correlations were performed using either Pearson's r or Spearman's ρ coefficients. A p-value of ≤0.05 was considered significant.
Results
Participants
Table 1 presents demographic and clinical characteristics. Age was comparable across groups but there were relatively more men in the DLB group than in the AD and older healthy cohorts. CAMCOG and MMSE were similar between AD and DLB but significantly differed from healthy older individuals. As expected, UPDRS III scores were greater in DLB compared with AD and controls.
Table 1. Demographic and group characteristics
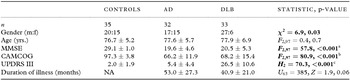
Notes: Values expressed as mean score ± 1 SD.
Bold text denotes statistical significance.
MMSE = Mini-Mental State Examination, CAMCOG = Cambridge Cognitive Examination, UPDRS III = Unified Parkinson's Disease Rating Scale (Section III), NA = not applicable.
Post hoc tests:
aControls (Con) > AD, DLB (p < 0.001), DLB > AD (p = 0.73) (Gabriel’s).
bCon > AD, DLB (p < 0.001), DLB > AD (p = 0.86) (Gabriel’s).
cDLB > Con, AD (p < 0.001), AD > Con (p = 0.03) (Mann–Whitney U).
Subcortical volumes
A statistically significant multivariate group effect was observed among the estimated normalized subcortical brain volumes (F 28162 = 4.8, p < 0.001; Wilk's Λ = 0.30, partial η 2 = 0.45). Subsequent univariate tests revealed that significant group differences occurred in all normalized volumetric measures (p < 0.03) apart from right caudate (p = 0.08). The normalized volumes (expressed as percentage of their TIV, adjusted for age and gender) in healthy participants, AD, and DLB are summarized in Table 2. Post hoc analysis showed that compared with healthy participants, decreased volumes in AD and DLB were observed bilaterally in the thalamus, putamen, pallidum, hippocampus, and amygdala as well as for total subcortical gray matter (p ≤ 0.014). In spite of not being significantly different, volumetric loss in the bilateral putamen, left thalamus, and total subcortical gray measures appeared more pronounced in DLB than in AD. Interestingly, relative to controls, significantly reduced volumes in the left caudate and brainstem were seen only in DLB (p ≤ 0.04) and not in AD (p ≥ 0.10). Significant differences between DLB and AD were confined to the bilateral hippocampus (DLB > AD, p ≤ 0.008). Figure 2 shows boxplots of the normalized brain volumes as a function of group for the subcortical, limbic, and global brain measures in left (blue) and right (green) hemispheres.
Table 2. Normalized FreeSurfer segmentations (expressed as percentage of TIV, age, and gender-adjusted) in controls, AD, and DLB
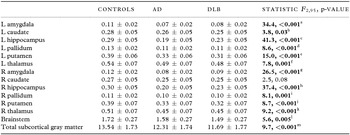
Notes: Values are expressed as mean score ± 1 SD.
Bold text denotes statistical significance.
Post hoc tests (Bonferroni):
aControls (Con) > AD, DLB (p < 0.001), DLB > AD (p = 0.12).
bCon > AD (p = 0.10), Con > DLB (p = 0.03), AD > DLB (p = 0.51).
cCon > AD, DLB (p < 0.001), DLB > AD (p = 0.007).
dCon > AD (p < 0.001), Con > DLB (p = 0.004), DLB > AD (p = 0.96).
eCon > AD, DLB (p < 0.001), AD > DLB (p = 0.51).
fCon > AD (p = 0.009), Con > DLB (p = 0.001), AD > DLB (p = 0.90).
gCon > AD, DLB (p < 0.001), DLB > AD (p = 0.28).
hCon > AD, DLB (p < 0.001), DLB > AD (p = 0.008).
iCon > AD (p = 0.002), Con > DLB (p = 0.004), DLB > AD (p = 0.99).
jCon > AD (p = 0.003), Con > DLB (p = 0.001), AD > DLB (p = 0.96).
kCon > AD (p = 0.001), Con > DLB (p = 0.002), DLB > AD (p = 1.0).
lCon > AD (p = 0.14), Con > DLB (p = 0.004), AD > DLB (p = 0.48).
mCon > AD (p = 0.014), Con > DLB (p<0.001), DLB > AD (p = 41).
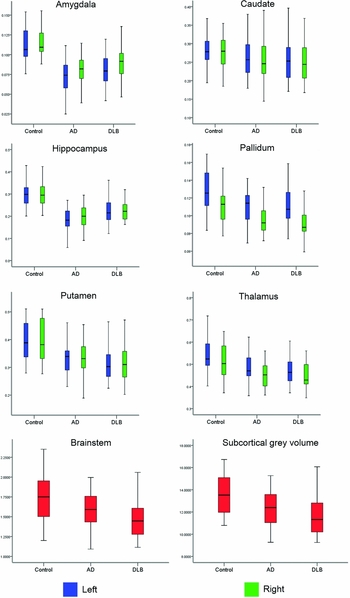
Figure 2. Boxplots of normalized volumes as a function of group for subcortical, limbic, and global brain measures in the left (blue) and right (green) hemispheres.
Subcortical volume correlates
Relationship between normalized subcortical volume measures and age, MMSE, CAMCOG, and UPDRS III were separately investigated in AD and DLB. After the Bonferroni correction for multiple tests, no significant correlations were observed among these variables in AD (r ≤ |0.28|, pcorrected ≥ 0.24) or DLB (r ≤ |0.36|, pcorrected ≥ 0.08).
Discussion
This study compared the volumes of selected limbic and subcortical brain structures estimated from FreeSurfer in AD, DLB, and healthy older individuals. For adjusted (age and gender) normalized values, volumetric loss relative to controls was more pronounced in DLB than in AD for bilateral putamen, left thalamus and total subcortical gray measures, whereas in the left caudate and brainstem, significantly smaller volumes were observed only in DLB. In the left pallidum, right thalamus, and bilateral amygdala and hippocampus, although reduced in both conditions, volumes were more prominent in AD than DLB when compared with controls. Significant differences between AD and DLB were confined to the bilateral hippocampus (DLB > AD). By contrast, previous studies assessing regional cortical atrophy using MRI have consistently reported greater atrophy in AD than in DLB, consistent with the notion of DLB being a disease of neuronal synaptic dysfunction rather than loss. The fact that there is a suggestion of greater change in subcortical structures in DLB highlights the potential importance in better understanding the clinical DLB syndrome. It also provides a signal for future work in developing biomarkers to better separate the conditions clinically.
Thalamic volumes were reduced in both AD and DLB relative to healthy older individuals, and left-sided differences appeared to be greater in DLB than in AD. The thalamus is an essential deep brain structure with many sensory, motor, and cognitive functions (Basso et al., Reference Basso, Uhlrich and Bickford2005), and is an area vulnerable to Lewy-related pathology (Braak et al., Reference Braak, Tredici, Rub, de Vos, Jansen Steur and Braak2003). Thalamic volume and shape changes have been reported in AD (Karas et al., Reference Karas2003; de Jong et al., Reference de Jong2008; Zarei et al., Reference Zarei2010; Pedro et al., Reference Pedro2012; Stepan-Buksakowska et al., Reference Stepan-Buksakowska2014), while thalamic diffusion and perfusion deficits have been shown to be associated with DLB (Chang et al., Reference Chang, Liu, Chang, Chang, Chen and Lee2008; Shimizu et al., Reference Shimizu, Hanyu, Hirao, Sato, Iwamoto and Koizumi2008; Watson et al., Reference Watson2012a). Our results suggest changes in AD and DLB and highlight the potential importance of its neurobiological and clinical role in DLB, which warrants further evaluation.
For most structures within the corpus striatum (caudate, putamen, and pallidum), volumetric loss relative to controls was more affected in DLB than in AD. Furthermore, caudate volumes did not differ between AD and controls. Previous studies have shown varying results for the presence of striatal atrophy in AD, i.e., decreased caudate (Barber et al., Reference Barber, McKeith, Ballard and O’Brien2002; Almeida et al., Reference Almeida, Burton, McKeith, Gholkar, Burn and O’Brien2003; Karas et al., Reference Karas2003) and putamen (de Jong et al., Reference de Jong2008) volumes, while in contrast, preservation of caudate (de Jong et al., Reference de Jong2008) and putamen (Cousins et al., Reference Cousins, Burton, Burn, Gholkar, McKeith and O’Brien2003) has also been reported. Previous studies are generally in agreement with our results, with smaller volumes being identified in the left caudate (Barber et al., Reference Barber, McKeith, Ballard and O’Brien2002), and others demonstrating greater putamen atrophy in DLB compared with AD and controls (Cousins et al., Reference Cousins, Burton, Burn, Gholkar, McKeith and O’Brien2003). Nigrostriatal dysfunction is well recognized in DLB and not in AD (Piggott et al., Reference Piggott1999). This may, in part, explain the localized volume loss, which is in contrast to the cortical structural change, which is far more extensive in AD.
For the limbic structures, amygdala and hippocampus, reduced volumes were observed bilaterally in both AD and DLB compared with controls, with AD being much more affected than DLB. As expected, hippocampal volumes significantly differentiated our AD and DLB groups, with AD showing much greater loss than DLB. Numerous studies have demonstrated large volumetric changes in the hippocampus in AD (Barber et al., Reference Barber, Ballard, McKeith, Gholkar and O’Brien2000; Burton et al., Reference Burton, McKeith, Burn, Williams and O’ Brien2004; de Jong et al., Reference de Jong2008; Cho et al., Reference Cho2013; Stepan-Buksakowska et al., Reference Stepan-Buksakowska2014), and similarly for the amygdala (Barber et al., Reference Barber, Ballard, McKeith, Gholkar and O’Brien2000; Burton et al., Reference Burton, McKeith, Burn, Williams and O’ Brien2004; Cho et al., Reference Cho2013), but with one study revealing no such differences in this structure between AD and controls (de Jong et al., Reference de Jong2008). In agreement with our results, earlier reports also demonstrated that hippocampal atrophy distinguished AD and DLB (Barber et al., Reference Barber, Ballard, McKeith, Gholkar and O’Brien2000; Burton et al., Reference Burton, McKeith, Burn, Williams and O’ Brien2004; Watson et al., Reference Watson, O’Brien, Barber and Blamire2012b).
Compared with controls, brainstem volume was significantly reduced in DLB but not in AD. It is well understood that the brainstem is a major site of Lewy body pathology (Braak et al., Reference Braak, Tredici, Rub, de Vos, Jansen Steur and Braak2003). In a recent study investigating brainstem pathology, Seidel and colleagues (Reference Seidel2015) revealed the presence of marked to severe neuronal loss in the ventral tegmental (midbrain), pedunculopontine nucleus, and locus coeruleus (pons) regions in DLB. Therefore, evidence of brainstem atrophy in DLB is of potential interest in this condition and again warrants further assessment.
For the global subcortical gray volume measure, both AD and DLB significantly differed from controls but appeared to be more marked in DLB than in AD. Other studies have suggested greater involvement of specific deep brain structures in DLB relative to AD (Hanyu et al., Reference Hanyu, Shimizu, Tanaka, Hirao, Iwamoto and Abe2007; Whitwell et al., Reference Whitwell2007). In a study of subcortical structures in 179 AD patients at various stages of the illness, hippocampal and amygdala volume loss was found to occur at the very mild phase followed by thalamic and putamen as the disease progresses, with pallidum and caudate contributions only at the moderate stages of AD (Roh et al., Reference Roh2011), implying that there may be a hierarchical vulnerability of these structures according to clinical severity in AD. In DLB, there may be a more rapid process occurring much earlier in the disease course; however, recent longitudinal assessments in our cohort revealed that in DLB, whole brain and subcortical rates of atrophy did not exceed that of controls (Mak et al., Reference Mak2015a, Reference Mak2015b). It is therefore possible that subcortical structural change may be an early disease marker in DLB. An important consideration, however, is that only 13/35 DLB patients returned for a repeat MRI, so this may not represent the possible differing disease trajectories often reported in this condition.
Strengths of the current study include: moderately large AD, DLB, and control cohorts as well as 3 T MRI data. However, lack of significant differences between AD and DLB could be low statistical power due to disease heterogeneity that is often attributed to DLB. There is also difficulty when comparing two distinct neurodegenerative diseases in terms of atrophy in that the two pathologies do not necessarily evolve at the same rate, and results depend upon when the MRI acquisition was conducted in the neurodegenerative process continuum. Another potential drawback of our study could be in utilizing FreeSurfer for estimation of limbic and subcortical volumes. However, we could not detect any significant mismatches in the segmentation of these structures performed by the algorithm. In addition, the method of automated volumetry has clear advantages compared with voxel-based morphometry (VBM) and manual segmentation. VBM has value in comparing patterns of atrophy across groups but can be prone to registration artefacts in deep gray structures and is not suitable for analysis in an individual patient. FreeSurfer can be used to measure volumes of different regions in individual patient and provides a metric of the actual amount of atrophy that occurs, and can be used as a marker for disease progression. Comparing FreeSurfer with manual segmentation, a previous study in seven healthy adults showed a high degree of concordance with all subcortical measures (Fischl et al., Reference Fischl2002), and has the advantage that its segmentation is based on voxel intensities, while manual segmentation relies on contrast differences, which can be difficult to detect visually. In dementia, a comparison study between FreeSurfer and manual tracing was limited to the hippocampus, where average volume differences of 10.5% were recorded in mild cognitive impairment (MCI) and AD patients (Sanchez-Benavides et al., Reference Sanchez-Benavides, Gomez-Anson, Sainz, Vives, Delfino and Pena-Casanova2010). Using FreeSurfer, a small number of scans can potentially be excluded due to segmentation errors/failures of the automated process mainly as a result of movement artefacts. In the present study, six patients (four AD patients and two DLB patients; 6% of the study cohort) were excluded on this basis. This rate is relatively small; however, with superior datasets and segmentation algorithms, exclusions can be kept to a minimum.
In conclusion, for similar levels of dementia severity and although not significantly different, atrophy in the left caudate, bilateral putamen, left thalamus, and brainstem appeared more marked in DLB than in AD. Further investigation of subcortical brain structures in DLB is required to fully understand their neurobiological role in this disease.
Conflict of interest
Drs R. Watson and S. Colloby and Professor A. Blamire report no disclosures. Professor J. O’Brien has been a consultant for GE Healthcare, Lilly, Bayer Healthcare, TauRx, and Nutricia and has received honoraria for talks from GE Healthcare, Lilly, and Novartis.
Description of authors’ roles
R. Watson co-designed the study, interpreted the results, and co-wrote the manuscript. S. Colloby co-designed the study, carried out the image and data analyses, and co-wrote the manuscript. A. Blamire reviewed the manuscript and secured funding for the project. J. O’Brien reviewed the manuscript and secured funding for the project.
Acknowledgments
The study was funded by the Sir Jules Thorn Charitable Trust (Grant ref.: 05/JTA) and supported by the National Institute for Health Research (NIHR) Newcastle Biomedical Research Centre in Ageing and Chronic Disease and Biomedical Research Unit in Lewy Body Dementia based at Newcastle upon Tyne Hospitals NHS Foundation Trust and Newcastle University. John O’Brien is supported by the NIHR Biomedical Research Unit in Dementia and Biomedical Research Centre awarded to Cambridge University Hospitals NHS Foundation Trust and the University of Cambridge.


