

INTRODUCTION
To communicate with spoken language, children must detect, discriminate, and identify the speech sounds of their language (phonemes). Children learn phonemes mainly by hearing and overhearing speech (e.g. Menn & Stoel-Gammon, Reference Menn, Stoel-Gammon, Gleason and Ratner2009). However, phonological knowledge is not exclusively auditory in nature because the articulatory gestures of talkers (i.e. visual speech) also play a critical role in learning phonemes (e.g. Dodd & Campbell, Reference Dodd and Campbell1987; Lewkowicz & Hansen-Tift, Reference Lewkowicz and Hansen-Tift2012). This role is acknowledged in various developmental models, such as the one proposed by Gogate and colleagues (Gogate, Walker-Andrews & Bahrick, Reference Gogate, Walker-Andrews and Bahrick2001) which highlights the broad inter-sensory origins of early lexical acquisition; herein we focus on the model's specific claims concerning auditory-visual (AV) speech. Gogate et al., propose that infants detect the redundancies between speech sounds and their corresponding lip movements / mouth shapes, and that this allows them to more readily discriminate similar-sounding spoken words (such as pin and tin) and thus to associate each word with its appropriate referent. The importance of this link between auditory and visual speech for phonological and lexical development is supported by the finding of delayed/different phonology and early expressive language skills in individuals with early-onset blindness (e.g. McConachie & Moore Reference McConachie and Moore1994; Mills Reference Mills, Dodd and Campbell1987) and by research that demonstrates a significant association between looking-time patterns to AV speech – to the eyes versus mouth – at 6 to 9 months, and auditory speech comprehension at 14 to 16 months (Kushnerenko et al., Reference Kushnerenko, Tomalski, Ballieux, Potton, Birtles, Frostick and Moore2013).
Phoneme discrimination and identification
Phoneme perception in children is typically assessed via tasks that require either phoneme discrimination (children need to recognize whether two utterances differ from each other) or phoneme identification (children need to discriminate the phonemes, access phonological knowledge to derive a phonological pattern, and hold the pattern briefly in memory in order to plan and execute a response; Edwards & Lahey, Reference Edwards and Lahey1998). Developmental models propose that these different levels of phoneme perception are at least to some extent hierarchical and that children must detect and discriminate phonemes before they can identify and label them (Aslin & Smith, Reference Aslin and Smith1988; Carney, Reference Carney, Bess, Gravel and Tharpe1996). Mastery of these different levels of perceptual analysis is important because deficits at any level can produce language and education difficulties (e.g. Briscoe, Bishop & Norbury, Reference Briscoe, Bishop and Norbury2001; Hornickel, Skoe, Nicol, Zecker & Kraus, Reference Hornickel, Skoe, Nicol, Zecker and Kraus2009; Jerger, Martin & Jerger, Reference Jerger, Martin and Jerger1987).
Phoneme discrimination has typically been studied with closed-set tests (i.e. restricted response alternatives) that, for example, require children to judge whether two utterances are the same or different (e.g. /bi/:/bi/ vs. /bi/:/di/). In contrast, phoneme identification has typically been studied with open-set tests such as repetition (i.e. unrestricted response alternatives) that, for example, require children to discriminate the sounds in an utterance, access phonological knowledge to abstract/label/group the sounds, and remember this phonological pattern briefly in order to formulate and output a response. Although the assessment of discrimination and identification with different paradigms is widespread, some might argue that identification should also be assessed with a closed-set task in order to minimize the potential effects of different task demands on performance. A problem with this alternative is that the perceptual processes used to identify utterances can differ between closed- vs. open-set tasks (Clopper, Pisoni & Tierney, Reference Clopper, Pisoni and Tierney2006; Sommers, Kirk & Pisoni, Reference Sommers, Kirk and Pisoni1997). In particular, performance in closed-set tasks can often be accomplished with comparative matching strategies, in which case performance does not reflect phoneme identification in real life (Clopper et al., Reference Clopper, Pisoni and Tierney2006).
Visual speech and phoneme discrimination/identification
Visual speech benefits phoneme discrimination in individuals ranging in age from infancy (e.g. Teinonen, Aslin, Alku & Csibra, Reference Teinonen, Aslin, Alku and Csibra2008) to adulthood (e.g. Files, Tjan, Jiang & Bernstein, Reference Files, Tjan, Jiang and Bernstein2015). In children, visual speech improves the discrimination of phoneme pairs that form a feature contrast (e.g. /vi/ vs. /zi/, a contrast for the place feature; Hnath-Chisolm, Laipply & Boothroyd, Reference Hnath-Chisolm, Laipply and Boothroyd1998). Visual speech also helps children discriminate visually salient phoneme contrasts (e.g. /bα/ vs. /gα/; Lalonde & Holt, Reference Lalonde and Holt2015) as well as detect vowels in words and nonwords (e.g. monitor for /o/ as in bateau or lato; Fort, Spinelli, Savariaux & Kandel, Reference Fort, Spinelli, Savariaux and Kandel2012; but see Boothroyd, Eisenberg & Martinez, Reference Boothroyd, Eisenberg and Martinez2010, for exception). With regard to age, developmental improvements arising from visual speech have been observed for syllables/nonwords up to about seven years of age by Hnath-Chisolm et al. (Reference Hnath-Chisolm, Laipply and Boothroyd1998) but up to ten years by Fort et al. (Reference Fort, Spinelli, Savariaux and Kandel2012).
Visual speech benefits phoneme identification in adults (e.g. Calvert, Spence & Stein, Reference Calvert, Spence and Stein2004) and influences speech perception in infants (Burnham & Dodd, Reference Burnham and Dodd2004; Rosenblum, Schmuckler & Johnson, Reference Rosenblum, Schmuckler and Johnson1997), but visual speech may have less of an effect on speech perception in children. Much of the evidence for this reduced effect comes from McGurk stimuli in which an auditory utterance (/bʌ/) is presented in synchrony with a mismatched visual utterance (/gʌ/) to listeners who commonly perceive a third sound (e.g. /dʌ or ðʌ /, a combination of the two utterances; Calvert et al., 2004). In their pioneering work with stimuli of this kind, McGurk and MacDonald (Reference McGurk and MacDonald1976) noted that fewer children than adults showed such an influence of visual speech on perception. Specifically, 40% to 60% of children but only 10% of adults reported hearing /bʌ/ (i.e. auditory capture). This pattern of results (i.e. less influence of visual speech in children) has been replicated and extended to other tasks (e.g. Desjardins, Rogers & Werker, Reference Desjardins, Rogers and Werker1997; Dupont, Aubin & Menard, Reference Dupont, Aubin and Menard2005; Erdener & Burnham, Reference Erdener and Burnham2013; Massaro, Thompson, Barron & Laren, Reference Massaro, Thompson, Barron and Laren1986; Ross, Molholm, Blanco, Gomez-Ramirez, Saint-Amour & Foxe, Reference Ross, Molholm, Blanco, Gomez-Ramirez, Saint-Amour and Foxe2011; Tremblay, Champoux, Voss, Bacon, Lepore & Theoret, Reference Tremblay, Champoux, Voss, Bacon, Lepore and Theoret2007). Regarding age, children do not achieve adult-like benefit from visual speech until the preteen–teenage years. Age-related changes in children might be attributed to experience in producing speech, child–adult differences in the perceptual weight given to visual speech cues, and advances in speechreading and/or linguistic skills (e.g. Desjardins et al., Reference Desjardins, Rogers and Werker1997; Massaro et al., Reference Massaro, Thompson, Barron and Laren1986). However, this developmental trajectory might, to some extent, also arise as a consequence of non-optimal tasks. When task/stimulus demands are modified to be more appropriate for young children, benefits from visual speech can be observed in three- to five-year-olds (Holt, Kirk & Hay-McCutcheon, Reference Holt, Kirk and Hay-McCutcheon2011; Lalonde & Holt, Reference Lalonde and Holt2015) and at all ages from four to fourteen years for at least some conditions (Jerger, Damian, Tye-Murray & Abdi, Reference Jerger, Damian, Tye-Murray and Abdi2014). The importance of task/stimulus demands is discussed subsequently.
Discrimination and identification tasks have rarely been directly compared, but in a recent study with three- to four-year-olds and adults, Lalonde and Holt (Reference Lalonde and Holt2015) assessed the impact of visual speech on an identification task (monosyllabic words were presented in noise and participants repeated each stimulus aloud) and a discrimination task (syllable strings that either changed or not, e.g. “bɑ gɑ bɑ gɑ” or “bɑ bɑ bɑ bɑ” were presented in noise and participants voted same/different). Compared to an auditory-only condition, the AV condition improved both phoneme discrimination and identification in all age groups for visually salient speech changes (e.g. “bα–gα”). In a study with six- to eight-year-olds and adults, Lalonde and Holt (Reference Lalonde and Holt2016) assessed word discrimination (two words, e.g. “bath bath” or “bath want”, were presented in noise and participants voted same or different) and word recognition (a word, e.g. “bath”, was presented in noise; then a word, e.g. “bath” or “want”, was presented in quiet; and participants voted whether the words matched). Children showed adult-like benefit from visual speech earlier for discrimination than recognition.
In summary, evidence concerning discrimination – albeit limited – indicates that children discriminate phonemes better when presented audiovisually than auditory only. Evidence concerning identification, however, is mixed and indicates that children may or may not identify phonemes better audiovisually than auditorily only. An inconsistency that may have influenced these previous results is that the test stimuli varied across studies (nonwords or words), and the discrimination and identification of phonemes can differ for nonwords and words (e.g. Bouton, Cole & Serniclaes, Reference Bouton, Cole and Serniclaes2012; Fort, Spinelli, Savariaux & Kandel, Reference Fort, Spinelli, Savariaux and Kandel2010; Rubin, Turvey & van Gelder, Reference Rubin, Turvey and van Gelder1976). The effects of visual speech on discriminating and identifying phonemes in words can also reflect lexical–semantic influences (Boothroyd, Reference Boothroyd1988). In the current study (described below), we selected nonwords for our stimuli. The study of nonwords is particularly significant in that when children encounter a new word (i.e. a nonword), they need to encode and retain this sound pattern until lexical–semantic information can be associated with it. How well children process nonwords can influence how well they learn words (e.g. Conway & Pisoni, Reference Conway and Pisoni2008; Gathercole, Reference Gathercole2006).
The current study
Below we report a study in which we explore the effect of visual speech on phoneme discrimination and identification in children from four to fourteen years. As summarized above, many previous studies reported that children younger than the preteen–teenage years show a reduced influence of visual speech. As Jerger, Damian, Tye-Murray, and Abdi (Reference Jerger, Damian, Tye-Murray and Abdi2014, Reference Jerger, Damian, Tye-Murray and Abdi2017) have pointed out, however, children from four to fourteen can benefit from visual speech when they are tested with developmentally appropriate measures and task demands along with low-fidelity auditory input that makes visual speech more relevant. These investigators also demonstrated that sensitivity to visual speech can vary in the same children as a function of stimulus/task demands. The type of stimuli used in Jerger et al.’s studies comprised the stimuli for the current research. Thus we briefly describe this new approach to assessing the benefit arising from visual speech, which yields what we call the Visual Speech Fill-In Effect (VSFE).
Our new approach assesses performance for words or nonwords with intact visual speech coupled to non-intact auditory speech (excised consonant onsets, see ‘Method’). As an example, the nonword bæz in the AV sensory mode consists of an intact consonant + rhyme in the visual track (bæz) coupled to a non-intact onset + rhyme in the auditory track (/–b/æz). Stimuli are presented in two modes: AV (just described) and auditory (static face coupled to same non-intact auditory (/–b/æz). Our question in this and previous studies was whether the intact visual speech would restore or fill in the non-intact auditory speech. If so, performance for the same auditory stimulus would differ depending upon the presence/absence of visual speech (e.g. perceiving [bæz] in the AV mode but [æz] in the auditory mode). We quantified the VSFE by the difference in performance between the AV and auditory modes. The auditory mode controls for any influence of remaining coarticulatory cues in the stimulus and any strategic effects on performance. With these extraneous sources controlled, we can identify whether the addition of visual speech affects performance.
In the study reported below, we assessed identification with an open-set (repetition) task and discrimination with a closed-set task. In the latter, we employed a long (1,400 ms) silent interval between stimuli, a manipulation that averts comparative matching strategies (e.g. Martin, Breedin & Damian, Reference Martin, Breedin and Damian1999). Hence, in both tasks, children should base their responses on encoded representations. For the discrimination task, the children judged whether two consonant–vowel (CV) syllables were the same (e.g. bʌ:bʌ) or different (e.g. bʌ:gʌ). The items of interest, however, were ‘different’ pairs that consisted of one intact vs. one non-intact onset (e.g. bʌ:/–b/ʌ). We predicted that the VSFE would result in perceiving the non-intact onset as intact, generating more ‘same’ – as opposed to ‘different’ – responses in the AV than in the auditory mode. For the identification task, the children repeated what they perceived for nonwords with intact (bæz) or non-intact (–b/æz) onsets. We predicted that the VSFE would cause children to perceive the non-intact onset as intact, generating more bæz – as opposed to æz – responses in the AV than auditory mode. Our test items started with an easy-to-speechread /b/ or a difficult-to-speechread /g/ (Tye-Murray, Reference Tye-Murray2014). We predicted that the non-intact /b/ onset would be more readily restored than the non-intact /g/ onset.
In Analysis I, the central point of interest was whether visual speech enhances both phoneme discrimination and identification by children or whether the benefit from visual speech is reduced in younger – relative to older – children on both tasks, as would be predicted from the literature. In Analysis II, we explored first whether the benefit from visual speech for phoneme discrimination (a lower perceptual level) influences the benefit from visual speech for phoneme identification (a higher perceptual level). Second, we investigated whether the visual speech benefit for phoneme discrimination is associated with children's vocabulary development. These questions were motivated by previous studies (with auditory only input) that revealed associations between phoneme discrimination and word identification / vocabulary skills. For example, phoneme discrimination by infants predicts word understanding at later ages (Tsao, Liu & Kuhl, Reference Tsao, Liu and Kuhl2004), and phoneme discrimination by toddlers is associated with receptive vocabulary skills (Lalonde & Holt, Reference Lalonde and Holt2014). Clinically, children with language disabilities that impair word learning have difficulty discriminating phonemes (e.g. Briscoe et al., Reference Briscoe, Bishop and Norbury2001), and children with learning disabilities may have phoneme discrimination and identification abnormalities in contrast to other skills (e.g. Jerger et al., Reference Jerger, Martin and Jerger1987). Finally, for adults learning a second language, phoneme discrimination training can improve phoneme identification (e.g. Rato, Reference Rato2014). To explore these issues, we investigated the relation between phoneme discrimination, identification, receptive vocabulary, and age via multiple regression analysis.
METHOD
Participants
Participants were 128 typically developing children ranging in age from 4;2 to 14;6 (M age = 8;3, SD = 2;10, 53% boys). Some children also participated in two other studies comparing non-intact words vs. nonwords (58% in Jerger et al., Reference Jerger, Damian, Tye-Murray and Abdi2014; 98% in Jerger et al., Reference Jerger, Damian, Tye-Murray and Abdi2017). In the latter study, we assessed phonological priming with the current study's nonword stimuli. In the ‘Discussion’, we will briefly note the differences and similarities between the effects of visual speech on the current study's repetition task (a direct measure) vs. our previous study's priming task (an indirect or implicit measure). The racial distribution was 87% White, 7% Asian, and 6% Black, with 10% of participants reporting Hispanic ethnicity. Hearing, vision, auditory word recognition, visual perception, articulation, and vocabulary skills were within normal limits. Children were sorted by age into four groups: four- to five-year-olds (M = 4;11, N = 34), six- to seven-year-olds (M = 7;00, N = 32), eight- to ten-year-olds (M = 9;03, N = 32), and eleven- to fourteen-year-olds (M = 12;04, N = 30), henceforth referred to as five-year-olds, seven-year-olds, nine-year-olds, and twelve-year-olds. Receptive vocabulary measures (Dunn & Dunn, Reference Dunn and Dunn2007) also served as an experimental variable in Analysis II. Receptive vocabulary standard scores were: five-year-olds (M = 120·03, SD = 9·68), seven-year-olds (M = 117·44, SD = 11·95), nine-year-olds (M = 120·47, SD = 12·77), and twelve-year-olds (M = 122·12, SD = 10·87). Finally, results in fifteen young adults were gathered but not included because performance in the twelve-year-olds and the adults did not differ.
Materials and instrumentation: stimuli
Recording. Stimuli were recorded as Quicktime movie files by an eleven-year-old boy with clearly intelligible speech. His full facial image and upper chest were recorded. The color video signal was digitized at 30 frames/s with 24-bit resolution at a 720 by 480 pixel size. The auditory signal was digitized at a 48 kHz sampling rate with 16-bit amplitude resolution. The utterances were adjusted to equivalent A-weighted root mean square sound levels (see Jerger et al., Reference Jerger, Damian, Tye-Murray and Abdi2014, 2017, for details). The items for this research consisted of:
-
A) 4 vowels (/i/, /æ/, /ʌ/, /o/)
-
B) 8 CV syllables (/b/ or /g/ coupled with each vowel, e.g. bʌ, gʌ)
-
C) 8 nonwords (/b/ or /g/ coupled with each vowel and final consonant, e.g. bʌv, gʌk)
-
D) 14 filler items (vowel or not /b/ or /g/ onsets with varying offsets, e.g. Doss, Eebel).
Low fidelity (non-intact) auditory onsets
We edited the auditory track of the CV syllables and the nonwords by locating the /b/ or /g/ onsets visually and auditorily with Adobe Premiere Pro and Soundbooth (Adobe Systems Inc., San Jose, CA) and loudspeakers. We excised the waveforms in 1 ms steps from the identified auditory onsets to the point in the waveforms for which at least four of five trained adult listeners heard the vowel – not the consonant – as the onset in the auditory mode. Splice points were always at zero axis crossings. Using this perceptual criterion, we excised (on average) from the /b/ and /g/ onsets respectively 51 ms and 63 ms for the CV syllables, and 63 ms and 72 ms for the nonwords. The visual track of the utterances was also edited to form AV (dynamic face) vs. auditory (static face) modes of presentation.
AV vs. auditory modes
The AV stimuli consisted of a brief period of the talker's still neutral face and upper chest followed by an AV presentation of either a pair of CV syllables (discrimination) or a nonword (identification) followed by the talker's still neutral face and upper chest. The auditory mode consisted of the same auditory track but the visual track was edited to contain the talker's still neutral face and upper chest for the entire trial. The video track was routed to a high-resolution computer monitor, and the auditory track was routed through a speech audiometer to a loudspeaker.
Set of items: discrimination
The pairs of items – in the AV and auditory modes – were formed from the following groupings: eight CV syllables with intact /b/ and /g/ onsets (e.g. bo), eight CV syllables with non-intact /b/ and /g/ onsets (e.g. /–b/o), and four intact vowel syllables (e.g. o). Each trial presented two CV or two vowel syllables, which were sometimes the same (e.g. bi:bi, /–b/i:/–b/i, or i:i) and sometimes different (e.g. bi:gi, bi:/–b/i, or æ:i). The different CV pairs consisted of two intact syllables or one intact vs. one non-intact syllable. The two syllables were separated by a silent interval of 1,400 ms. Pilot studies indicated that the administration of all possible pairs of items was ill-advised because the children disliked this task. Thus we administered a subset of items to each child.
We formed four lists containing subsets of the items (the lists were presented forwards and backwards for eight variations). Table 1 illustrates the items for one list. Our approach for randomly selecting the items-to-omit from a list was to eliminate one vowel-pair from the intact vs. non-intact CV groupings and to abbreviate the number of intact pairs (which showed ceiling performance) and the number of same pairs (which traditionally are not scored). The items of each abbreviated list (N = 70, 35 items in each mode) were randomly intermixed under the constraints that no item could repeat, intact and non-intact analog items (e.g. bo and /–b/o) must be separated by at least two intervening items, the mode must alternate after three repetitions, and the modes (AV, auditory), judgments (same, different), types of pairs (intact, non-intact, intact:non-intact), and types of items (intact vowel, intact /b/ and /g/, non-intact /b/ and /g/) must be dispersed uniformly. The presentation of individual items was counterbalanced such that 50% of items occurred first in each mode. The response board contained two keys designated same/alike (two copies of same colored shape) and different/not alike (two shapes in different colors). The side corresponding to each response was counterbalanced across participants.
Table 1. The set of items consisted of CV syllables beginning with the consonants /b/ or /g/ coupled with the vowels /i/, /æ/, /ʌ/, or /o/ presented in the auditory vs. AV modes. A subset of items was administered to each participant. Below is an illustrative subset for one mode (N = 35 items). The items to be omitted were selected randomly across lists.
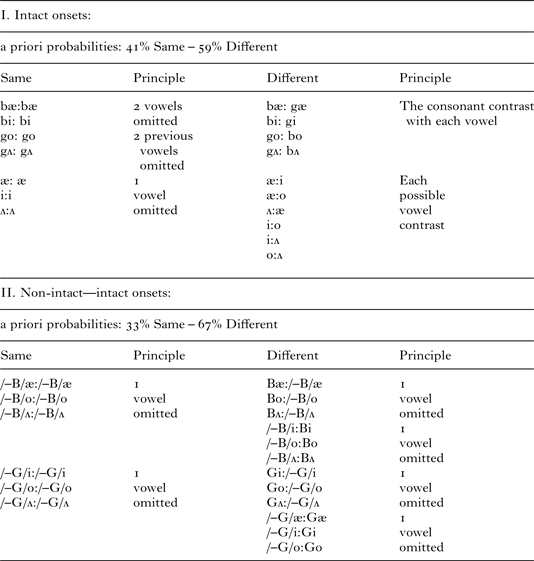
note: The a priori probabilities for the non-intact items (based on the physical characteristics) are not precise because the perceptions of participants vary (see text).
The a priori probabilities for the non-intact pairs (e.g. /–b/i:bi) could not be precisely specified because the perceptions of the participants varied – although with a general tendency (Jerger et al., Reference Jerger, Damian, Tye-Murray and Abdi2014) for the non-intact /g/ onsets to be perceived as a vowel in both modes (yielding a different response), and for the non-intact /b/ onsets to be perceived as a vowel in the auditory mode (yielding a different response), but as a consonant in the AV mode (yielding a same response). Based on the physical characteristics of the stimuli, the a priori probabilities were 41% same–59% different for the intact items and 33% same–67% different for the non-intact items. The resultant probabilities, which reflected the perceptual experiences of the participants, appeared appropriate for a two-alternative forced-choice task because – when results were collapsed across all items – the children pushed the same and different buttons respectively 49% and 51% of the time.
Set of items: identification
The items consisted of eight intact and eight non-intact test items (nonwords with /b/ and /g/ onsets, e.g. beece or /–b/eece; geen or /–g/een) and fourteen filler items (vowel or not /b/ or /g/ onsets, e.g. Apper, Onyit, Hork, Tyfer). All items were presented in the AV and auditory modes with each test item, intact and non-intact, presented twice in each mode. Thus, listeners heard trials randomly alternating between intact and non-intact auditory onsets, AV and auditory modes, and test and filler items. These items were randomly intermixed to form four lists (presented forwards and backwards). Each list consisted of forty-eight filler trials and sixty-four test trials. The items varied randomly with the constraints noted above.
Procedure
General
The tester sat at a computer workstation and the children, with a co-tester alongside, sat in front of a table (distance of 71 cm) containing a monitor and loudspeaker. The children's view of the talker's face subtended visual angles of about 7° vertically (eyebrow to chin) and 11° horizontally (eye level). The stimuli were presented at approximately 70 dB sound pressure level. These data were gathered as part of a larger protocol administered over three sessions, each separately by about 12 days (Jerger et al., Reference Jerger, Damian, Tye-Murray and Abdi2014, Reference Jerger, Damian, Tye-Murray and Abdi2017).
Initial testing began with practice items – intact items for discrimination (e.g. bʌ:gʌ, bʌ:bʌ) and intact filler-items for identification (e.g. Cheeg, Doss). We selected practice filler items for identification to implicitly instruct the children that the nonwords began with many onsets, not only the /b/ and /g/ onsets of interest. Formal testing started when – or practice items continued until– the child was responding correctly without hesitations. No feedback was provided because the children performed at ceiling for intact onsets, and there was no predetermined correct response for non-intact onsets.
Discrimination
Each child completed one list in a two-alternative forced-choice paradigm, with one-half of items presented in separated sessions. The children were instructed as follows:
“A boy is going to say two sounds and sometimes they will be the same/alike (demonstrate: æ-æ or bi-bi) and sometimes they will be different/not alike (demonstrate: ʌ:i, or gʌ:bʌ). Sometimes the boy's mouth will move and sometimes it will not move. Your job is to listen very carefully to the talker. Push this button if the sounds are the same/alike (demonstrate) and push this button if the sounds are different/not alike (demonstrate).”
Identification
The children were instructed to repeat exactly what the talker said. The children's utterances were transcribed independently by the tester and co-tester and digitally recorded. For the utterances with non-intact onsets, the transcribers disagreed on 2·28% of responses. For these responses, another trained listener independently transcribed the recorded utterances. Her transcription, which always agreed with one of the other transcribers, was recorded as the response. The criteria for scoring responses to the non-intact onsets (illustrated for /−b/æz) were as follows:
-
1. Correct vowel onsets (e.g. æz) scored as an auditory-based response for both modes.
-
2. Correct consonant onsets (e.g. bæz) scored as a visual-based response for the AV mode and as a coarticulatory-based response for the auditory mode.
-
3. Incorrect vowel or consonant onsets (e.g. dæz) scored as errors.
This research focused on the number of correct consonant onset responses in the AV vs. auditory modes. We acknowledge that a correct consonant onset response in the AV mode might also be attributed to coarticulatory cues on performance rather than to visual speech. Importantly, however, these coarticulatory effects (and strategic effects) should also produce a correct consonant onset response in the auditory mode; thus, the VSFE (AV – auditory) should not reflect these non-visual-speech influences because such effects should influence performance in both modes. Each child completed one list in four separated listening sessions.
RESULTS
Accuracy for discriminating and identifying the intact onsets
Discrimination
The children discriminated the intact different pairs (bi:gi) at 100% accuracy for both modes. Performance for the same pairs was also at ceiling.
Identification
The accuracy of repeating the intact nonwords (bæz, gæk) in the two modes was ⩾ 98% for the onsets and ⩾ 96% for the offsets (i.e. the remainder of the utterance). The accuracy of repeating the offsets of the nonwords with non-intact onsets (/–b/æz,/–g/æk) was also ⩾ 96 %. Below we analyze the accuracy of performance for the non-intact nonwords.
Analysis I: discrimination and identification of the non-intact onsets
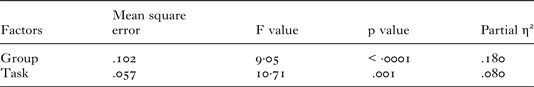
In the discrimination task, we focused on the intact vs. non-intact different pairs (e.g. bʌ:/–b/ʌ) because we wished to assess whether visual speech made it harder to discriminate non-intact from intact auditory speech (e.g. bʌ:/–b/ʌ perceived as bʌ:bʌ). Thus we determined the percentage of same responses to these pairs differing in intactness. In the identification task, we focused on the non-intact /b/ and /g/ onsets because we wished to assess whether visual speech made it more likely to perceive the non-intact onsets as intact (e.g. /–g/æk perceived as gæk). Thus we determined the percentage of correct onset responses for the non-intact nonwords.Footnote 1 Our initial analysis addressed whether performance for the auditory mode, which serves as our baseline for computing the VSFE, differed as a function of: the tasks, children's ages, and onsets. All data below were analyzed with a mixed-design analysis of variance (ANOVA) with one between-participant factor (Age Group: five-year-olds, seven-year-olds, nine-year-olds, and twelve-year-olds) and two within-participant factors (Task: discrimination vs. identification; Onset: /b/ vs. /g/). The Bonferroni correction controlled the familywise alpha (Abdi, Edelman, Valentin & Dowling, Reference Abdi, Edelman, Valentin and Dowling2009).
Auditory baseline
Figure 1 shows baseline performance on the discrimination and identification tasks for the /b/ and /g/ onsets in the children, grouped by age. Results quantified the percentage of same responses to the intact vs. non-intact pairs (Discrimination: bʌ:/–b/ʌ perceived as same) and of correct consonant onset responses to the non-intact nonwords (Identification: /–b/ʌv perceived as bʌv). As can be seen, performance in the children did not differ across age groups, tasks, or onsets. The children responded same about 25% of the time or with the correct consonant onset about 22% of the time. These percentages are consistent with our perceptual criterion for excising the onsets and are interpreted as demonstrating coarticulatory influences on performance. There was no significant statistical finding. Thus, these results provide a strong stable baseline across tasks, onsets, and groups for evaluating the effects of visual speech. In the results below, we quantified the influence of visual speech by the VSFE (i.e. AV–auditory modes).

Fig. 1. Baseline results for the auditory mode in the children grouped according to age. Performance was quantified by percent of same responses to the different pairs (e.g. bæ:/–b/æ perceived as same) for discrimination and percent of correct consonant onset responses (e.g. /-b/æz perceived as bæz) for identification. Results – which did not differ across the age groups, the tasks, or the onsets – are consistent with our criterion for excising the onsets and yield a stable baseline for assessing the Visual Speech Fill-in Effect. Error bars are ± one standard error of the mean.
Effect of Visual Speech
Figure 2 shows the VSFE – in the age groups – for the discrimination and identification tasks and the /b/ and /g/ onsets (left and right panel, respectively). As can be seen, the VSFE–/b/ onset is pronounced for both the discrimination and identification tasks, and it appears to grow with increasing age. By contrast, the VSFE–/g/ onset is small or absent. The statistical results from the ANOVA (Table 2A) indicated a significant effect of the age groups and onsets, but these overall effects were difficult to interpret because of the significant interactions between onset and group and between onset and task. To probe these interactions, we carried out an ANOVA for each onset separately with one between-participant factor (Age Group: five-year-olds, seven-year-olds, nine-year-olds, and twelve-year-olds) and one within-participant factor (Task: discrimination vs. identification).

Fig. 2. Visual Speech Fill-in Effect, VSFE (i.e. difference in performance for the AV–auditory modes) in children grouped according to age. Discrimination was quantified by percent of same responses to the different pairs (e.g. bæ:/–b/æ perceived as same); identification was quantified by percent of correct consonant onset responses (e.g. /-b/æz perceived as bæz). Results show a large VSFE (with significant age and task differences) for /b/ but not for /g/. Error bars are ± one standard error of the mean.
Table 2. A. Significant statistical outcomes: A mixed design analysis of variance (ANOVA) with one between-participant factor (Age Group: five-year-olds, seven-year-olds, nine-year-olds, and twelve-year-olds) and two within-participant factors (Task: discrimination vs. identification; Onset: /b/ vs. /g/). The dependent variable was the VSFE (quantified by the difference in performance for the AV minus auditory modes).
/b/ and /g/ onsets

note: df's = 3, 124 for Group, Onset x Group; 1, 124 for Onset, Onset x Task.
B. Significant statistical outcomes: A follow-up ANOVA with one between-participant factor (Age Group: five-year-olds, seven-year-olds, nine-year-olds, and twelve-year-olds) and one within-participant factor (Task: discrimination vs. identification).
/g/ onset: No significant statistical outcomes
/b/ onset
note: df's = 3, 124 for Group; 1, 124 for Task.
C. 95% Confidence intervals (lower, upper limits in percent) for the VSFE

note: * = VSFE differed significantly from zero.
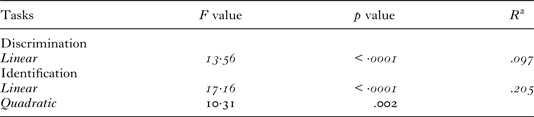
D. Trend analysis: developmental functions, /B/ onset
/g/ onset
Statistical findings for the /g/ onsets did not yield any significant result. As seen in Figure 2, performance did not differ across the age groups or tasks. The overall VSFE averaged about 8% for discrimination and 3% for identification. To determine whether the addition of visual speech significantly altered discrimination and identification in any group, 95% confidence intervals were computed for each group and task. The specific question was whether each VSFE differed significantly from zero. If the 95% confidence interval – or the range of plausible difference scores – does not contain zero, then the results are significant. The confidence intervals (Table 2C) revealed a significant VSFE for discrimination in the seven-year-olds and twelve-year-olds, and for identification in the nine-year-olds. However, effects were overall very small, and the lower limits of confidence intervals were close to zero.
/b/ onset
The statistical results (Table 2B) revealed a significant effect of age group and task. As seen in Figure 2, the VSFE increased with age for both tasks and was consistently larger for identification than discrimination. Although Figure 2 shows that the numerical difference between the VSFE-discrimination and VSFE-identification varied across the groups, the group × task interaction was not significant (p = ·53). To determine whether each VSFE differed significantly from zero, we again computed 95% confidence intervals (Table 2C). All groups showed a significant VSFE for both tasks. The developmental trends for the two tasks differed significantly, however, as documented by trend analysis with age as a continuous variable (Table 2D). For VSFE-discrimination, only a linear trend characterized the variation with age whereas for VSFE-identification, both a linear and a quadratic trend characterized the change with age. The different trends indicate that the age-related course for VSFE-identification showed a rapid rate of change from five to seven years and then a slower rate of change at the older ages, whereas the course for VSFE-discrimination showed a more constant and consistent rate of change throughout the entire age range.
In summary, children of all ages (four to fourteen years) benefited significantly from visual speech for the easy-to-speechread /b/ onsets but only minimally or not at all for the difficult-to-speechread /g/ onsets. Below (in Analysis II), we assessed whether the benefit from visual speech for a lower-level perceptual skill (VSFE-discrimination) was associated with receptive vocabulary knowledge and with the benefit from visual speech for a higher-level perceptual skill (VSFE-identification). We performed Analysis II only on /b/ onsets. Exclusion of /g/ onsets was justified by the ANOVA indicating that VSFE-discrimination and VSFE-identification did not differ and the 95% confidence intervals indicating that visual speech influenced VSFE-discrimination and VSFE-identification minimally if at all.
Analysis II: association between lower-level VSFE-discrimination and two higher-level factors – VSFE-identification and receptive vocabulary knowledge
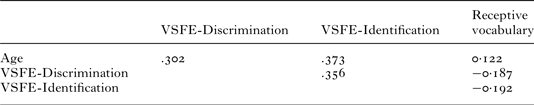
As outlined in the ‘Introduction’, the goal of Analysis II was to understand whether VSFE-discrimination (lower level of perceptual analysis) was uniquely associated with VSFE-identification (higher level of perceptual analysis) and receptive vocabulary knowledge. We conducted a multiple regression analysis with these variables; age was also included as a control variable because of its significant effects on VSFE (Figure 2). Prior to carrying out the analysis, the variables were standardized. Table 3 summarizes the regression results as well as the correlations between the variables. The multiple correlation coefficient and omnibus F statistics for all of the variables considered simultaneously are reported for interested readers. However, our research questions are addressed by the part (a.k.a semi-partial) r and the partial F statistics because these statistics evaluate whether variation in the VSFE-discrimination is significantly associated with variation in VSFE-identification (after removing the variation due to age and receptive vocabulary) and in receptive vocabulary (after removing the variation due to age and VSFE-identification; Abdi et al., Reference Abdi, Edelman, Valentin and Dowling2009). The part rs indicate that children's VSFE-discrimination was significantly (p ⩽ .05)associated with both their VSFE-identification and receptive vocabulary. The shared variance between VSFE-discrimination and each higher-level factor was about 3% to 4%. This degree of association seems notable, however, given that we allowed VSFE-discrimination to be associated only with the unique variance that was not shared with any of the other variables.
Table 3. A. The multiple correlation coefficient (R) and omnibus F for all of the variables considered simultaneously followed by the part correlation coefficients (r) and the partial F statistics evaluating the variation in the VSFE-discrimination that was uniquely associated with the variation in the VSFE-identification and receptive vocabulary (after removing the influence of the other variables). Age was included as a control variable due to its significant effects on the VSFE (see Figure 2). Stimuli were the /b/ onsets.
A. Multiple regression results

note: df's = 3, 124 for Omnibus F and 1,124 for partial F.
DISCUSSION
Visual speech can enhance multiple levels of speech perception in adults (Files et al., Reference Files, Tjan, Jiang and Bernstein2015) but there is scant evidence in children to support this claim. We addressed this problem by studying how visual speech affects two different levels of perceptual analysis – discrimination and identification – in children from four to fourteen years. Our approach assessed performance for CV syllables or nonwords with intact visual speech coupled to non-intact auditory speech. Stimuli were presented in the AV and auditory modes, and the effect of visual speech was quantified by the difference in performance between the AV and auditory modes (VSFE). We predicted that visual speech would cause the non-intact onsets to be perceived as intact.
Results from both discrimination and identification tasks revealed that all age groups benefited significantly from visual speech for the /b/ onsets. For these easy-to-speechread onsets, visual speech improved children's discrimination by about 35% and their identification by about 45%. In contrast, the age groups benefited minimally or not at all from visual speech for the difficult-to-speechread /g/ onsets. As noted previously, 98% of the current participants (N = 125) also participated in our study that assessed phonological priming by these same /–b/ and /–g/ onsets with the multimodal picture–word naming task (Jerger et al., Reference Jerger, Damian, Tye-Murray and Abdi2017). The picture–word naming task assessed the influence of visual speech indirectly or implicitly (i.e. the children named pictures and did not consciously attend to or respond to the AV and auditory nonword primes), whereas the current repetition task assessed the influence of visual speech directly (the children consciously attended to and repeated the AV and auditory nonwords). In contrast to the current results, the Jerger et al. (Reference Jerger, Damian, Tye-Murray and Abdi2017) study demonstrated a pronounced effect of visual speech on phonological priming by both the /–b/ and /–g/ onsets. The priming results for the /–g/ onsets provide strong evidence that an indirect priming task can reveal an influence of visual speech when a direct repetition task does not. We have proposed that more precisely detailed visual speech representations are required for direct tasks requiring conscious access and retrieval of knowledge (Jerger, Damian, Spence, Tye-Murray & Abdi, Reference Jerger, Damian, Spence, Tye-Murray and Abdi2009). The difference in results underscores the importance of considering task/stimulus demands when assessing visual speech influences in children.
Results of both discrimination and identification tasks for the /b/ onsets showed age-related change in the extent to which the children benefited from visual speech. From the youngest to the oldest group, the visual speech benefit grew from 22% to 47% for discrimination and 27% to 55% for identification. To the extent that visual speech provides another type of phonetic cue (Campbell, Reference Campbell1988), these results are consistent with the finding that younger children have less well specified and harder-to-access phonological representations (Snowling & Hulme, Reference Snowling and Hulme1994). The reasons for the age-related change in these children probably involve multiple factors, such as age-related advances in linguistic skills (especially input and output phonology) and in the perceptual weight given to visual speech cues (Desjardins et al., Reference Desjardins, Rogers and Werker1997; Massaro et al., Reference Massaro, Thompson, Barron and Laren1986). It also seems important to emphasize that the benefit from visual speech – although present at all ages – may reflect different underlying mechanisms in the younger vs. older children.
The slopes of the developmental functions for discrimination and identification shown in Figure 2 differed. For discrimination, the benefit from visual speech improved with increasing age at a fairly consistent rate throughout the entire age range. By contrast, for identification, the benefit grew at a more rapid rate from five to seven years and then at a slower rate at older ages. The reasons for the different developmental trajectories across tasks are not clear. Possible explanations are that children disliked the discrimination task, and perhaps the enhanced performance with increasing age is due to a growing maturity that motivated the children to persist even when they wanted to quit. An alternative, admittedly speculative, explanation for this pattern is that – in contrast to discrimination – the identification of what a talker said is a highly familiar, well-practiced skill. Thus, identification performance may grow more quickly and plateau at an earlier age. The identification task also specifies a clear focus of attention (the linguistic content) and a clear criterion for success (repeat what was perceived). By contrast, discrimination is less practiced and less familiar. The focus of attention for discrimination is also less clear-cut, and the criterion for success is less well specified (e.g. participants determine the criterion for same vs. different). If children's concept of same vs. different is initially less precise, and gains specificity with age, then discrimination performance may increase linearly with age. This latter possibility is discredited, at least to some extent, however, by the observation that these children – even five-year-olds – discriminated the intact items perfectly.
Analysis II explored whether the benefit from visual speech for a lower-level perceptual skill (VSFE-discrimination) predicted the benefit from visual speech for a higher-level perceptual skill (VSFE-identification), as well as receptive vocabulary knowledge. Results showed that variation in the VSFE-discrimination was uniquely associated with variation in the VSFE-identification and receptive vocabulary. These results extend previous findings of auditory-only studies that observed difficulties in phoneme discrimination in children with difficulties in learning language, as well as an association between phoneme discrimination and phoneme identification / vocabulary skills in infants/children and in adults learning a second language (Briscoe et al., Reference Briscoe, Bishop and Norbury2001; Jerger et al., Reference Jerger, Martin and Jerger1987; Lalonde & Holt, Reference Lalonde and Holt2014; Rato, Reference Rato2014; Tsao et al., Reference Tsao, Liu and Kuhl2004). A possible interpretation of these results is that the VSFE-discrimination is related to the composition of phonological knowledge, with children with better VSFE-discrimination perhaps having more robust and highly specified phonological representations. Such representations would provide an advantage for learning to identify phonemes (VSFE-phoneme identification), and this, in turn, could advance word learning and thus vocabulary size. Reciprocally, it is possible that a larger vocabulary would promote even greater robustness and specificity of phonological representations, and this, in turn, would advance VSFE-phoneme identification and VSFE-discrimination. In other words, the developing speech perceptual, phonological, and lexical systems may interact in complex ways (Edwards, Munson & Beckman, Reference Edwards, Munson and Beckman2011). Despite the possibility of these dynamic interactions, our results provide strong evidence that visual speech and efficient discrimination of speech sounds are paramount for learning phonemes and words. Such results provide a more comprehensive understanding of the value of visual speech at multiple levels of perceptual analysis by children.


