


1. Introduction
College students gain a considerable amount of weight when they start their programs. The term “Freshman 15,” for instance, refers to the 15 pounds that freshmen tend to gain during their first year of college. Gropper et al. Reference Gropper, Simmons, Connell and Ulrich(2012) show that statistically, 70 percent of students gain weight during their college years, about 12 pounds on average. This is in spite of the growing efforts by universities to improve healthy dining offers. For example, over 67 colleges are a part of the “Healthier Campus Initiative” by Partnership for Healthier America to improve campus food, covering more than 1.5 million students, faculty, and staff. This is costly, as it requires compliance with at least 23 of 41 nutrition-related efforts, such as having trained nutritionists on campus. This paper investigates whether simple, cost-less nudges can also help.
We focus on a change implemented by the Stillings Dining Hall at the University of New Hampshire (“UNH”), which involves the relocation of the dessert section. Until the Fall of 2017, this section was next to where students leave their dishes when exiting, tempting them to grab a cookie on their way out. In Spring 2018, the desserts were moved to the opposite end of the dining hall due to the introduction of a new food section. The new section includes gourmet main courses that need constant heat, and the section previously occupied by the cookies has heating capabilities. Thus, desserts were no longer in everyone’s sight.Footnote 1 Most of the desserts served are cookies, so we refer to them as such.
The reason why the change might affect consumption can be rationalized using a model of temptation, as in Gul and Pesendorfer Reference Gul and Pesendorfer(2001). In that model, the consumer makes decisions twice: one before seeing all the available options, and one after. The first decision is a more rational one, that opts for healthy food that will be beneficial to the individual in the long run. The second choice is likely to be driven by a short-run gain provided by eating tasty food when these are spotted. The unhealthy nature of this tasty food carries negative long-run consequences. We provide a detailed analysis of how Gul and Pesendorfer Reference Gul and Pesendorfer(2001) applies to our case in the Online Appendix, section F, available at https://github.com/rubiniloris/Hide-the-Cookie-Jar. This theory suggests the use of a comparison food to eliminate changes that are not related to the relocation, and also affect the comparison food. While ideally this would be another dessert item that did not change location, such as fresh fruit, the management at Stillings could not provide such data. Alternatively, they provided data on pizza consumption, and item that did not relocate. We use this as our comparison food.
Our findings show that cookie consumption would have been up to 22% larger had the cookie section not relocated, relative to pizza consumption. The drop is stronger on weekdays, while there is no significant effect on Sundays (Stillings is closed on Saturdays). Additionally, the effects are larger at lunchtime than at dinner. We find no significant drop during finals, which may indicate stress-induced eating during finals, in line with Lien and Zheng Reference Lien and Zheng(2018). As a placebo test, we test for a change in consumption of cookies relative to pizza from Spring 2018 to Fall 2018, semesters when the cookies remained out of sight, and we no longer find significant effects. We interpret this as evidence that simple “nudges” can go a long way in shaping eating habits.
This study is related to three strands of literature. The first one relates to simple actions, or nudges, that can improve eating habits. The second one relates to the interactions between food location and its consumption. The third relates to the effects of making food items less accessible.
Along the first strand, simple actions can have big impacts on food consumption. Sadoff and Samek Reference Sadoff and Samek(2019) find that providing nutritional information can greatly modify behavior. Similarly, Samek Reference Samek(2019) finds that providing rewards for healthy eating also works. Bauer and Reisch Reference Bauer and Reisch(2019) survey the literature on policies that lead to healthy eating habits, and Hawkes et al. Reference Hawkes, Smith, Jewell, Wardle, Hammond, Thow, Kain and Friel(2015) on obesity deterrents, and they find that making healthy foods more visible encourages healthy eating. In particular, placing fresh fruits and vegetables within sight in schools has been very successful.Footnote 2 We find that the opposite is also true: removing unhealthy foods from eyesight is also effective. It is important to highlight that these simple actions do not always work. Wilson et al. Reference Wilson, Buckley, Buckley and Bogomolova(2016) find that there are very few successful cases in which nudging led to healthier eating habits. This is because dietary behaviors are mostly habitual (Köster, Reference Köster2003; Köster, Reference Köster2009; Wansink & Sobal, Reference Wansink and Sobal2007; Wood et al., Reference Wood, Quinn and Kashy2002) and lack effort (Kahneman, Reference Kahneman2003; Kahneman, Reference Kahneman2011; Neal et al., Reference Neal, Wood and Quinn2006). Our results indicate that this “lack of effort” can be used in a positive way. If access to unhealthy food requires more effort, then its consumption will drop, even if that effort is minimal, as is the case that we study presently.
Related to food location, a number of studies focus on the effects of altering the location of healthy food. Wansink and Hanks Reference Wansink and Hanks(2013) find that placing items at the start of a line in a cafeteria increases their demand. Dayan and Bar-Hillel Reference Dayan and Bar-Hillel(2011) find that placing a food item at the start or end (as opposed to the middle) of the line increases its selection. Kurz Reference Kurz(2018) and Garnett et al. Reference Garnett, Marteau, Sandbrook, Pilling and Balmford(2020) find that changing the location of vegetarian options can affect their consumption. Once again, location does not always matter: van Kleef et al. Reference van Kleef, Otten and van Trijp(2012) find no effects of changing snacks between top and bottom shelves in a hospital cafeteria. Levy et al. Reference Levy, Riis, Sonnenberg, Barraclough and Thorndike(2012) find no significant effect of placing healthier food at eye level in three hospital cafeterias, and Thorndike et al. Reference Thorndike, Riis, Barraclough, Sonnenberg and Levy(2012) confirm these results in a similar exercise. In our case, we are in line with the findings that suggest location matters. What is interesting is that this happens in a different context than that studied previously. Cookies were not moved to the front, middle, or back of the line since there is no line. They were moved out of sight.
Several papers study the effect of making unhealthy food less accessible. Rozin et al. Reference Rozin, Scott, Dingley, Urbanek, Jiang and Kaltenbach(2011) find that replacing spoons with tongs in a university cafeteria reduced the consumption of unhealthy products by increasing the consumption of salads. Wisdom et al. Reference Wisdom, Downs and Loewenstein(2010) find that featuring healthy sandwiches in a fast food sandwich restaurant increases their consumption. We confirm these findings by focusing on a new way of reducing accessibility.
2. Empirical approach
We use a difference-in-difference approach comparing the consumption of cookies (which were relocated after Fall 2017) and pizza (which stayed in the same place) before and after Fall of 2017.Footnote 3 There are many things that might account for a change in cookie consumption that we are abstracting from (such as number of diners, for example). The use of a control food allows us to account in some way for these changes, as long as they affect pizza and cookies equally.
Next we present our empirical strategy. In addition to allowing for differences in the number of patrons each period, we also allow for differences in the type of pizza or cookie, plus other changes that act as controls to our regressions. Also, the abundance of zeros in our data prevents us from using logarithms, a problem described in Santos Silva and Tenreyro Reference Santos Silva and Tenreyro(2006), which leads us to use the following estimating equation:
 \begin{align}
y_{kt} = \exp\left[\eta_{k}+\gamma_{1}d_{{2018}_{t}}+\gamma_{2}d_{cookie_{k}}+\gamma_{3}d_{{2018}_{t}}d_{cookie_{k}}+\gamma_{4}Z_{k}\right]+\epsilon_{kt},
\end{align}
\begin{align}
y_{kt} = \exp\left[\eta_{k}+\gamma_{1}d_{{2018}_{t}}+\gamma_{2}d_{cookie_{k}}+\gamma_{3}d_{{2018}_{t}}d_{cookie_{k}}+\gamma_{4}Z_{k}\right]+\epsilon_{kt},
\end{align} where ykt is the consumption of good k at time t, and k denotes types of cookies and pizza. ηk is a constant specific to the type of good.  $d_{{2018}}$ is a binary variable, which is equal to one for observations after Fall 2017, and equal to 0 otherwise. dcookie is a dummy variable, equal to 1 if the good is a cookie, and 0 if pizza. Zk contains a series of controls that we specify later. Given this specification,
  $e^{-\gamma_3}-1$ measures the additional cookies that would have been consumed had they not relocated, relative to those consumed before the relocation.
Our controls include: Fall or Spring semester; days since the start of the semester; lunch or dinner; weekday or weekend; day of the week; days into the semester; final exams week; number of available types of cookies or pizza; whether a good is easy to take-away;Footnote 4 and product fixed effects.
Some of these controls are more important than others. For example, while the day of the week may not be crucial, a weekend is different than a week-day, when diners are more relaxed. Fishman et al. Reference Fishman, Fishman and Gneezy(2019) finds that diners learn in time how to act in university cafeterias, so adding a trend is potentially important. Similarly, Smith Reference Smith(2012) shows how stressors can increase demand for unhealthy food, and Lien and Zheng Reference Lien and Zheng(2018) find that unhealthy food consumption increases significantly during the final exam week, signaling the need for a “finals” control.
Pizza, the Comparison Food. Pizza is our comparison food, meant to control for changes not related to the relocation. One of the main differences is the number of patrons, that may change from one semester to the next. Measuring changes relative to pizza addresses this concern.
In addition, pizza can control for other issues because of its characteristics. A good comparison food should not be either a complement or a substitute, and pizza is neither. Second, cookies and pizzas are both relatively unhealthy options, making the comparison relatively clean. Both products are flour based, so anyone cutting down on flour consumption would eat less of both. Third, since we are quantifying the effect of moving a section, we can use pizza to compare because it did not change locations. Fourth, pizzas, as well as cookies, are items that are available every day, and their consumption is easily quantifiable in terms of portions. Other items, such as pasta or chicken, are either not present every day, hence limiting our number of observations, or harder to quantify as portions.
It is worth noting that a slice of pizza tends to have more calories than a cookie. A standard thin cheese pizza slice contains around 208 calories, while a medium sized chocolate chip cookie contains about 49 calories (www.fatsecret.com). This is not a problem for comparison purposes as long as the calories do not change in time (and they don’t).
Still, there may be additional problems with our comparison. For example, if there is a general trend against eating sugar, our results would be overestimating the effects of the relocation. Also, a pizza slice cannot be taken out of the restaurant like a cookie. But as long as this characteristic does not change, it should not affect the use of pizza as a control. For these reasons, it would be desirable to have a better comparison foods, especially those consumed as desserts such as fresh fruit. Unfortunately, Stillings could not provide data on fresh fruit consumption (or any other food), which drives us to use the best alternative.
To at least partly address these issues, we perform a placebo test in which we compare changes in cookie consumption relative to pizza, across periods where there was no re-location (from Spring 2018 on). We do not find a drop in the consumption of cookies relative to pizza.
3. Data
Our data comes from the Stillings Dining Hall at UNH. The hall operates as an “all that you can eat” restaurant: after paying a fixed price, the diner can eat as much as wanted within the premise. Anyone has access to this restaurant, not only students. Take-out is limited to cookies and fruit, and strictly to one unit.Footnote 5 Students have the option of pre-paying for the entire semester, with unlimited entries. The cost stays constant during the period of analysis.
The management provided data on cookie and pizza consumption. The period covered starts August 28, 2017, and ends March 18, 2019. Stillings could not provide data on the consumption of cookies prior to September 14, 2017. The Online Appendix, section A, contains a list of all the different types of cookies and pizzas.
The data include portions prepared for each service, each day, together with the portions left at the end of the service, for both cookies and pizza, and we use the difference between these two as our consumption variable. The portion of a cookie is a unit, and for pizza it is a slice. Not all products are offered every day, or in every meal, so our panel is not balanced. For example, more cookies tend to be served during lunches and weekdays than dinners or weekends (see Table 1). We treat items not served on a particular service/day as missing data. We discard all data on breakfast, because there is hardly any pizza served at breakfast.Footnote 6
Table 1 Summary statistics: The columns “Mean” display the average number of portions per service (lunch or dinner) per day. For cookies, this is one item (cookie, cupcake, etc.). For Pizza it is one slice. The column “Std. Dev.” shows the standard deviation of the number of portions per service per day, and “N. Obs.” shows the number of observations
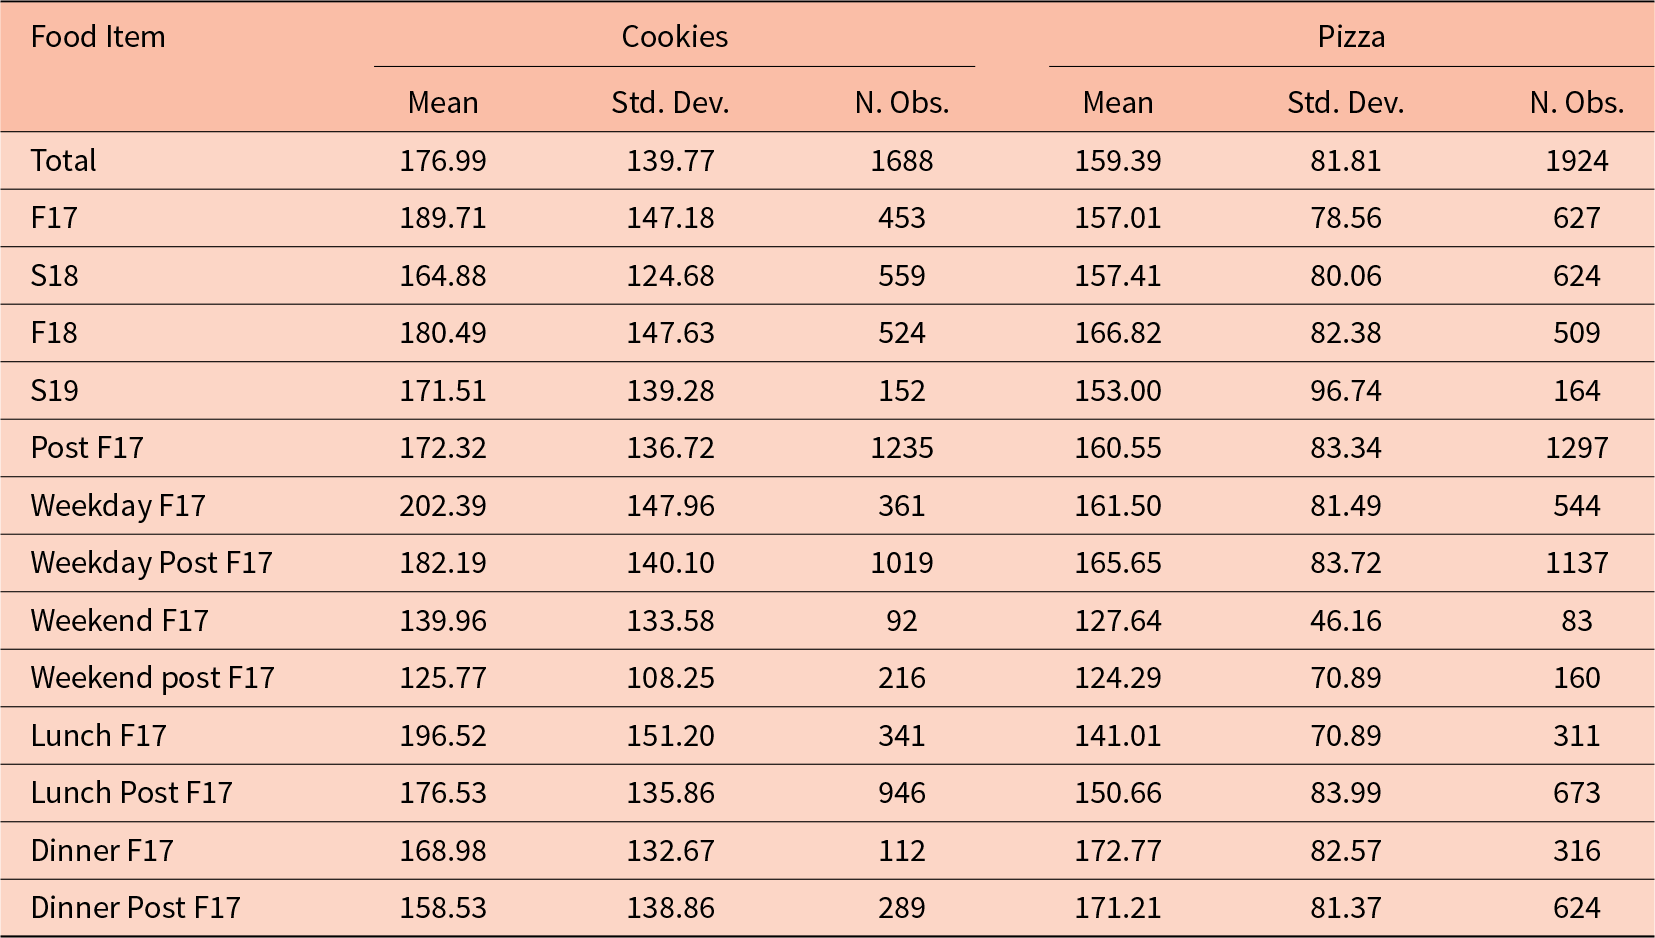
Table 1 presents summary statistics. By simply comparing means, one can see that in all cases, the number of average daily cookie portions drops after Fall 2017. This does not happen with pizza. However, the standard deviations suggest the drop is far from robust. The second panel shows disaggregate data based on whether the service is on a weekday (Monday through Friday) or a weekend (Sunday, since Stillings is closed on Saturdays).Footnote 7 The third panel disaggregates our observations between lunch and dinner services.
4. Results
This section presents our results. We first present evidence of pre-trend behavior and the changes observed by aggregating all types of cookies and pizzas after the relocation. We then present the results of our statistical analysis.
4.1. Aggregate Behavior around the Cookie Relocation
Our first exercise confirms that the consumption of cookies drops after the relocation. Over our entire time frame, we find that, on average, the consumption of cookies drops by about 27 portions per day after the relocation. This implies a drop of about 14%, given that during the Fall of 2017 the average portions served per day were about 190. These findings are reinforced when focusing on narrower time frames: the drop is 48 portions when focusing on 75 days around the relocation, and 54 when focusing on 30 days.Footnote 8
A problem with this exercise is that there are many unobservables that we cannot control for. For example, we do not have data on the number of patrons attending the dining hall. Because of this, we study the consumption of cookies in relation to that of pizza, as the number of patrons remain the same for both goods.
Figure 1 shows that the trends in cookie and pizza consumption during lunch in Fall 2017 were very similar, justifying the use of pizza for comparison. If anything, the consumption of cookies is slightly increasing relative to pizza. For each date, we add the total consumption of cookie portions and regress that number on the number of days since the start of the semester. We proceed similarly for pizza. The solid lines represent the trend minus the intercept. The dots represent weekly averages, to which we subtract a constant so that they are centered at zero. The shaded areas are 95% confidence intervals.

Fig. 1 De-meaned lunch trends and actual consumption of cookies and pizza before the relocation
Figure 2 shows that this result changes after the relocation, when the consumption of cookies drops considerably more than that of pizza. These data subtract the pre-relocation means from the post-relocation trend, so they are not centered around zero. Both the consumption of cookies and pizza dropped, but the drop in cookies is larger.Footnote 9

Fig. 2 Difference in de-meaned lunch trends before and after the relocation
4.2. Main results
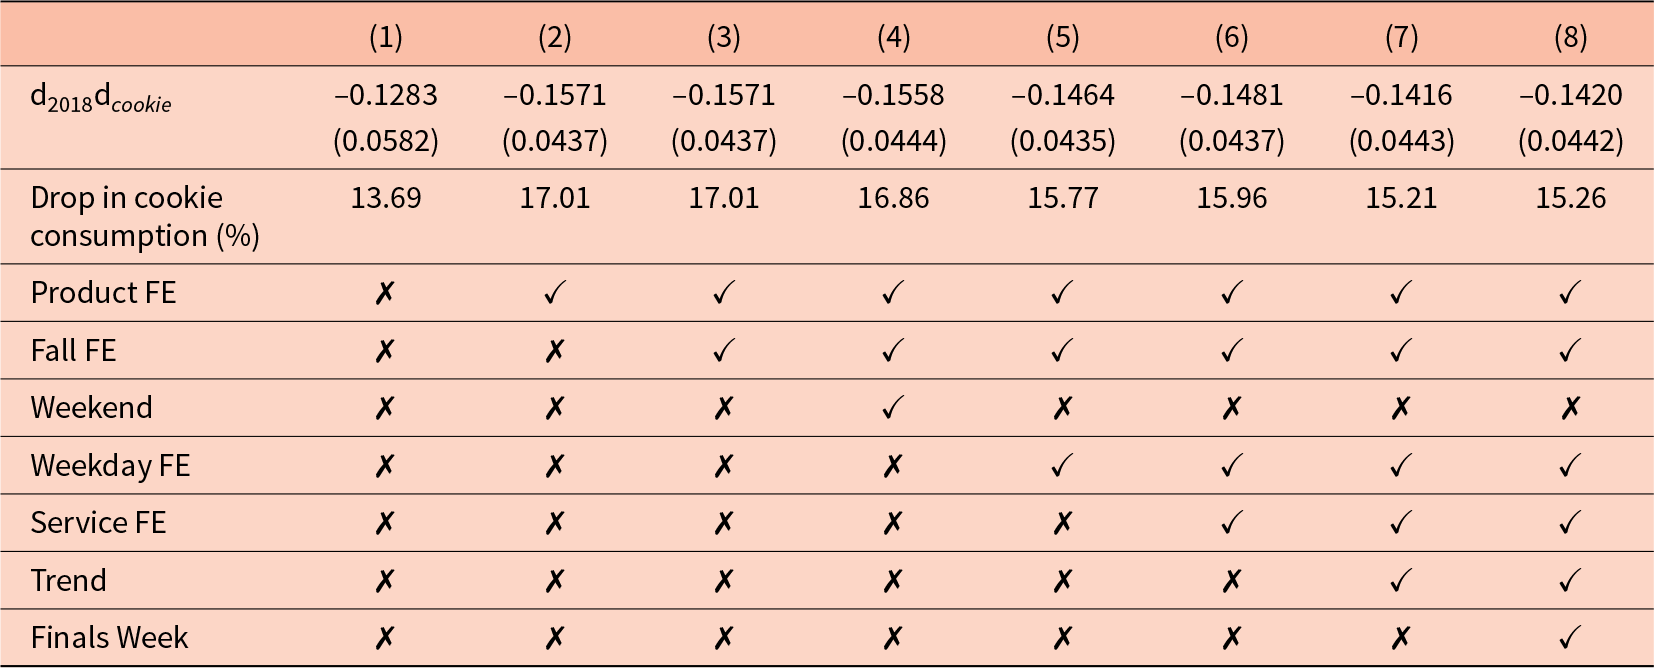
To formally investigate whether the consumption of cookies drops relative to the consumption of pizza, we turn to Table 2. The coefficient of interest is γ 3 in equation (1), the interaction effect of d 2018 and dcookie. A negative estimate suggests that the relocation of the cookie stand acts as a nudge, driving students to lower consumption. We estimate equation (1), assuming a Poisson fixed effects model.
Table 2 Main results. Estimated effect of relocation on consumption of cookies relative to pizza

Robust standard errors in parentheses. Number of Observations is 3,573 for the first column, and it is 3523 for the remainder of the columns.
Row 1 in Table 2 shows the estimates of γ 3 in equation (1) with different controls. The complete set of the coefficient estimates for the baseline regression model is available in the Online Appendix, section E. Row 2 converts these into percentages. The estimates are all negative and significant at the 1% level. The first column includes the interaction effect, with no additional controls. The consumption of cookies would have been 14.21% ( $=e^{0.1329}-1$) larger had they stayed in their Fall 2017 location. Column (2) adds product fixed effects, and the drop in cookie consumption is similar. Column (3) adds a Fall fixed effect, column (4) a weekend control, column (5) a day of the week fixed effect to test for different effects within weekdays, column (6) adds service fixed effects, column (7) adds a trend, column (8) a finals dummy, and column (9) controls for the number of available options.
Finally, column (10) introduces a dummy that interacts cookies and Fall, to address a potential decline in the consumption of cookies in the Spring, which is problematic in our case because we do not have data on Spring consumption before the relocation. In fact, Table 1 shows that after the relocation, cookie consumption is higher in the Fall (and so is consumption for Pizza).
In all cases, the results are similar, with the consumption of cookies resulting in a drop of between 14% and 18% relative to the expected number of portions had they not relocated, significant at the 1% level.
4.3. Sub-samples
Table 3 presents the estimates for different sub-samples. The first two columns show the estimates for weekday and weekend observations, respectively. Note that weekend refers to Sunday, since Stillings is closed on Saturdays. There is a significant drop during weekdays, which is similar in magnitude to our main results. The drop in weekends is smaller and still significant.
Table 3 Estimated effect of relocation on cookie consumption, by subsample. Column (1) includes only week-days, column (2) includes only weekends, column (3) includes only lunches, column (4) includes only dinners, column (5) includes only Finals season, and column (6) excludes Finals season

Robust standard errors in parentheses.
Columns 3 and 4 explore the effects for lunch and dinner. The drop relative to the expected consumption had cookies not relocated during lunch (almost 22%) is significant and larger than our main results, whereas the effect becomes insignificant for dinner.
As for columns 5 and 6, we see that the effect of the nudge is amplified slightly when we drop final exam weeks from our sample. And while the estimate is still negative for the final exam weeks, it is no longer significant. This finding is in line with Lien and Zheng Reference Lien and Zheng(2018), who find that under stress, consumption patterns change.
To explore whether the insignificant results for the “Dinner”, “Sunday” and “Finals” sub-samples are due to the reduced sample sizes, we also estimate two additional regressions in which we add interaction terms for Dinner, Sundays, and Finals with  $d_{2018}d_{cookie}$ to the regression in Equation (1). The Online Appendix shows in Table B.3 that while the partial effect of
  $d_{2018}d_{cookie}$ stays mostly the same, the effects of “Dinner”, “Sunday,” and “Finals” are still insignificant. We also study whether the effect is different for “take-awayable” cookies by focusing on this sub-sample, and our results do not change in any considerable way.
Our last sub-sample only includes Fall semesters, to address the potential concern that cookie consumption drops in the Spring for reasons unrelated to the relocation. Table 4 shows that this does not affect our results, and we still see a drop in cookie consumption, with coefficient estimates similar in magnitude.
Table 4 Estimated effect of relocation on cookie consumption, comparing consumption during Fall 2017 with Fall 2018
Robust standard errors in parentheses.
Number of observations is 2089 for the first column, and 2063 for the rest.
4.4. Robustness
To explore how robust our results are, we first estimate the effects of relocating cookies using a linear regression model and a negative binomial one. The results are similar to our baseline, so we only report these results in the Online Appendix, section B.
Our last exercise is a placebo test. A potential criticism of our results is that the consumption of cookies relative to pizza may be dropping because of exogenous reasons, unrelated to location. To explore this, we ignore data for Fall 2017 and compare Spring 2018 with Fall 2018 and Spring 2019. Non-significant coefficients in Table 5 reject the idea that the overall consumption of cookies is dropping and favor our interpretation that the drop is due to the relocation (the number of observations is 2,188 for the first column, and 2,149 for the rest).
Table 5 Placebo: Estimated effect of relocation on cookie consumption, assuming the change happens after Spring 2018 as opposed to Fall 2017

Robust standard errors in parentheses. p<0.01, p<0.05, *p<0.1.
5. Conclusion
College is the first time away from home—and home-cooked meals—for most students. Many end up eating out, and they commonly go to fast food restaurants. Worried about this, several university Dining Halls present relatively healthy alternatives that parents can pay for a year in advance, and UNH is no exception. But this may not be enough: once inside, students are easily tempted by unhealthy options. This paper finds that there are simple, cost-effective policies that can improve eating habits. In particular, we find that by simply moving desserts out of sight, their consumption can be significantly reduced.
Supplementary material
The supplementary material for this article can be found at https://doi.org/10.1017/esa.2025.5.
Acknowledgements
We thank Karen Conway for excellent comments; Eric Gibson, Kevin Jacques, and Andrea Olsson for providing the data; participants at the 2019 AMA Conference in Buenos Aires for their feedback; and Bikramjit Saha and Andrew Clina for excellent research assistance.


 Open access