

Epiphytes are key components of tropical forest ecosystems (Gentry & Dodson Reference GENTRY and DODSON1987), although they remain relatively poorly studied (Barker & Pinard Reference BARKER and PINARD2001). Methodological advances have facilitated a recent increase in studies of environmental and anthropogenic influences on epiphyte relationships with host trees. Altitude, water availability, bark texture, crown area and heterogeneity, and host size all positively influence epiphyte species richness (Callaway et al. Reference CALLAWAY, REINHART, MOORE and PENNINGS2002, Gentry & Dodson Reference GENTRY and DODSON1987, Woods et al. Reference WOODS, CARDELUS and DEWALT2015), with negative influences also arising from excess precipitation, and anthropogenic deforestation and degradation (Benzing Reference BENZING1998, Dias-Terceiro et al. Reference DIAS-TERCEIRO, PEIXOTO, GOMES, MENEZES, NECO, PESSOA, FABRICANTE and ALBUQUERQUE2015, Gentry & Dodson Reference GENTRY and DODSON1987). However, these studies have focused almost exclusively on the neotropics (Nadkarni et al. Reference NADKARNI, PARKER and LOWMAN2011). Epiphyte research elsewhere concentrates more specifically on cataloguing geographic distributions (Hsu & Wolf Reference HSU and WOLF2009) or species-specific ecology (Fayle et al. Reference FAYLE, CHUNG, DUMBRELL, EGGLETON and FOSTER2009, Hsu et al. Reference HSU, TAMIS, RAES, DE SNOO, WOLF, OOSTERMEIJER and LIN2012). Therefore, given that each major tropical zone is subject to unique ecological processes and compositions (Corlett & Primack Reference CORLETT and PRIMACK2011), we cannot yet generalize key factors influencing epiphyte diversity for the broader tropics.
Here, we use canopy surveys to determine whether the principal drivers of epiphyte-host relationships, as identified in the neotropics, are consistent in a palaeotropical forest. We examine the relative influence of multiple environmental variables on vascular epiphyte richness in a lowland Indonesian rain forest. We then construct multivariate models from these data to determine which variables best predict epiphyte richness. In doing so, we aim to test a null hypothesis that epiphytes in a palaeotropical study site will be influenced by the same environmental variables as those identified as significant in the neotropics.
Fieldwork was completed on Pulau Buton, a 5600-km2 island, located off the south-eastern coast of mainland Sulawesi, Indonesia. Approximately 70% of Buton is covered by seasonal lowland rain forest, with a dry season running June–September, and a wet season running November–April. Average annual rainfall ranges between 1500 and 2000 mm, and mean average temperatures range between 25°C and 27°C (Whitten et al. Reference WHITTEN, MUSTAFA and HENDERSON2002). A review of the flora of Buton (Powling et al. Reference POWLING, PHILLIPS, PRITCHETT, SEGAR, WHEELER and MARDIASTUTI2015) indicates that over 300 vascular plant species occur on the island, including ~150 tree species and more than 50 epiphyte species.
We studied two sites in the South of Buton; one in the interior of the Lambusango Reserve, close to the Lapago forest camp, and the other within the smaller Kakenauwe Reserve, located near the village of Labundo-bundo. These two sites (henceforth ‘Lapago’ and ‘Kakenauwe’) were selected as their differences allow for the exploration of environmental variables beyond host morphology. The two sites differ both geologically (Lapago being underlain by a complex mosaic of limestones, sandstones and alluvial material, while Kakenauwe is entirely on karstic limestones), and hydrologically (Lapago, located in a steep-sided valley, allows for greater water retention than the relatively flat Kakenauwe site) (Powling et al. Reference POWLING, PHILLIPS, PRITCHETT, SEGAR, WHEELER and MARDIASTUTI2015). They also differ in levels of disturbance. Kakenauwe, bordering an asphalt road and in close proximity to two villages, has historically been logged and experiences ongoing low-level timber extraction, whereas Lapago experiences little anthropogenic disturbance, due to its isolation (Gillespie et al. Reference GILLESPIE, HOWARD, STROUD, UL-HASSANAH, CAMPLING, LARDNER, SCROGGIE and KUSRINI2015). Altitude is fairly consistent between sites, ranging between 220 m and 280 m.
Identical sampling techniques were completed at both study sites between June and August 2014, recording data for 44 trees along four transects. Points were systematically marked along transects at 50-m intervals, with the closest climbable tree to each point being sampled.
For each tree, data reporting: (1) above-ground biomass (agb), (2) altitude, (3) crown area, (4) height, (5) bark texture, (6) emergence and (7) epiphyte richness were measured. Variables 1–3 were sampled from the forest floor and the remainder from the canopy.
Agb (kg) was determined by the revised allometric equation for tropical tree agb (Chave et al. Reference CHAVE, RÉJOU-MÉCHAIN, BÚRQUEZ, CHIDUMAYO, COLGAN, DELITTI, DUQUE, EID, FEARNSIDE, GOODMAN, HENRY, MARTÍNEZ-YRÍZAR, MUGASHA, MULLER-LANDAU, MENCUCCINI, NELSON, NGOMANDA, NOGUEIRA, ORTIZ-MALAVASSI, PÉLISSIER, PLOTON, RYAN, SALDARRIAGA and VIEILLEDENT2015), using measured diameter at breast height (dbh), defined as 1.3 m or immediately above buttresses if these were present at 1.3 m, and a specific density value taken from the mean of Indonesian trees (Chave et al. Reference CHAVE, COOMES, JANSEN, LEWIS, SWENSON and ZANNE2009, http://datadryad.org/resource/doi:10.5061/dryad.234). Altitude (m asl) was recorded by GPS, and crown area was estimated by multiplying together the crown extents along North–South and East–West axes.
To measure the remaining variables, single-rope techniques were used to ascend to the highest safe point within the crown. A weighted tape measure was then lowered to record observer height and an estimate of remaining distance to the top of the tree was added to provide a metric of tree height. Bark texture was characterized using a three-point index of flakiness, roughness and fissuredness. Indices were ranked: 1 – characteristic not present; 2 – characteristic present; or 3 – characteristic strongly present (Male & Roberts Reference MALE and ROBERTS2005). Emergence (yes/no) was determined by whether the tree was >5 m taller than surrounding trees. Epiphyte richness was counted by scanning foliage above the observers’ height, and then slowly descending the tree while searching for epiphytes on all sides of the tree. Epiphytes were identified to a morphospecies level (Cardelus et al. Reference CARDELUS, COLWELL and WATKINS2006), in response to local restrictions on sampling within protected areas.
Following data collection, we examined the relative importance of different environmental variables through multivariate analyses, incorporating the seven variables measured at each tree, plus site (Lapago or Kakenauwe). Data exploration was performed and severely skewed variables transformed to achieve Gaussian distributions (epiphyte richness, host agb, bark fissuredness and crown area were transformed by log10 and bark flakiness by log10 twice).
Predictor variables with the highest Variance Inflation Factors (VIFs) were sequentially removed to create three models where no VIF exceeded 2, minimizing intercorrelation (Zuur et al. Reference ZUUR, IENO and ELPHICK2010). Models 1 and 2 prioritized retention of different, non-collinear, host-size predictor variables (host agb and crown area), while model 3 focused solely on bark texture. Bidirectional elimination by stepwise regression further reduced these models to form Minimum Adequate Models (MAMs), which were found, by analysis of deviance, to have no significant difference from the full models. Gaussian Generalized Linear Models (GLMs) were run for each MAM, calculating the percentage deviance of epiphyte species richness they were able to explain. Where MAMs retained more than one predictor variable, GLMs were also run removing one variable at a time to calculate their relative influence on the deviance of the response variable. P values from each GLM were used in false discovery rate end-point adjustment to create a new alpha value of 0.029 by which the significance of each variable was determined. All analyses were carried out in R version 3.2.1.
From our sample of 44 trees (18 in Lapago and 26 in Kakenauwe), a total of 275 individual epiphytes from 74 taxa (60 in Lapago and 41 in Kakenauwe) were recorded. Trees sampled in Lapago hosted a significantly higher number of epiphyte species (8.94 ± 2.42) compared with those in Kakenauwe (4.12 ± 1.17) (Mann–Whitney U = 73.5, P < 0.001). GLMs (Table 1; Figure 1) show that epiphyte richness was mainly influenced by tree size (as indicated by crown area and host agb), and variables associated with the attributes of the two study sites.
Table 1. Gaussian Generalized Linear Models, simplified into minimum adequate models using elimination by stepwise regression, to explain deviance in epiphyte species richnesslog10 on host trees on Buton Island, Indonesia. Akaike Information Criterion (AIC) shows the parsimony of each model. Asterisks (*) denote significant P values (α FDR = 0.029).
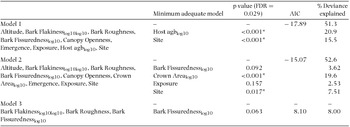
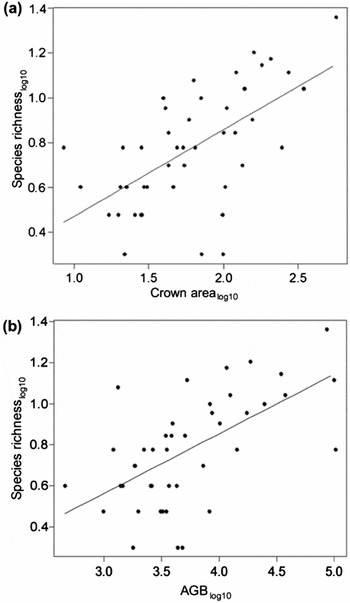
Figure 1. Epiphyte species richnesslog10 versus host crown arealog10 (m2) (a) and host agblog10 (kg) (b) on Buton Island, Indonesia. GLM regression lines shown on both graphs.
Our findings support the hypothesis that the principal drivers of epiphyte–host relationships identified in the neotropics (i.e. host size, crown area and disturbance level) remain consistent in our palaeotropical study site on Buton Island. The significance of most of these findings is expected, e.g. host size and crown area are known to relate to available substrate accumulation and surface area of branches and trunk for phorophyte colonization (Flores-Placios & García-Franco Reference FLORES-PLACIOS and GARCÍA-FRANCO2006, Goodman et al. Reference GOODMAN, PHILLIPS and BAKER2014), and disturbance level is known to influence host size, resulting in declining epiphyte populations (Es'kov Reference ES'KOV2013). Interestingly, bark texture, previously indicated as being a driver of epiphyte diversity in the neotropics (Callaway et al. Reference CALLAWAY, REINHART, MOORE and PENNINGS2002, Gentry & Dodson Reference GENTRY and DODSON1987), was found not to be significant in this study, although this could be due to the categorical nature of the bark data collected. Bark fissuredness was, however, selected to be used in minimum adequate models (Table 1) due to its strength of correlation with species richness, suggesting some cross-validation of the neotropical conclusions. Another variable shown to be an important driver of epiphyte diversity in the neotropics is water availability (Callaway et al. Reference CALLAWAY, REINHART, MOORE and PENNINGS2002, Laube & Zotz Reference LAUBE and ZOTZ2003). We could not test this directly in this study due to the lack of local year-round meteorological data. However, it is likely that Lapago, which possesses more alluvial sediment and a central river within its steep sided valley, has better water availability than the fast-draining limestones of Kakenauwe (Powling et al. Reference POWLING, PHILLIPS, PRITCHETT, SEGAR, WHEELER and MARDIASTUTI2015). Thus the significance of the site variable may be partially explained by differences in water resources.
In conclusion, this study demonstrates, by assessing a wide range of variables for the first time in palaeotropical literature, that epiphyte richness on Buton is most strongly influenced by the same key drivers as those described in the neotropics. While some variables require further investigation, our findings suggest that the best means of maintaining high epiphyte diversity in the palaeotropics is by protecting primary forests which support high densities of large, broad-crowned trees; a conservation recommendation echoed for other taxa (Barlow et al. Reference BARLOW, MESTRE, GARDNER and PERES2007) although not specifically for epiphytes of the palaeotropics before. While further research is required to develop a full understanding of regional influences on epiphyte diversity, this recommendation provides important insight for forest managers to account for enigmatic and often overlooked canopy species.
ACKNOWLEDGEMENTS
Fieldwork was supported by Operation Wallacea, under RISTEK permit 178/SIP/FRP/SM/V1/2014. The authors would like to thank Charlotte Palmer, Dave Tosh, Ben Rose and Sven Batke for their support of this project.


