

INTRODUCTION
The occurrence and survival of multiple species in tropical landscapes owe primarily to landscape heterogeneity. The various landscape elements contribute towards resource diversity, multiple niches, competition and complementary mechanisms (Brown Reference BROWN2014, Gardner et al. Reference GARDNER, BARLOW, CHAZDON, EWERS, HARVEY, PERES and SODHI2009, Gentry Reference GENTRY1992). Depending on human intervention, heterogeneous landscapes may be natural, semi-natural or fully managed – the pattern is also discernible from its species profile and ecological functions (Flynn et al. Reference FLYNN, PROKURAT, NOGEIRE, MOLINARI, RICHERS, LIN, SIMPSON, MAYFIELD and CLERCK2009, Jamoneau et al. Reference JAMONEAU, SONNIER, CHABRERIE, KOPP, SAGUEZ, MORON and DECOCQ2011, Lamy et al. Reference LAMY, LISS, GONZALEZ and BENNETT2016, Rodrigues et al. Reference RODRIGUES, CINTRA, CASTILHO, PEREIRA and PIMENTE2014).
Landscape heterogeneity to some extent correlates with functional diversity, a frequently used indicator of the functional status of a community or an ecosystem (Ackerly & Cornwell Reference ACKERLY and CORNWELL2007, Cornwell & Ackerly Reference CORNWELL and ACKERLY2009, Mason et al. Reference MASON, MOUILLOT, LEE and WILSON2005, Mouchet et al. Reference MOUCHET, VILLEGER, MASON and MOUILLOT2010, Petchey & Gaston Reference PETCHEY and GASTON2006). The type, range and abundance of traits often govern ecosystem services and form a connecting link between biodiversity and ecosystem function (known as the BEF relationship) (Bello et al. Reference BELLO, LAVOREL, DIAZ, HARRINGTON, CORNELISSEN, BARDGETT, BERG, CIPRIOTTI, FELD, HERING, DA SILVA, POTTS, SANDIN, SOUSA, STORKEY, WARDLE and HARRISON2010, Diaz et al. Reference DIAZ, LAVOREL, BELLO, QUETIER, GRIGULIS and ROBSON2007). Thus, the diversity of functional traits often outperforms species richness in explaining the mechanism of the BEF relationship (Cadotte et al. Reference CADOTTE, CARSCADDEN and MIROTCHNICK2011, Díaz & Cadibo Reference DÍAZ and CABIDO2001, Lacroix & Abbadie Reference LACROIX and ABBADIE1998).
Reproductive traits, usually a critical factor in plant distribution, community composition and survival also facilitate fundamental ecological functions including plant–animal interactions, food chain maintenance, population control and multiple ecosystem services (Barrett Reference BARRETT2010, Garnier & Navas Reference GARNIER and NAVAS2012). These traits, often sensitive to perturbation in a modified landscape, can be used as surrogates for studying the BEF relationship under varied circumstances (Aguilar et al. Reference AGUILAR, ASHWORTH, GALETTO and AIZEN2006, Girao et al. Reference GIRAO, LOPES, TABARELLI and BRUNA2007, Kolb & Diekmann Reference KOLB and DIEKMANN2005, Lopes et al. Reference LOPES, GIRÃO, SANTOS, PERES and TABARELLI2009, Mayfield et al. Reference MAYFIELD, ACKERLY and DAILY2006).
Culturally protected forest patches (or sacred groves, henceforth SG) are one of the integral components in the heterogeneous landscape in the tropics (Verschuuren & Wild Reference VERSCHUUREN and WILD2012). While the functionality and vulnerability of the SGs are identical to other remnant woodlands (Anand et al. Reference ANAND, KRISHNASWAMY, KUMAR and BALI2010, Benayas et al. Reference BENAYAS, BULLOCK and NEWTON2008, Bodin et al. Reference BODIN, TENGO, NORMAN, LUNDBERG and ELMQVIST2006, Sreevidya et al. Reference SREEVIDYA, PATTABHI and RAY2016), by being a part of past contiguous forests and enjoying social protection, the majority of the groves harbour plant assemblages with diverse morphological and reproductive traits. Empirical studies, on this line, have mostly focused on species enumeration (Ray et al. Reference RAY, CHANDRAN and RAMACHANDRA2014a), a few on ecological and ecosystem functions (Blicharska et al. Reference BLICHARSKA, MIKUSIŃSKI, GODBOLE and SARNAIK2013, Cardelús et al. Reference CARDELÚS, SCULL, HAIR, GEORGE, LOWMAN and ESHETE2013, Ryan et al. Reference RYAN, PRITCHARD, MCNICOL, OWEN, FISHER and LEHMANN2017); whereas landscape-level investigations are poorly represented except for a few such as connectivity in coffee-agriculture-forest matrix (Bhagwat et al. Reference BHAGWAT, KUSHALAPPA, WILLIAMS and BROWN2005), and survival of regional endemics (Ray et al. Reference RAY, CHANDRAN and RAMACHANDRA2014b). However, the key issues, such as the relationship between species diversity and the trait pattern and richness in remnant patches remain under-studied, while the gained insights would justify sacred groves’ contribution to regional biodiversity and maintenance of ecosystem function in modified landscapes.
In the current study, we have focused on functional aspects of sacred groves of Palakkad district, Kerala, India. Palakkad, an agricultural centre of Kerala, is dominated by a moderate to highly modified landscape mosaic with agriculture, plantations, home gardens, rural settlements and SGs. The majority of the SGs are remnants of earlier forest patches, harbouring a variety of biota yet in a much degraded state (Divya & Manonmani Reference DIVYA and MANONMANI2013, Premakumar & Vinothkanna Reference PREMAKUMAR and VINOTHKHANNA2015, Scaria et al. Reference SCARIA, KUMAR and VIJAYAN2014). We have selected various reproductive traits and tested the following hypotheses: (1) taxonomic diversity in sacred groves can act as surrogate for functional diversity (in terms of reproductive traits); (2) given the state of degradation and prevailing disturbance, human intervention rather than environment governs the trait distribution pattern in the study area.
STUDY AREA
Field investigations were carried out in three districts, Palakkad, Mallapuram and Thrissur of Kerala, India covering central lowland and a 30-km-wide gap (Palghat gap) in the Western Ghats mountain chain of India (Figure 1). The Palghat gap has immense importance in the distribution pattern of flora and fauna as it geographically divides the region into a north-south dimension i.e. the northern and southern Western Ghats. The Western Ghats is one among 35 global hotspots of biodiversity (www.cepf.net).

Figure 1. The geographic location of the state of Kerala (light blue in colour) in India (inset image). The broken line indicates the boundary of the Western Ghats (www.cepf.net) and the position of the Palghat gap is indicated by an oval area (coloured dark blue) in the Western Ghats. The locations of sacred groves in the Palghat gap, Kerala, India are denoted by stars.
The Palghat gap plays an important role in moderating the climate of Palakkad and the western Tamil Nadu. The moisture laden south-west monsoon winds pass through the gap influencing the amount of rainfall in western Tamil Nadu compared with other parts. Similarly, climatic phenomena controlled by the Bay of Bengal also influence the Palakkad region because of the gap (Nair Reference NAIR2006, Raj & Azeez Reference RAJ and AZEEZ2010). This region gains high ecological importance due to the climatic peculiarities with unique spatial patterns of rainfall compared with other parts of Kerala. The study area is part of a heterogeneous landscape with agriculture (paddy, vegetables, fruit, spices and condiments), plantations (coconut, rubber), water bodies, etc. Sacred groves or culturally protected remnant forest patches are dotted in the landscape in close association with rural settlements.
Sacred groves
Twenty-five sacred groves (known locally as kavus) – 17 from Palakkad, six from Thrissur and two from Mallapuram districts were selected for field investigations. The study area extends from 10.44–10.97°N and 76.06–76.70°E and the landscape is dominated by agricultural land, plantations, rural settlements, road and fallow lands. The selected groves are from the Gap area (Palakkad District), North of Palakkad (Malappuram District) and south of Palakkad (Thrissur District).
METHODS
Vegetation sampling
Vegetation sampling was carried out using a transect-cum-quadrat method and due to their small size (~ ≤1 ha), one line transect of 180 m was laid in each grove. Five quadrats of 20 × 20 m for tree (≥30 cm gbh) inventory were laid at equal distances alternately along left and right of this transect. For comparative assessment, one control plot (one control plot per grove) was laid in vegetation patches outside the grove (home gardens, scattered trees, isolated small patches). Due to the wide variation in size and nature of the surrounding vegetation patches attempts were made to lay each control transect in the biggest patch wherever possible. All documented species were identified using regional floras and consultation with experts. The woody species assemblages from each grove and control plot were further used for accumulation of information on reproductive traits.
Functional-trait selection and data collection
Plant-pollinator and plant-disperser interactions have a crucial role in shaping plant communities in diverse ecosystems and environments. Traits considered in this study were pollination mechanism, dispersal mechanism, fruit size, seed number and seed size, based on their role in maintaining basic ecological functions across the landscape (Girao et al. Reference GIRAO, LOPES, TABARELLI and BRUNA2007, Mayfield et al. Reference MAYFIELD, DWYER, CHALMANDRIER, WELLS, BONSER, CATTERALL, DECLERCK, DING, FRATERRIGO, METCALFE, QUEIROZ, VESK and MORGAN2013, Warring et al. Reference WARRING, CARDOSO, MARQUES and VARASSIN2016). Moreover, availability of information and possibility of quantification were other determining factors for trait selection. The trait states and their distribution were quantified in studied sacred groves and control sample areas.
Pollination and dispersal mechanisms were recorded through field investigations and by review of regional floras and research papers. We considered all major agents of pollination (i.e. abiotic and biotic) and sub-categorized them according to our field observation and literature (e.g. wind, self, insect, bird, bat, small mammals etc.). Similarly, for dispersal, both anemochorous and zoochorous modes were considered for study as they were present in the study area. Like pollination, dispersal modes were sub-categorized (e.g. wind, bird, bat, small mammals, mechanical, human-mediated etc.) to capture the local diversity in the study area. Data gaps were addressed by assigning the type with the flower and fruit structures as reported in the literature (Balamurali et al. Reference BALAMURALI, KRISHNA and SOMANATHAN2015, Wheelwright Reference WHEELWRIGHT1985). Also, multiple pollinators and dispersers for a species have been recorded accordingly. All pollination and dispersal trait states were considered for functional analysis.
Fruit and seed size data were gathered from the field primarily by measurements made on fruits and seeds (10 samples per species) or from herbarium records, published floras and research papers (Nayar et al. Reference NAYAR, BEGAM, MOHANAN and RAJKUMAR2006, Ramachandran & Nair Reference RAMACHANDRAN and NAIR1988, Subramanian et al. Reference SUBRAMANIAN, VENKATSUBRAMANIAN and NALLASWAMY1987, Vajravelu Reference VAJRAVELU1990). Fruit and seed size categories were made based on the length and width of dry fruit and seeds. The categories for fruit size were: very small, 0.15–2 × 0.15–2 cm; small, 2.1–4 × 2.1–4 cm; medium, 4.1–6 × 4.1–6 cm; big, 6–8 × 6–8 cm; huge, >8 × >8 cm long in any dimension. The categories for seed size were: ‘very small’, not measurable; ‘small’, 0.1–1 cm × 0.1–1 cm; ‘medium’, 1.1–2 cm × 1.1–2 cm; ‘big’, 2.1–3 cm × 2.1–3 cm; and ‘huge’, > 3 cm long in any dimension (Cornelissen et al. Reference CORNELISSEN, LAVOREL, GARNIER, DIAZ, BUCHMANN, GURVICH, REICH, TER STEEGE, MORGAN, VAN DER HEIJDEN, PAUSAS and POORTER2003, Mayfield et al. Reference MAYFIELD, ACKERLY and DAILY2006). For seed numbers, single, double, few (3–5), more (6–8) and many were used for data categorization.
Environmental parameters
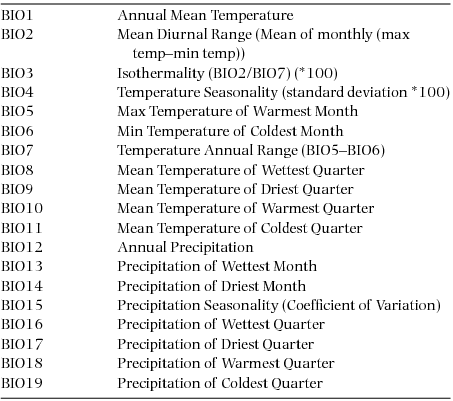
For each grove, information on 19 bioclimatic variables was collected from the Worldclim dataset (version 1.4) related to rainfall, temperature, and seasonality (Appendix 1). Principal component analysis (PCA) was conducted to address the multiple collinearities among the variables. The first two axes explained 81% variation of the data. The grove scores on the first two axes were extracted and two new variables PC1 and PC2 were created for further analysis.
Estimation of disturbance
Five factors such as spatial extent, encroachment, plantation, invasive species and cultivation were prioritized for disturbance assessment based on their impact on grove ecosystem. The spatial extent of the groves was measured by following steps, area survey with GPS (Garmin e-Trex), transferring the survey information to mapping software (MapInfo version 11.0), calculating the area of the polygon and validation of the result with available land documents. A similar exercise was done for encroachment, plantation, invasive species and cultivation with minor modifications whenever required. The magnitude of the factor was quantified by comparing it with the total area of the grove. These factors were rescaled based on the level of disturbance (Table 1).
Table 1. Parameters prioritized for disturbance assessment in sacred groves.

Analysis of vegetation data
Data collected from each transect of sacred groves were analysed using EstimateS version 9.1.0 to assess the taxonomic diversity – (species richness and Shannon–Wiener index). Average trait state was estimated for each functional trait in grove and control plots. A relative functional score of each grove and control plot was calculated based on trait state richness. Multivariate functional diversity indices (henceforth FD indices) were calculated with trait variables (pollination type, dispersal type, fruit size, seed number and seed size) through the FD package of R using the function dbFD (Laliberté & Legendre Reference LALIBERTÉ and LEGENDRE2010). Four functional diversity indices were considered for data analysis: FRic: functional richness indicates volume of functional trait space of a community occupied; FEve: functional evenness represents the evenness of abundance distribution in the functional trait space; FDis: functional dispersion interprets how species are dispersed (or spread) in the functional space; and FDiv: functional divergence relates how abundance is distributed within the functional trait space.
To understand the significance of the functional patterns, observed values from each grove were compared with corresponding values from 999 random assemblages. The randomization was made through the independent swap option of package picante in R, using all the species recorded across all the groves, while keeping intact species occurrence frequency and sample species richness for each grove. The significance test was done by calculating standardized effect size (SES) for each grove. The calculation takes the form: SES = (Obs–Exp)/SDexp, where Obs is the functional diversity index values obtained from observed data, Exp is the mean of the 999 simulated assemblages and SDexp is the standard deviation of the 999 indices from the simulated communities. Assuming normal distribution of the deviations, it is expected that 95% of SES values should fall between −1.96 and +1.96. Outside this range, values were considered as statistically significant at P < 0.05 (Ding et al. Reference DING, FEELEY, WANG, PAKEMAN and DING2013). Moreover, the significance of the comparison was tested by multiple hypothesis testing, Benjamini–Hochberg method (Benjamini & Hochberg Reference BENJAMINI and HOCHBERG1995).
Analysis of disturbance data
The magnitude of disturbance was analysed through scoring by assigning equal weight to all disturbance parameters given. The value was expressed in terms of relative disturbance ((scored value/maximum disturbance value) × 100) (Ray et al. Reference RAY, CHANDRAN and RAMACHANDRA2014b). Due to the categorical nature of the disturbance parameters a categorical principal component analysis (CATPCA) was conducted to identify the principal disturbance factors and their association with groves (SPSS trial version 17).
Association of climate and disturbance with functional traits
Each individual trait (number of trait states) and its relation with disturbance was tested through polyserial correlation due to mixed nature of the variables (e.g. categorical vs. continuous). Both univariate (Pearson correlation) and multivariate analysis (NMDS) were conducted among disturbance (relative disturbance score), climate (PC1 and PC2 environmental variables), taxonomic (Shannon index) and functional diversity indices (FRic, FEve, FDiv and FDis). Data were log-transformed before multivariate analysis. Further, the trait–environment association was tested through RLQ and fourth-corner analysis (Dray et al. Reference DRAY, CHOLER, DOLEDEC, PERES-NETO, THUILLER, PAVOINE and BRAAK2014). All analyses were conducted in R version 3.3.1 using packages polycor, Hmisc, vegan and ade4.
RESULTS
Species richness and distribution of reproductive traits
A total of 87 tree species from 38 families were recorded in the studied sacred groves, with the almost equal representation of evergreen (~55%) and deciduous species (~44%) (Appendix 2). Observed species richness range was 7–27 (average 12.1) and Shannon diversity was 2.04–3.47 (average 3.19). Depending on the available trait data, the analysis was carried out for 79 species. Studied groves represented a higher number of trait states in comparison with control plots (Figure 2). Species- and abundance-based estimates showed a similar pattern in trait state distribution (Figure 3). Pollination trait state showed the dominance of insect-based mechanisms (89.1%), followed by wind (7.4%) and negligible contributions from bird- and small-mammal-based mechanisms. In less-disturbed groves, apart from dominant modes, bird- and small-mammal-based mechanisms (~ 4–6%) were recorded. In dispersal, bird- and small-mammal-mediated mechanisms were prevalent over others (31.8% and 26.5% respectively). The percentage of bat-mediated dispersal was drastically different between groves with low and high disturbance (~11–16% and 6–7% respectively). Both pollination and dispersal states had inverse relation with disturbance (rho = −0.563, SE = 0.137 and rho = −0.223, SE = 0.208). A majority of the fruits were in the very small to small size category (42% and 20% respectively). Fruit size distribution had a near homogeneous pattern but very small size has greater relative presence in highly disturbed groves. For seed number, species with a single seed were dominant followed by many-seeded members (50% and 23.2% respectively) and for seed size, small and medium types were prominent (51.1% and 18.6%). Disturbance and trait state richness were negatively correlated (rho = −0.596, SE = 0.116), while functional score (based on trait state richness) had positive association with functional dispersion (r = 0.46, P = 0.01).

Figure 2. Bar plots showing the distribution of various states of the reproductive traits (mean ± S.D.) across the studied sacred groves and control plots in Palakkad, Kerala. Black and white bars represent grove and control areas respectively. The length of the bar represents average number of states in a trait and the error bar represents standard deviation.

Figure 3. Relative presence of fruit and seed trait states in studied groves in Palakkad, Kerala (mean ± S.D.). Black and white bars present species and abundance based average values. The x-axis shows types of trait states and y-axis represents relative presence values. Error bar represents standard deviation. Fruit size(a), seed number (b) and size (c).
Functional diversity
Functional richness (FRic) had significant correlation with species diversity and disturbance (r = 0.65 and −0.65, P =0.0004 and 0.0004). Functional divergence (FDiv) and evenness (FEve) were independent of species richness and showed comparatively higher values (0.5–0.9 for FEve and 0.6-0.9 for FDiv) across the groves (Table 2). However, functional dispersion (FDis), which is a weighted version of functional richness (FRic), was differentially correlated with FDiv and FRic (r= 0.40, P <0.05 and r=0.62, P <0.001) and like FRic, related with species diversity but not so with disturbance. There was no significant difference between observed and simulated values for testing indices. All the observed FRic values were below the mean values of simulated assemblages (100% lower than expected) without any significant difference. FEve had significantly lower values than expected in two sacred groves (SES-FEve values: −2.40 and −2.27) but rest of the cases i.e. remaining FEve, FDiv and FDis showed mixed patterns (i.e. both upper and lower values than expected) without having any statistical significance (Appendices 3, 4).
Table 2. The result of the Pearson correlation analysis of functional diversity indices with environmental and disturbance variables studying at sacred groves of Palakkad, Kerala. PCA1 and PCA2 = first two orthogonal bioclimatic axes of PCA conducted with 19 bioclimatic variables for addressing redundancy; Dist = relative percentage of disturbance; Shannon. D = taxonomic diversity index; Func. score = relative score calculated based on trait state richness in each grove; Fric, Feve, Fdiv and Fdis = Functional richness, evenness, divergence and dispersion respectively. Values indicate correlation between the variables (r) and probability (P) (** = P ≤0.01, *** = P ≤0.001).

Result of multivariate analyses
Categorical principal component analysis (CATPCA) explained 67.4% of variance through its first two dimensions (Figure 4). Grove area, encroachment and invasive species were found to be major factors for dimension 1 whereas factors such as plantation and cultivation had near equal contribution to both the dimensions. Groves with higher functional richness values clustered together opposite to the major disturbance factors.

Figure 4. Result of the Categorical principal component analysis (CATPCA) of disturbance factors to identify major drivers of disturbance in studied sacred groves in Palakkad, Kerala. Dimensions 1 and 2 are orthogonal independent axes representing ~67% variance of the data. Inv_sp = invasive species, enc = encroachment, area = grove area, plantation = Teak (Tectona grandis L.) plantation, cultivation = cash crop cultivation area. Numbers indicate studied sacred groves.
NMDS revealed the presence of two distinct clusters in multivariate space. Functionally rich sacred groves (Com3, 4, 5, 10 and 15) were present opposite to the direction of disturbance variables while other groves scattered around disturbance as well as climatic factors (Figure 5). RLQ and fourth corner analyses did not detect any significant association between studied traits and environmental factors.
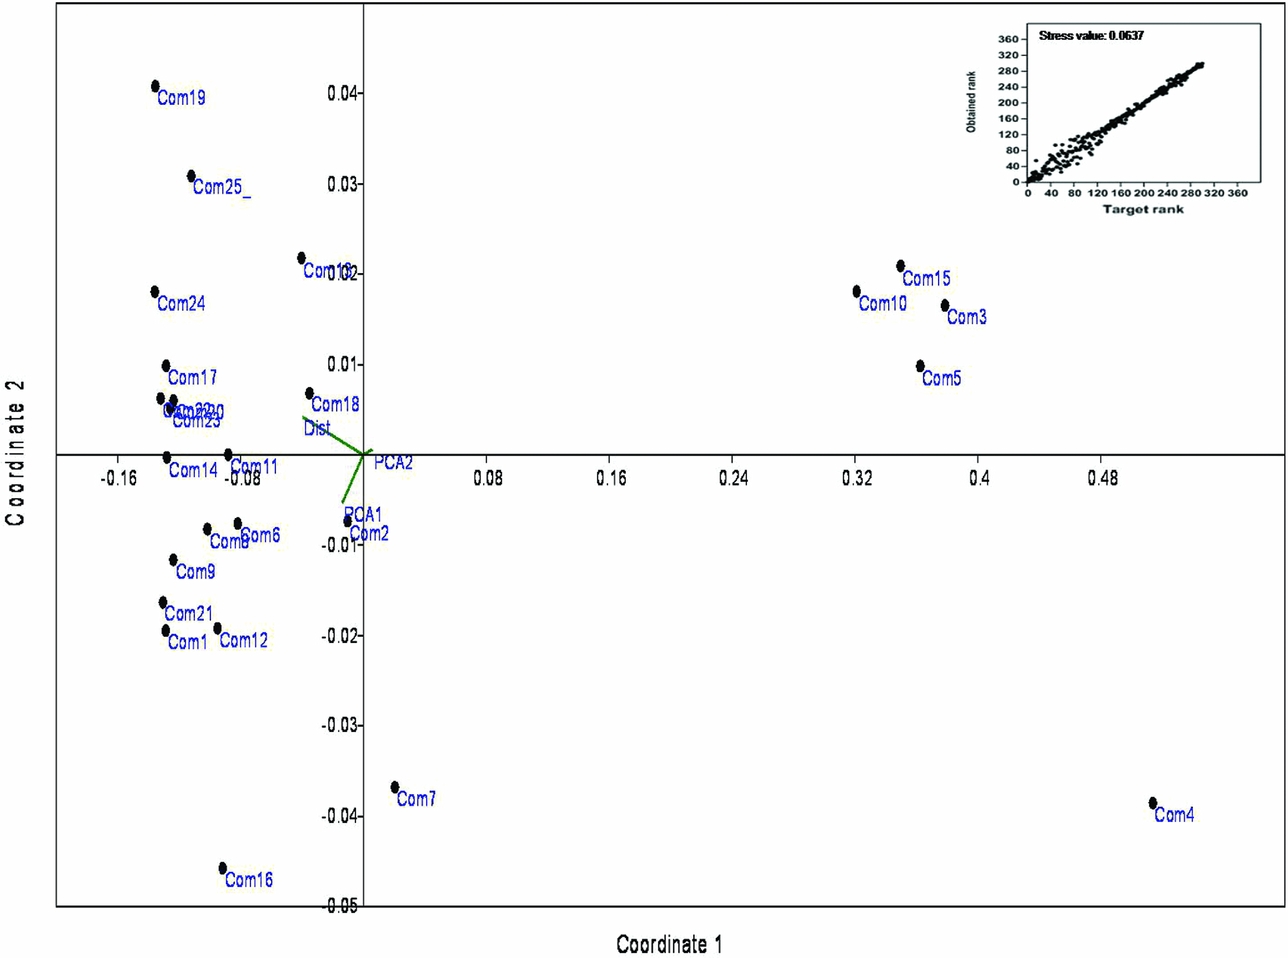
Figure 5. The result of the Non-matric Multidimensional Scaling (NMDS) analysis of functional diversity indices with environmental and disturbance variables. Coordinates 1 and 2 = number of dimensions used in the analysis. The stress of ordination is represented in Shepard plot with stress value (inset image). com1–25 = sacred groves; PCA1 and PCA2 = first two orthogonal bioclimatic axes of PCA conducted with 19 bioclimatic variables for addressing redundancy; Dist = relative percentage of disturbance.
DISCUSSION
While the role of the remnant patch in biodiversity and ecosystem services has been examined extensively, functional aspects become nascent in comparison. The groves in our study area are tiny isolated vegetation patches (mostly <1 ha) in the heterogeneous landscape dominated by agriculture and plantations. They are remnants of once continuous forests which have undergone further degradation over time owing to anthropogenic pressures, but are still revered and protected by local communities. Regional-scale ecological studies on the sacred groves of Kerala have covered biodiversity and environmental issues for a few culturally and geographically prominent ones but functional aspects have yet to be addressed (Chandrashekhara Reference CHANDRASHEKHARA2011, Rajendraprasad Reference RAJENDRAPRASAD1995).
Species richness and distribution of reproductive traits
A comparative assessment of woody species assemblage between groves and surroundings has revealed their supportive role in species survival. The average Shannon diversity (3.19) is comparable to other similar studies especially from altered or disturbed areas (Anbarashan & Parthasarathy Reference ANBARASHAN and PARTHASARATHY2012, Behera & Pradhan Reference BEHERA and PRADHAN2015, Mishra et al. Reference MISHRA, TRIPATHI, TRIPATHI and PANDEY2004, Sundarapandian et al. Reference SUNDARAPANDIAN, DAR, GANDHI, KANTIPUDI and SUBASHREE2013), where species diversity is greatly affected by frequent land-use change, area shrinkage and multiple ecological problems such as regeneration failure, edge effect and invasive dominance. The reproductive traits are distributed across the landscape where each grove represents ≥50% of the trait states on an average. The near identical nature of trait distribution pattern in species- and individual-based estimates confirm that species abundance has no significant influence on trait state distribution. The overall inverse relationship between disturbance and trait-state richness is reflected in two major ecological functions, i.e. pollination and dispersal. Fruit and seed trait distribution is nearly homogeneous across the groves with minor variations. Modes of pollination and dispersal have some explicit patterns, e.g. complete absence of bird and small-mammal pollinators, and near absence of bat-mediated dispersal in highly disturbed groves. The pollination guild is dominated by insects of Lepidoptera, Diptera, Hymenoptera orders as well as abiotic agents (e.g. wind). The insect pollinators include commonly available taxa in the tropical semi-natural landscape which facilitate cross-pollination to a limited distance, e.g. bees, butterflies, moths, bumble bees, wasps, thrips, beetles and bugs. A similar dominance of insect and wind pollination in altered landscapes has also been reported from other areas, but pollinator type tended to vary in response to prevailing disturbance (Geslin et al. Reference GESLIN, GAUZENS, THEBAULT and DAJOZ2013, Moreira et al. Reference MOREIRA, BOSCOLO and VIANA2015, Xiao et al. Reference XIAO, LI, CAO and DONG2016). Girao et al. (Reference GIRAO, LOPES, TABARELLI and BRUNA2007) showed a reduced number of tree species and individuals pollinated by bats and Sphingids in fragments and an absence of fly-, bird- and non-flying-mammal-pollinated trees together with the changes in floral traits and sexual systems, that may be a higher-order effect promoted by habitat fragmentation. A similar observation was recorded by Lopes et al. (Reference LOPES, GIRÃO, SANTOS, PERES and TABARELLI2009), who found ~ 60% of tree species in altered habitats have insect pollination and reproductive trait states indicated domination of generalist pollinators. The presence of generalist members in the woody species assemblage with their multiple pollinator preferences indicates their reproductive success in the landscape due to pollinator availability during the flowering season. As a consequence of this generalization process, biotic homogenization and shrinkage in plant-pollinator network spectrum are partly evident in the study area.
On the other hand, dispersal is largely dominated by birds and small mammals with moderate contribution from wind. The underlying reason could be an abundance of small juicy fruits in groves (mostly drupe and berry) which are a common diet of generalist dispersers such as birds and small mammals. Earlier studies in altered landscapes in the tropics have demonstrated that animal-mediated seed dispersal has multiple constraints due to direct or indirect changes in the ecosystem (e.g. fragmentation, hunting, alteration in resources). However, the effect is primarily driven by the type of plant species and the dispersers (Lindsell et al. Reference LINDSELL, LEE, POWELL and GEMITA2015, Tscharntke et al. Reference TSCHARNTKE, SEKERCIOGLU, DIETSCH, SODHI, HOEHN and TYLIANAKIS2008, Wheelwright Reference WHEELWRIGHT1985). Likewise, multiple studies have underscored that large-seeded plant species are more affected than small-seeded counterparts due to their limitation towards specialized dispersal agents; thus, increasing the possibility of survival of small-seeded members with generalist dispersers (Melo et al. Reference MELO, MARTINEZ-SALAS, BENITEZ-MALVIDO and CEBALLOS2010, Seidler & Plotkin Reference SEIDLER and PLOTKIN2006). In our case, perhaps, the presence of an agriculture-plantation matrix dotted with home gardens, scattered trees and prominence of small-seeded plants in grove provides overall support to the generalist dispersers.
The disturbance has a significant impact on fruit size distribution which presumably constrains animal-mediated dispersal in highly disturbed groves (com12, 16, 20, 21, 22 and 23) where mechanical dispersal mode shows a high frequency. Similarly, smaller fruits are dominant in highly disturbed groves indicating the involvement of agents such as wind or birds. Pertinently, in widely distributed species such as Ailanthus triphysa, Dalbergia sissoides, Holoptelia integrifolia, Hopea ponga, Bombax ceiba, Alstonia scholaris and Albizzia lebbeck lightweight seeds may facilitate wind dispersal.
Relation between species and functional diversity indices
Functional richness (FRic) and species diversity are highly correlated in the study area. With the increase in taxonomic diversity, functional characters tend to occupy more empty spaces indicating alternative strategies performing ecological functions, a trend observed in earlier studies as well (Bu et al. Reference BU, ZANG and DING2014, Mason et al. Reference MASON, MOUILLOT, LEE and WILSON2005, Pakeman Reference PAKEMAN2011, Villeger et al. Reference VILLEGER, MASON and MOUILLOT2008, Whitfeld et al. Reference WHITFELD, LASKY, DAMAS, SOSANIKA, MOLEM and MONTGOMERY2014). The impact of disturbance over functional richness is evident from CATPCA and NMDS analysis where functionally rich groves are clustered opposite to the disturbance factors in multivariate space. However, the strong relation between FRic and disturbance is not reflected in species diversity index; which may imply that disturbing factors have a greater effect on functional parameters than taxonomic diversity. Functional evenness (FEve) and divergence (FDiv) lack strong relationships with other indices and disturbance. The relatively higher value could be a result of homogeneous trait distribution indicating an apparent absence of habitat filtering or related mechanism (Warring et al. Reference WARRING, CARDOSO, MARQUES and VARASSIN2016). But, their high values in these small groves could also be an indicator of loss of functional redundancy and ecosystem resilience in the near future (Magnago et al. Reference MAGNAGO, EDWARDS, EDWARDS, MAGRACH, MARTINS and LAURANCE2014).
Comparative assessment of observed and simulated values of indices revealed no significant difference suggesting the absence of convergence and divergence of traits among the communities. However, as the community formation and survival is governed by multiple processes, such as environmental filtering, limiting similarity, neutral assemblages and demographic stochasticity, the visible obscure pattern could be a cumulative effect (Mi et al. Reference MI, SWENSON, JIA, RAO, FENG, REN, BEBBER and MA2016, Swenson Reference SWENSON2012). In sacred groves of a tropical landscape under similar environmental conditions, the pattern can also be explained in light of dynamic land-use change causing random loss of trees and understorey vegetation irrespective of trait characters (Anand et al. Reference ANAND, MADHUSUDAN, KUMAR, CHENGAPPA, KUSHALAPPA and SANKARAN2014, Ray et al. Reference RAY, CHANDRAN and RAMACHANDRA2014b).
Association of diversity with environment and disturbance
Environmental effects on species and trait distribution patterns seem to be minimal in the study area as suggested by correlation, NMDS, RLQ and fourth corner analyses. The geographic location may play a critical role – the presence of the Palghat gap breaks the continuity of the Western Ghats mountain chain, disrupting the characteristic temperature and rainfall gradient. Due to the Western Ghats, the south-west and north-east monsoons create a distinct temperature and rainfall gradient in the southern part of Indian Peninsula which is the major causal factor of rich biodiversity in the area (Davidar et al. Reference DAVIDAR, PUYRAVAUD and LEIGH2005, Gunawardene et al. Reference GUNAWARDENE, DANIELS, GUNATILLEKE, GUNATILLEKE, KARUNAKARAN, NAYAK, PRASAD, PUYRAVAUD, RAMESH, SUBRAMANIAN and VASANTHY2007). However, no such pattern is visible for species and trait distribution in the gap area perhaps due to lack of the visible physical barrier.
In contrast, human intervention has made a visible impact on the grove system. Being part of a production landscape, the area is under constant pressure from land conversion for agriculture, plantation and settlement-related issues which greatly affect the spatial extent of the groves (Chandrashekara Reference CHANDRASHEKHARA2011, Chandrashekara & Sankar Reference CHANDRASHEKARA and SANKAR1998, Divya & Manonmani Reference DIVYA and MANONMANI2013). Similarly, other factors e.g. changes in the traditional mode of worship, peoples’ sensitivity and demographic patterns often lead to encroachment, cattle grazing and other related problems. Both indices, i.e. taxonomic and functional diversity explicitly reflect this disturbance effect, but the negative relation is stronger for functional aspects especially volume of functional space (functional score, FRic etc.). Thus, comparatively less disturbed groves with higher functional richness and evenness (though statistically not significant) may have better potential for functional stability and resilience. Both functional richness and evenness ensure redundancy and diverse response to ecosystem resilience.
The apparent randomness of the trait distribution may be due to anthropogenic intervention, where land conversion, tree felling (both natural and planned), and plantation have a key role in shaping plant community composition. The human-induced activities tend to make habitat specialist species become more vulnerable than generalist members forming simpler community structures. Nevertheless, the predominance of generalist species with multiple strategies of pollination and dispersal (as revealed by trait distribution pattern) highlights the maintenance of general ecological functions in the landscape. It also emphasizes the fact that taxonomic diversity is not a suitable indicator for understanding the functionality of a perturbed local ecosystem, as the estimation does not rely on their functional uniqueness/redundancy.
Implication for tropical landscapes
Landscape quality/utility assessment through a functional approach holds great promise for tropical biodiversity maintenance and anthropocentric demands. The thorough understanding of trait-mediated ecosystem functioning processes has the potential for optimizing ecosystem services and relevant ecological issues. In accordance with the general notion, we also find that the sacred groves in agriculture–plantation mosaics act as reservoirs of the regional species pool and support a plethora of reproductive traits which contribute to local ecosystem functions. The overarching effect of disturbance on FRic in comparison to taxonomic richness brought out the importance of functional diversity as an effective surrogate for assessment of the biodiversity-ecosystem relationship. It has also strengthened the prevailing notion that the remnant patches may have constraints in maintaining biodiversity-ecosystem function (Hill & Curran Reference HILL and CURRAN2003, Honnay et al. Reference HONNAY, JACQUEMYN, BOSSUYT and HERMY2005, Lopes et al. Reference LOPES, GIRÃO, SANTOS, PERES and TABARELLI2009, Tabarelli et al. Reference TABARELLI, SILVA and GASCON2004), but their collective presence in the area along with the ecological networks perhaps mitigate the problems to an extent and thus reinforce the key role of the groves in landscape mosaics (Benayas et al. Reference BENAYAS, BULLOCK and NEWTON2008, Bodin et al. Reference BODIN, TENGO, NORMAN, LUNDBERG and ELMQVIST2006, Fischer et al. Reference FISCHER, LINDENMAYER and MANNING2006, Ziter et al. Reference ZITER, BENNETT and GONZALEZ2013).
The study, to our knowledge, is the first of its kind in a sacred grove system from the tropics, uncovering its role in the BEF relationship. Although our focus is restricted to trait distribution pattern and diversity indices, it offers a fairly valuable clue to the functional status of these remnant patches. It also opens the window for an extension of the study towards bridging traits and ecological functions to elucidate the complex natural pattern. In a global hotspot like the Western Ghats, while sacred groves occupy only a small fraction of the landscape their role in ecosystem conservation under participatory framework cannot be undermined. However, in recent years, an increasing trend in grove conservation and restoration activities largely ignore functional aspects thus downplaying their importance in biodiversity maintenance and ecosystem functioning. This study thus attempts to address a hitherto understated issue of this tropical landscape with an aim to encourage further research and effective planning under varied socio-ecological scenarios.
ACKNOWLEDGEMENTS
The authors acknowledge the help from Sandip Pulla in statistical analysis in R and Avik Ray for his critical comments and suggestions on earlier versions of the manuscript. The authors also thank the anonymous reviewers for their comments to improve the manuscript.
Appendix 1. The 19 bioclimatic variables used for environmental analysis. BIO1–19 indicates various temperature and precipitation factors (both annual and seasonal) for climatic condition assessment as stated in Worldclim dataset (source: www.worldclim.org).
Appendix 2. Woody species reported from 25 sacred groves of the Palakkad, Kerala, India.

Appendix 3. Null model testing result for four functional diversity indices. Observed values of four indices from each grove (designated as com1-25) from study area at Palakkad, Kerala were compared with 999 simulated values (for each grove) to check for randomness. Fric, Feve, Fdiv and Fdis = Functional Richness, Evenness, Divergence and Dispersion; Obs = observed value of the index, P value = probability value at 0.05 level after comparison with mean value of 999 simulated values; P adj. = adjusted P value after correction for multiple hypothesis testing with Benjamini–Hochberg method; SES = standardized effect size value.


Appendix 4. Comparative assessment of observed functional diversity values with 999 random assemblages for each of the studied sacred groves in Palakkad, Kerala. Black circles are observed values, grey circles are 999 randomized values and short bars are the mean of the 999 randomizations. The x-axis represents 25 sacred groves and the y-axis shows index values. Functional richness (a), evenness (b), divergence (c) and dispersion (d). For functional richness all observed values are lower than expected, for functional evenness 44% observed values are lower than expected and 56% are higher than expected, functional divergence shows 48% observed values are lower than expected and 52% are higher than expected and functional dispersion has 64% observed values are lower than expected and 36% are higher than expected.


