INTRODUCTION
Periodic fluctuation in bird density often occurs in a variety of arid and semi-arid environments in Africa (Dean & Milton Reference DEAN and MILTON2001, Herremans Reference HERREMANS2004), Australia (Tischler et al. Reference TISCHLER, DICKMAN and WARDLE2013, Wiens Reference WIENS1991), and in both tropical (Del Rio & Butterfield Reference DEL RIO and BUTTERFIELD1999, Poulin et al. Reference POULIN, LEFEBVRE and McNEIL1993) and temperate America (Jaksic & Lazo Reference JAKSIC and LAZO1999, Marone Reference MARONE1992). In arid habitats, rainfall seasonality strongly influences resource abundance (Jaksic & Lazo Reference JAKSIC and LAZO1999, Morton et al. Reference MORTON, STAFFORD SMITH, DICKMAN, DUNKERLEY, FRIEDEL, McALLISTER, REID, ROSHIER, SMITH, WALSH, WARDLE, WATSON and WESTOBY2011, Pavey & Nano Reference PAVEY and NANO2009, Schwinning & Sala Reference SCHWINNING and SALA2004), and consequently affects the dynamics of bird populations and assemblages (Burbidge & Fuller Reference BURBIDGE and FULLER2007, Loiselle & Blake Reference LOISELLE and BLAKE1991, Poulin et al. Reference POULIN, LEFEBVRE and McNEIL1993). In such cases, fluctuations are directly caused by intra-habitat displacements and long-distance migrations (Dean et al. Reference DEAN, BARNARD and ANDERSON2009, Del Rio & Butterfield Reference DEL RIO and BUTTERFIELD1999, Poulin et al. Reference POULIN, LEFEBVRE and McNEIL1993, Tischler et al. Reference TISCHLER, DICKMAN and WARDLE2013), as well as by seasonal variation in survivorship and recruitment (Cox & Cresswell Reference COX and CRESSWELL2014, Grant et al. Reference GRANT, GRANT, KELLER and PETREN2000, Lepage & Lloyd Reference LEPAGE and LLOYD2009).
When studying patterns of bird abundance in tropical dry habitats it has been common for indices of relative abundance (e.g. birds per net-hour, records per time) to be used instead of abundance estimators (Del Rio & Butterfield Reference DEL RIO and BUTTERFIELD1999, Jaksic & Lazo Reference JAKSIC and LAZO1999, Marone Reference MARONE1992, Poulin et al. Reference POULIN, LEFEBVRE and McNEIL1993, Wardell-Johnson & Williams Reference WARDELL-JOHNSON and WILLIAMS2000). However, the effectiveness of relative abundance depends on the assumption of constant probability of detection (reviewed in Rosenstock et al. Reference ROSENSTOCK, ANDERSON, GIESEN, LEUKERING and CARTER2002), which cannot be guaranteed and does not usually reflect the true temporal and spatial variation in population density (reviewed in Norvell et al. Reference NORVELL, FRANK and PARRISH2003, Peele et al. Reference PEELE, MARRA, SILLETT and SHERRY2015). In tropical dry forests, the temporal changes in resource availability (Olmos et al. Reference OLMOS, SILVA and ALBANO2005, Poulin et al. Reference POULIN, LEFEBVRE and McNEIL1993, Williams & Middleton Reference WILLIAMS and MIDDLETON2008), in reproductive and foraging behaviour (Nascimento Reference NASCIMENTO2000, Souza et al. Reference SOUZA, TELINO-JÚNIOR, NASCIMENTO, LYRA-NEVES, JÚNIOR, FILHO and NETO2007), and in such structural aspects of vegetation as leaf cover, can alter the chances of recording a bird and influence detection probabilities (Rosenstock et al. Reference ROSENSTOCK, ANDERSON, GIESEN, LEUKERING and CARTER2002). Therefore, it is unlikely that the true extent of seasonal fluctuation in bird abundance has been documented in tropical dry environments.
Our study was undertaken in north-eastern Brazil, South America, where natural vegetation is composed of dry forests (Miles et al. Reference MILES, NEWTON, DEFRIES, RAVILIOUS, MAY, BLYTH, KAPOS and GORDON2006), and the annual periodicity in both rainfall (Leal et al. Reference LEAL, SILVA, TABARELLI and LACHER2005, Prado Reference PRADO, Leal, Tabarelli and Silva2003, Silva et al. Reference SILVA, SOUZA, BIEBER, CARLOS, Leal, Tabarelli and Silva2003) and food abundance (Olmos et al. Reference OLMOS, SILVA and ALBANO2005) probably results in fluctuations in bird abundance (Araujo et al. Reference ARAUJO, VIEIRA-FILHO, CAVALCANTI and BARBOSA2012, Farias Reference FARIAS2007, Olmos et al. Reference OLMOS, SILVA and ALBANO2005, Silva et al. Reference SILVA, SOUZA, BIEBER, CARLOS, Leal, Tabarelli and Silva2003). Despite the great importance of dry forests to Neotropical ecology (Miles et al. Reference MILES, NEWTON, DEFRIES, RAVILIOUS, MAY, BLYTH, KAPOS and GORDON2006), the majority of vertebrate studies within them have been restricted to simple listing of species (reviewed in Albuquerque et al. Reference ALBUQUERQUE, ARAÚJO, EL-DEIR, LIMA, SOUTO, BEZERRA, FERRAZ, FREIRE, SAMPAIO, LAS-CASAS, MOURA, PEREIRA, MELO, RAMOS, RODAL, SCHIEL, LYRA-NEVES, ALVES, AZEVEDO-JÚNIOR, TELINO JÚNIOR and SEVERI2012). In general, little has been published concerning bird population dynamics in any semi-arid Neotropical environment (Del Rio & Butterfield Reference DEL RIO and BUTTERFIELD1999, Jaksic & Lazo Reference JAKSIC and LAZO1999, Poulin et al. Reference POULIN, LEFEBVRE and McNEIL1993, Rodriguez-Ferraro & Blake Reference RODRIGUEZ-FERRARO and BLAKE2008).
Here we used a capture-mark-recapture protocol to evaluate local patterns of seasonal fluctuation in bird abundance and test the influence of some bird behavioural responses in determining this pattern. For this, we considered the following hypotheses: (1) bird abundance data will show high intra-annual variation independent of the method used to calculate abundance; (2) temporal patterns of variation in estimates and indices of relative abundance will be dissimilar and this will be due to temporal variation in detection probability; (3) time-specific differences in avian detectability will be associated with short-term behavioural responses.
METHODS
Study site
The caatinga (~800000 km2) in north-eastern Brazil, South America, is semi-arid and is dominated by tropical dry forest (Miles et al. Reference MILES, NEWTON, DEFRIES, RAVILIOUS, MAY, BLYTH, KAPOS and GORDON2006, Prado Reference PRADO, Leal, Tabarelli and Silva2003, Velloso et al. Reference VELLOSO, SAMPAIO and PAREYN2002). The study area is located in a 1166-ha conservation unit (Seridó Ecological Station; 6°35′S, 37°15′W), where the local vegetation is composed of savannas, dominated by herbaceous vegetation and patches of thorny shrubs (shrubby vegetation), and deciduous forest, dominated by trees with very little ground cover (woody vegetation, Santana & Souto Reference SANTANA and SOUTO2006). Shrubby vegetation is associated with shallow soils, which are richer in organic matter, while woody vegetation occupies hillsides where the soil is shallow and stony. In this region rainfall occurs between February and May, with an annual average of 733 mm, and mean monthly temperatures range from 25.9°C in June to 29.1°C in November (Santana & Souto Reference SANTANA and SOUTO2006).
Bird sampling
In each habitat type (shrubby vegetation and woody vegetation) we established a 350 × 250-m grid, with sampling points every 50 m (48 points per grid), each with a mist net (Ecotone® 18 × 3 m, mesh 19 mm). During each field visit we sampled both grids on six occasions, with visits being 2–3 d apart. In each grid sampling began at 05h00, and continued for 5 h, using all 48 nets. We conducted data collection over three field visits. These began on 14 July 2012, 26 January 2013 and 1 June 2013 (Figure 1). For each sampling event all birds caught were identified, and marked (first encounter) or recorded (subsequent encounters).

Figure 1. Monthly rainfall from January 2012 to July 2013 at the weather station of Caicó-RN, ~20 km from sampling area. Study site located in tropical dry forest at the Seridó Ecological Station, north-eastern Brazil. The dark horizontal bars correspond to the three field visits. Rainfall data source: www.inmet.gov.br.
We chose the sampling method to satisfy a series of assumptions of capture-mark-recapture analysis (Williams et al. Reference WILLIAMS, NICHOLS and CONROY2002). These included an equal capture opportunity for all individuals (net coverage was designed to provide the largest possible point cover within the surveyed area and so maximize overlap with home ranges of resident individuals), short duration of each field visit (short interval between first and last occasions), nets distribution was designed to minimize the ratio of periphery around the sampling area (traps in square grid rather than a line transect), and field visits of a fixed duration. We believe that the mist nets allowed us to sample the majority of the bird species assemblage, since the average tree height was less than 8 m.
The first field visit coincided with a typical dry period, during which deciduous leaf-fall was complete and the presence of migrant (migratory species that naturally reproduce in the area) and nomadic species was considered unlikely (Silva et al. Reference SILVA, SOUZA, BIEBER, CARLOS, Leal, Tabarelli and Silva2003, LFF & MP unpubl. data). The second field visit occurred during the regional rainy season when breeding migrant species are present. However, the occurrence of an intense drought resulted in the vegetation being unusually dry and totally leafless. The third field visit took place at the end of a typical rainy season, when breeding migrants and nomadic species were still present and vegetation was still green and in full leaf.
Models of capture-mark-recapture
Except for hummingbirds and the cactus parakeet (Eupsittula cactorum), all species captured were included in the analysis. We used full-likelihood heterogeneity closed-captures models (Otis et al. Reference OTIS, BURNHAM, WHITE and ANDERSON1978, Pledger Reference PLEDGER2000) in the MARK Program 8.0 (http://www.phidot.org/software/mark) to estimate capture probability (p), recapture probability (c), mixture parameter (π) and population size (N). The final parameter corresponded to the number of individuals of each species group type (these groups described below). In this analysis a population is considered closed when neither ingress (births or immigration) nor egress (death or emigration) occurs within the sampling population over the field visit. We believe that we have met this assumption since the sampling interval between each field visit was short and there were no field visits in the migratory and reproductive periods (Williams et al. Reference WILLIAMS, NICHOLS and CONROY2002).
We accounted for potential heterogeneity in detection probability by fitting a finite mixture model, because the existence of groups with differing capturability likelihoods should be included when comparing datasets from different species (Williams et al. Reference WILLIAMS, NICHOLS and CONROY2002). In heterogeneity models, individuals are divided into two or more groups (Mixtures, π) with relatively homogeneous capture probabilities (Norris & Pollock Reference NORRIS and POLLOCK1995, Pledger Reference PLEDGER2000). When two mixtures are considered (A and B), π represents the ratio of sampled individuals belonging to mixture A and 1 − π proportion of individuals in mixture B. Capture (p) and recapture (c) probability are estimated for each set; with set A comprising only individuals with a low probability of capture (p a) and recapture (ca), and set B comprising only individuals with a high probability of capture (p b) and recapture (cb) (Norris & Pollock Reference NORRIS and POLLOCK1995, Pledger Reference PLEDGER2000).
Candidate models tested the effects of the following covariates or parameters on detectability: behavioural response to capture, behavioural response to rain and grid habitat type. We tested the behavioural response to capture (the parameters of capturability) by considering: (1) the absence of response, that is when the parameter capture probability of an individual was equal to recapture probability (p = c), (2) a response, when p ≠ c. To test the behavioural response to rain, we compared samples when rain occurred on the day preceding sampling versus those where it had not occurred. For this categorization, we recorded rainfall occurrence in situ on each sample grid. We tested a habitat-type covariate that separated the data by sampling site (shrubby vegetation grid and woody vegetation grids). We included in the comparisons models with one covariate or with combinations of covariates, as well as a constant model. For all candidate models, population size was estimated only by habitat type. We evaluated the relative support of models using Akaike's Information Criterion for small sample sizes (AICc).
Each field visit was analysed individually. In addition, data from the three field visits were analysed in two ways: (1) all sampled species and (2) insectivores species only. The second and third field visits also were analysed considering only those species that were recorded in the first visit. The category ‘insectivores’ includes species that, based on the current literature, were strictly or predominantly insectivores (Appendix 1; Alessio et al. Reference ALESSIO, BELTZER, LAJMANOVICH and QUIROGA2005, Araujo Reference ARAUJO2009, Cavalcanti et al. Reference CAVALCANTI, PAIVA and FRANÇA2016, Novoa et al. Reference NOVOA, VELOSO and LÓPEZ-CALLEJA1996, Poulin et al. Reference POULIN, LEFEBVRE and McNEIL1993, Souto Reference SOUTO and de2010). Data on species shared with the first field visit probably restricted analysis to resident species (Appendix 1). However, some resident and locally rare species may not have been included in the category because they were not captured during the first field visit (e.g. Cantorchilus longirostris and Thamnophilus doliatus capistratus; Appendix 1). Species with more than 20 records were classified based on data from the current study and, the others were classified following the literature. Species with no more than five capture-recaptures and registered only out of the first dry season, were considered occasional. Non-resident species were classified without distinction of the type of displacement (nomadic/migratory). To confirm the assumption that a species was a resident, we compared our patterns of temporal occurrence with those of Figueiredo (Reference FIGUEIREDO2016), which covered the same region as the current study, and was based on field data and a literature compilation (Appendix 1).
Analysing data from all sampled species and from resident species allowed us to evaluate effects of migratory and/or nomadic species. Data from the insectivores guild permitted evaluation of the most common functional group in the region. Population responses of insectivores bird species in other semi-arid areas are most frequently associated with food supply and rainfall (Dean et al. Reference DEAN, BARNARD and ANDERSON2009, Poulin et al. Reference POULIN, LEFEBVRE and McNEIL1993).
RESULTS
We recorded 81 bird species during the three field visits, of which 75 were considered in the model analysis. For these, we recorded 2730 individuals in 3487 captures and recaptures of 19 bird families. In shrubby vegetation, 72 species and 16 families were recorded, while in woody vegetation 51 species and 18 families were recorded. During the wet period (third field visit), the number of captures was more than five times (n = 2097) that of the two other field visits. Individuals were also more abundant in shrubby vegetation (1958) than in woody vegetation (772), and the disparity increased through the study, being 1.30, 1.66 and 3.06 times in the first dry, second dry and wet period, respectively.
Model selection
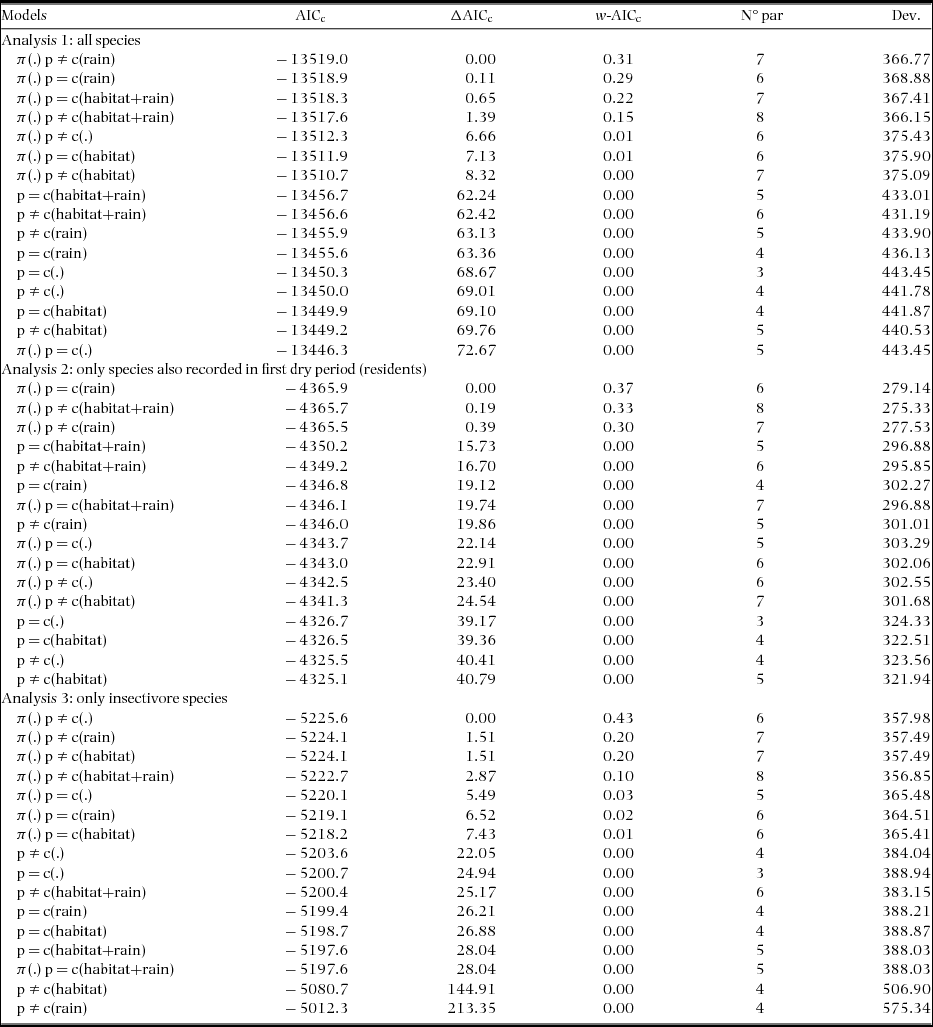
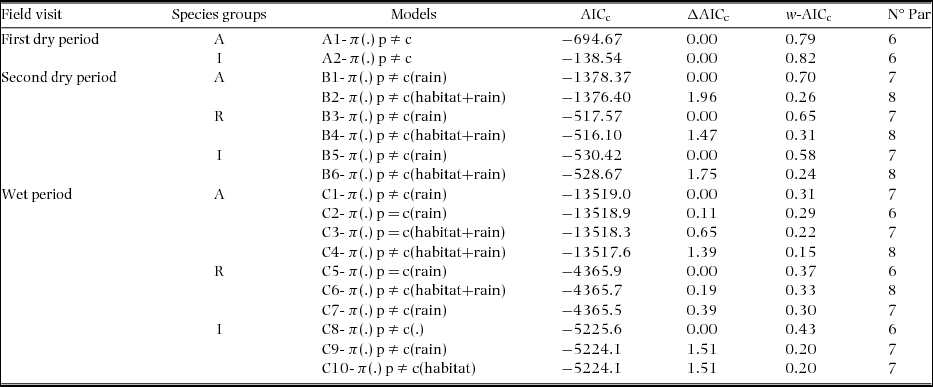
In all eight comparisons of candidate models (three field visits and two or three types of species group) the parameter heterogeneity in capture probability was found in all the best-fit models (Table 1, Appendices 2–4, ΔAICc ≤ 2). Best-fit models also indicated a behavioural response to the sampling (p ≠ c) during the two dry periods (Table 1, models A1–B6), but not in the wet period, when the uncertainty relating to the importance of this behavioural response was greatest (models C1–C7 with p ≠ c or p = c, Table 1). During the wet period, only insectivore species showed a clear effect for this covariate (Table 1, C8–C10). The behavioural response to rain (considered only for second dry and wet period) was present in all models with ΔAICc ≤ 2 in the second dry period (Table 1, B1–B6) and for all or resident species in the wet period (C1–C7).
Table 1. Candidate models (models with ΔAICc ≤ 2) to explain the variation in the estimates of capture (p) and recapture (c) of individual birds in a tropical dry forest of the Seridó Ecological Station, north-eastern Brazil. Eight model analyses were performed: three field visits and two or three types of species groups by visit (all – A, insectivores – I, resident – R). We used models with (including π-parameter) and without full-heterogeneity (not including π-parameter) for closed populations and ordaining these using the Akaike's Information Criterion (AICc). Here we considered a constant model (.), and models including the behavioural response to sampling (presence – p ≠ c or absence – p = c of response), response to rain (rain), and habitat type (habitat).
Capture and recapture estimates
We sought the best-fit model to explain the variation in capture-recapture probabilities for each of dry period. We did not used model-averaging analyses here due to high weight-of-evidence in the first model (w-AICc), and the similarity of this and second models in adjustment order. In all cases, the second model differed only in the effect of habitat covariate. We used model-averaging for the wet period due to the greater uncertainty of the importance of the covariates in estimating the detectability and abundance.
Capture (pa and pb) and recapture (ca and cb) parameters indicated that heterogeneity had a strong effect on capture probability. During the two dry periods, capture estimates for the low-capturability group (pa) were generally close to 0.10, and for the high-capturability group (pb) were always greater than 0.50 (Table 2). Recapture estimates for the low-capturability group (ca) were always below 0.10, but for the high-capturability group (cb) were generally greater than 0.10. During the wet period, capture-recapture estimates were always between 0.01 and 0.10 for low-capturability groups (ca and pa), and above 0.20 for high-capturability groups (cb and pb) (Table 2).
Table 2. Closed-captures models estimates (± SE) of the parameters mixtures (π), capture (p), and recapture probabilities (c) of birds in a tropical dry forest of the Seridó Ecological Station, north-eastern Brazil. Results based on best-fit model (two dry periods) or model-averaging (wet period) for each species group (all – A, resident – R and insectivores – I). All periods includes the behavioural response to capture (p ≠ c) and the parameter heterogeneity on capturability (low probability of capture - p a or recapture - ca, and high probability - p b or cb). In the first dry period the groups ‘All’ and ‘Residents’ were based on the same database. In the second dry and wet periods the estimates includes the behavioural response to rain on the day preceding sampling (occurrence of rain – y or rain had not occurred – n).
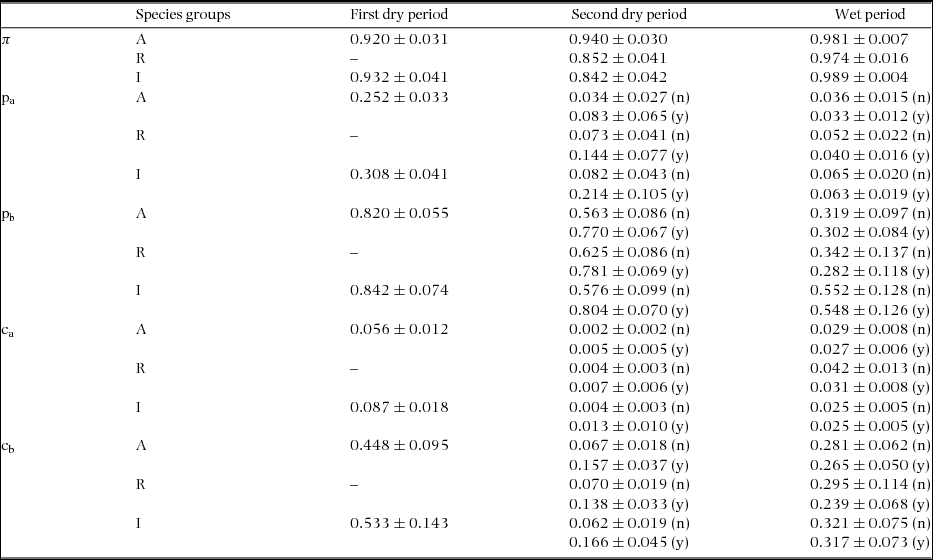
The effects of variable behavioural response to capture were found during the two dry periods, but were barely apparent during the wet period (Table 2). During the dry periods the difference between capture and recapture for the low- (around 0.20 to first dry period, 0.09 for second dry period) and high-capturability groups (0.33 to first dry period, 0.57 for the second dry period) indicated that the probability of an individual being captured was greater than that for being recaptured. The differences were smaller during the wet period for both all species and residents (p a − ca ≤ 0.01; p b − cb ≤ 0.05). For insectivore species these differences were larger, but lower than during dry periods.
The effects of behavioural response to rain in the second dry period were more intense than in the wet period. In the dry period, estimates of capture and recapture when rain occurred on the day preceding sampling were larger than those when rain had not occurred (Table 2). This resulted in capture and recaptures on average 0.10 higher when recorded during a rain event (p – from 0.05 to 0.22; c – from 0.003 to 0.10). In the wet period, estimates of capture-recapture for both all birds and for just insectivore species, were on average, slightly higher in the absence of rain (0.006; a null-trend effect), and for resident species on average 0.03 higher also in the absence of rain (reverse-trend effect).
Estimates and records of abundance
The best-fit models, which include the parameter heterogeneity in capture probability, generated uncertain abundance estimates indicated by broad confidence intervals, which tended to be greater when population sizes were larger (Figure 2) and the proportion of individual captures-recaptures was smaller (Table 2). For this reason we included the results of abundance estimates generated by the best-fit models (first and second dry periods) and model-averaging analyses (wet period), after excluding models that included heterogeneity in capture probability. The number of individuals estimated by the models (with or without heterogeneity) indicated that the greatest number of birds occurred in shrubby vegetation and during the wet period (Figure 2b, d, f).
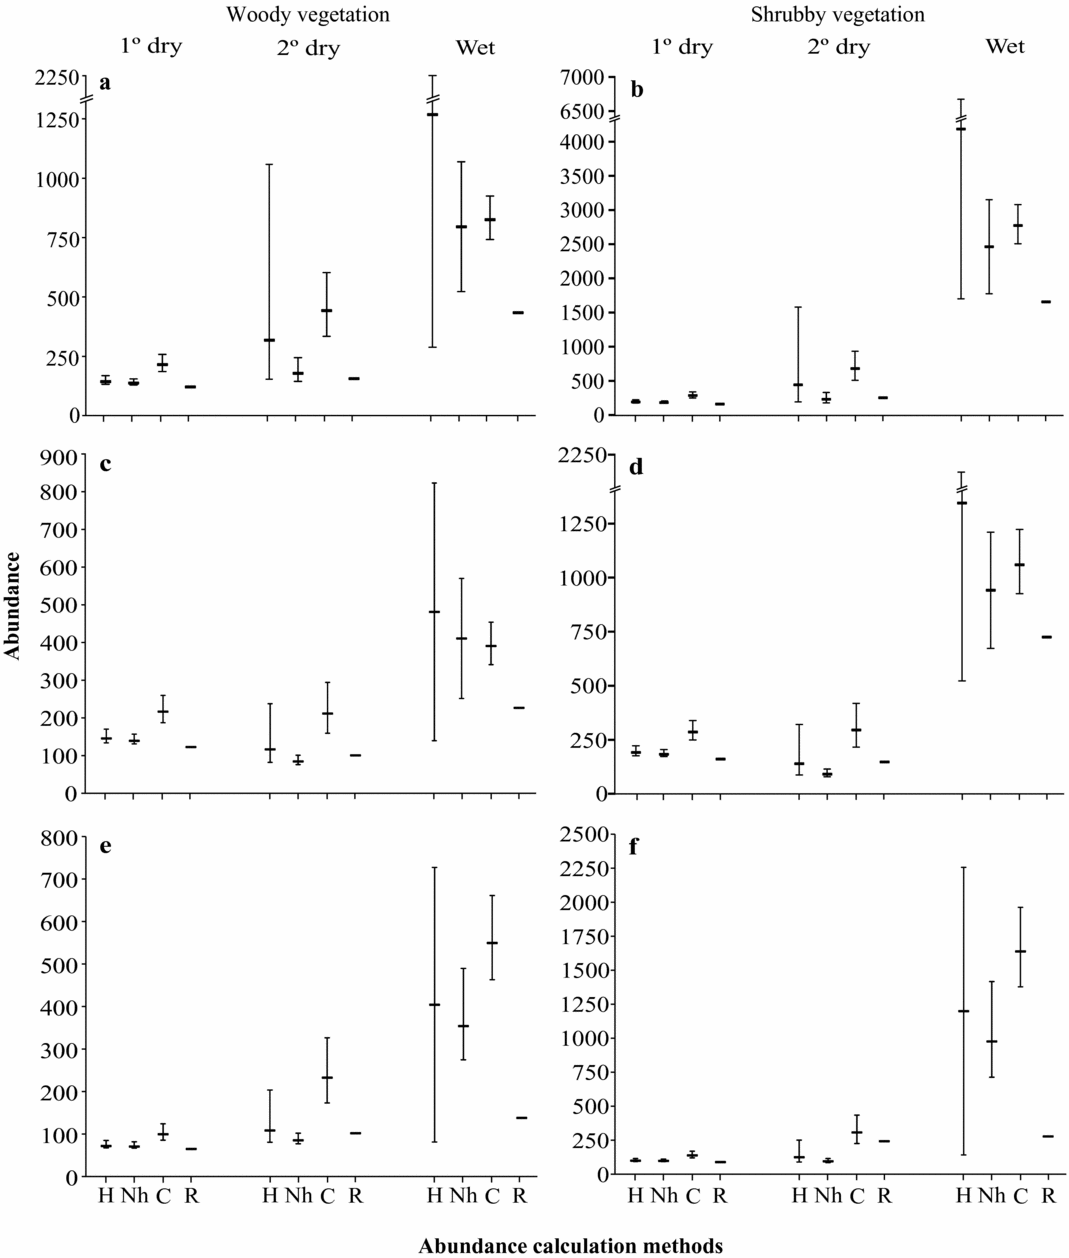
Figure 2. Number of birds estimated by models with heterogeneity (H), with no heterogeneity (Nh), and constant (C), as well as using an index of relative abundance (R), in woody vegetation and shrubby vegetation. Each analysis was performed by field visit: first dry, second dry and wet period; and by species groups: all species (a–b), residents (c–d), and insectivores (e–f). Study site located in tropical dry forest at the Seridó Ecological Station, north-eastern Brazil.
In all species analysis, the number of individuals increased by 1.3 (from 138 to 179, no-heterogeneity models) to 2.3 times (192 to 443, heterogeneity models) from the first to second dry periods, separately in each one of the two habitats (Figure 2a, b). This occurred when migrants had arrived but local reproduction had yet to take place. From first dry to wet period there was an increase of between six (138 to 796, no-heterogeneity) and nine times (144 to 1268, heterogeneity) in woody vegetation (Figure 2a), and between 13 (183 to 2463, no-heterogeneity) and 22 times (192 to 4187, heterogeneity) in shrubby vegetation (Figure 2b). This was after local reproduction had occurred, and when opportunistic and migrant species were captured.
Comparisons with only resident species showed that between the first and second dry period the number of individuals declined by around 20% (from 144 to 115, heterogeneity) and 40% (138 to 83, no heterogeneity) in woody vegetation (Figure 2c), and between 27% (192 to 139, heterogeneity) and 50% (183 to 92, no heterogeneity) in shrubby vegetation (Figure 2d). However, for the second dry and wet period, during breeding, the number of individuals increased around 4.5 times (115 to 479, heterogeneity; 83 to 402, no heterogeneity) in woody vegetation and 10 times (140 to 1346, heterogeneity; 91 to 942, no heterogeneity) in the shrubby vegetation.
When the opportunists and some of the migrants were excluded (analysing insectivores) the number of individuals from the first to second dry period increased between 1.2 (70 to 85, no heterogeneity) and 1.5 times (72 to 108, heterogeneity) in woody vegetation (Figure 2e), and either remained constant (99 to 95, no heterogeneity) or increased by up to 1.3 times (100 to 125, heterogeneity) in shrubby vegetation (Figure 2f). From the second dry to the wet period, the number of individuals increased around five times (72 to 404, heterogeneity; 70 to 354 no heterogeneity) in woody vegetation, and 10 times (125 to 1199, heterogeneity; 95 to 977, no heterogeneity) in shrubby vegetation.
Comparisons between constant and best-fit models show that rejecting both, behavioural responses to rain and to capture, resulted in abundance estimates around 1.5 times greater for the first dry period, and around three times for the second dry period. For the wet period, when the tested covariates resulted in lower support, comparisons did not result in a single tendency. In some cases, the constant models gave estimates 1.6 times higher (insectivore species, no heterogeneity), while some best-fit models resulted in estimates 1.5 times higher than constant models (all species and resident species, heterogeneity). Comparisons between estimates and relative values of abundance indicated that in dry periods the estimated values were slightly greater than relative ones (generally around 1.2 times; Figure 2). However, in the wet period, where we recorded 74% of captured birds, abundance estimates were at around 1.5–4.0 times greater according to best-fit models.
DISCUSSION
When we incorporated the detection probability to estimate abundance, we found intra-annual fluctuations (all species – up to 13 or 22 times, residents – up to 4.5 or 10 times, insectivores – up to 5 or 10 times) greater than those recorded in other South American semi-arid environments (intra-annual fluctuation up to 1.6 times for an assemblage in Mexico (Del Rio & Butterfield Reference DEL RIO and BUTTERFIELD1999), between 2.5 and 3.3 times in Chile (Jaksic & Lazo Reference JAKSIC and LAZO1999), near 1.7 times for granivores and seven times for insectivores in Argentina (Marone Reference MARONE1992), up to four times for insectivores and nectarivores, and nine times for granivores in Venezuela (Poulin et al. Reference POULIN, LEFEBVRE and McNEIL1993)). This could be either a local feature or a methodological artifact, since comparisons are being made with studies that did not consider detectability when estimating abundances. Seasonality in semi-arid environments is known to cause fluctuations in bird abundance (Dean et al. Reference DEAN, BARNARD and ANDERSON2009, Del Rio & Butterfield Reference DEL RIO and BUTTERFIELD1999, Jaksic & Lazo Reference JAKSIC and LAZO1999), and these are often linked to food availability (Poulin et al. Reference POULIN, LEFEBVRE and McNEIL1993). The few studies that have recorded bird occurrence in dry forests of north-eastern South America indicate that the same responses appears to occur (Olmos et al. Reference OLMOS, SILVA and ALBANO2005, Silva et al. Reference SILVA, SOUZA, BIEBER, CARLOS, Leal, Tabarelli and Silva2003). However, those studies were using methodologies designed for objectives other than describing spatio-temporal patterns of bird abundance.
Our analysis of detectability showed that any true fluctuations in bird abundance may be masked by the use of relative abundance values. The detection probability estimates were extremely low and differed strongly between seasons, which could greatly distort perceived abundance. Relative abundance of birds in the wet period resulted in values corresponding to one-third (non-heterogeneity models) to one-quarter (heterogeneity models) of those from best-fit models despite the high sampling effort (considered as number of nets and sampling hours). On the other hand, estimates were closer to relative values in the period with the lowest number of birds (dry periods). When only a few birds are captured and then recaptured, estimates will, as a mathematical consequence of the low capture number, tend to more closely resemble relative values. This results in a greater detection probability to the sample population. This temporal variation in detectability resulted in a skewed perspective of seasonal fluctuation in local bird populations, an issue frequently disregarded by studies using relative indices (Norvell et al. Reference NORVELL, FRANK and PARRISH2003, reviewed in Rosenstock et al. Reference ROSENSTOCK, ANDERSON, GIESEN, LEUKERING and CARTER2002).
Wide discrepancy in abundance values seen in the comparisons of estimates and relative abundance was triggered by temporal variation in both the detection probability and the role of bird behavioural responses. In the dry season, including detection estimates but rejecting the behavioural responses (constant models) resulted in higher abundance estimates (1.5–3.2 times). During the wet periods, the use of bird behavioural responses was unnecessary. Otherwise, the relative abundance explained some 23–54% of the estimated values derived from best-fit models. It is possible that other factors might also vary seasonally and could affect the estimates, such as the presence of transient individuals (Peele et al. Reference PEELE, MARRA, SILLETT and SHERRY2015) and net visibility (Buckland & Hereward Reference BUCKLAND and HEREWARD1982). However, this does not diminish the importance of behavioural responses. Accordingly, we believe that future studies in semi-arid areas should consider detectability and the temporal sources of bias in order to better explain the temporal patterns of bird abundance. Our results suggest that periodical fluctuations in bird abundance in some semi-arid habitats are more intense than have been believed heretofore.
Many authors have cited spatio-temporal displacements (nomadism and migration) in search of areas with suitable food availability as the major explanation for seasonal fluctuation of bird abundance in arid and semi-arid environments (Dean et al. Reference DEAN, BARNARD and ANDERSON2009, Herremans Reference HERREMANS2004, Wiens Reference WIENS1991). In dry forests in north-eastern South America the importance of nomadic displacement has been mentioned anecdotally (Araujo & Rodrigues Reference ARAUJO and RODRIGUES2011, Farias Reference FARIAS2009, Silva et al. Reference SILVA, SOUZA, BIEBER, CARLOS, Leal, Tabarelli and Silva2003), including suggestion that movements occur to humid mountaintop habitats (Farias Reference FARIAS2009, Silva et al. Reference SILVA, SOUZA, BIEBER, CARLOS, Leal, Tabarelli and Silva2003). Our results indicate that nomadic displacements are neither the only, nor the main, cause of the seasonal patterns of fluctuation in the abundance of local birds. The effects of an immediate impact of rainfall on capture probability, and the low probabilities of capture-recapture reported here indicate low activity, and hence low capturability, of individuals during the dry periods, which may create a false impression of nomadic displacements in the study area. In addition, it should be noted that most resident species in the study area are insectivores, which tend to be sedentary or migratory (Dean et al. Reference DEAN, BARNARD and ANDERSON2009, Poulin et al. Reference POULIN, LEFEBVRE and McNEIL1993). We detected an increase between 4.5–10 times in the abundance of resident species recorded in the current study. Evidence suggests that this resulted from seasonal variation in recruitment and mortality in the studied populations. On the other hand, considering all captured species, part of the increase in density was coincident with the arrival and reproduction of migratory species, and part with the presence and reproduction of opportunistic species (unpubl. brood patch data from January 2012 to November 2014). The latter were generally granivorous or omnivorous (e.g. Columbina minuta, Columbina picui), and these species fit the standard definition of nomadism (Dean et al. Reference DEAN, BARNARD and ANDERSON2009).
Seasonality is widely considered the key factor in latitudinal patterns of bird life-history evolution (Jansen et al. Reference JANSEN, ABADI, HAREBOTTLE and ALTWEGG2014). In temperate zones, climate seasonality and fluctuations in food availability (Ashmole Reference ASHMOLE1963, Martin Reference MARTIN1996, Newton Reference NEWTON1998) tend to favour high annual reproductive investment and low survival. In contrast, the seasonal tropics are climatically more unpredictable (Murphy & Lugo Reference MURPHY and LUGO1986), and rainfall periodicity takes on the role of temperature as a factor influencing the dynamics of birds (Barta et al. Reference BARTA, HOUSTON, MCNAMARA, WELHAM, HEDENSTRÖM, WEBER, FERÉ and LINDSTRÖM2006, Curry & Grant Reference CURRY and GRANT1989, Dean & Milton Reference DEAN and MILTON2001, Sæther et al. Reference SÆTHER, SUTHERLAND and ENGEN2004). The results obtained here support the hypothesis of high periodic fluctuation in bird abundance for this dry forest. Consequently, it may be expected that the mechanisms governing population dynamics in these birds will be in part similar to temperate environments, albeit with features linked to the peculiarities of a semi-arid environment. This perspective indicates that the avifauna of the Neotropical region is richer in population ecology strategies than has previously been thought, because most studies have focused on tropical rain forests (Stutchbury & Morton Reference STUTCHBURY and MORTON2001).
ACKNOWLEDGEMENTS
We thank the graduate and post-graduate students of the Laboratory of Population Ecology of Federal University Rural do Semiárido and Laboratory of Ornithology of Federal University of Rio Grande do Norte for their help with fieldwork. We thank the Institute Chico Mendes de Conservação da Biodiversidade for providing licenses and providing bird rings. We thank CNPq (Grant number: 552024/2011-2) and FAPERN (Edital 005/2011, grant number 57) for funding the research of MP and LFF, respectively. We thank Luciana Vieira de Paiva and anonymous reviewers for providing comments on this manuscript. Adrian Barnett helped with the English.
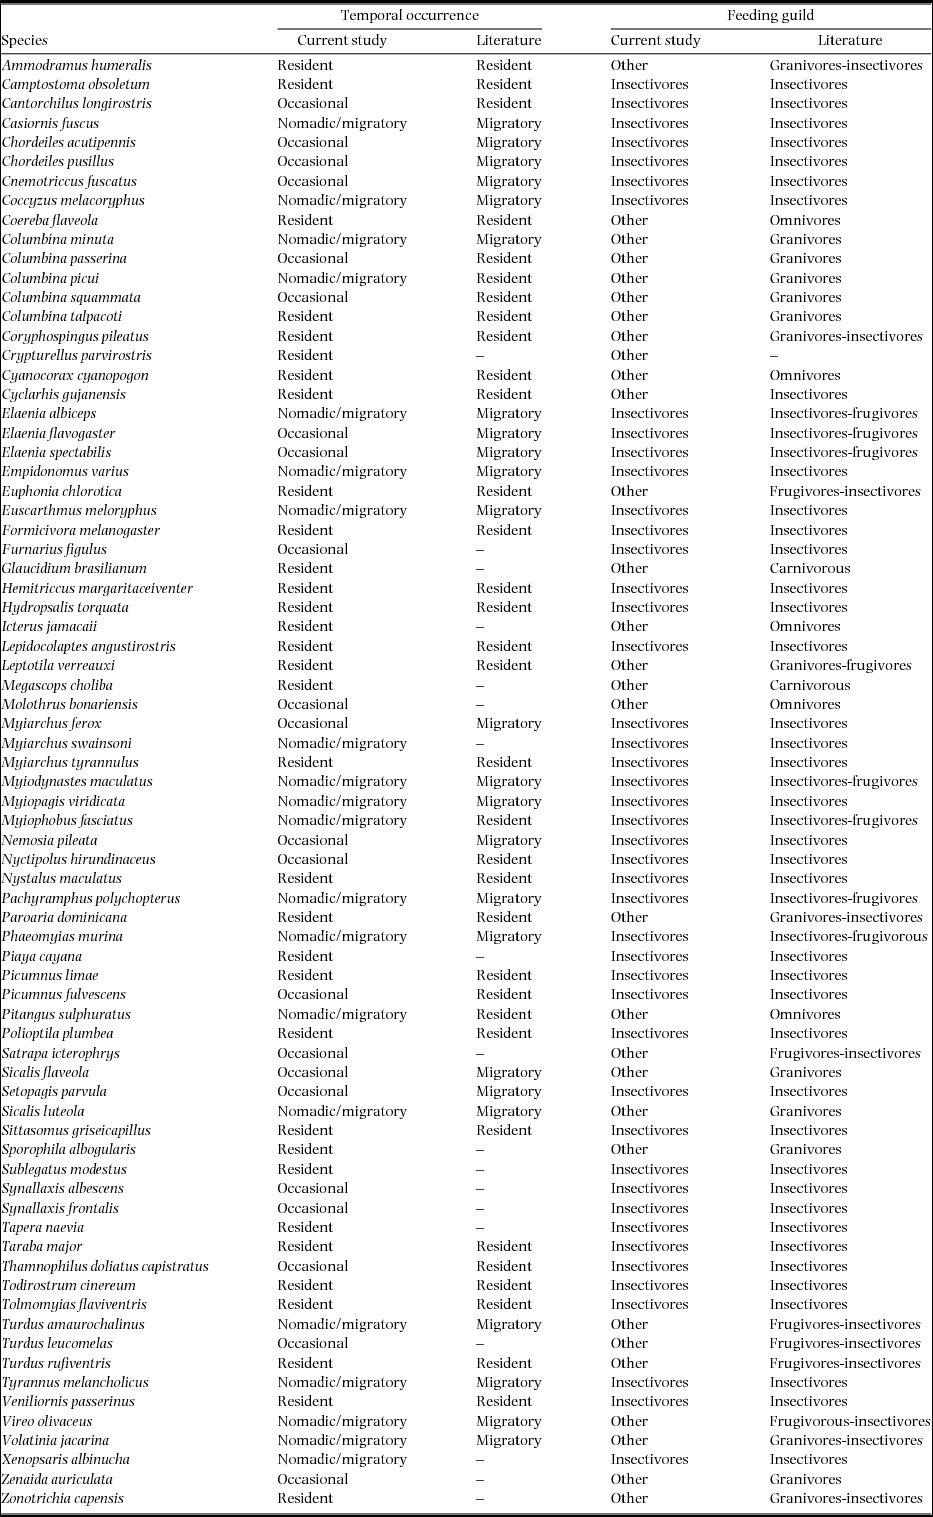
Appendix 1. The bird species recorded in the current study were classified following the form of their temporal occurrence (in the study area and based on the literature), and their feeding guild (categories considered in the study and data from the literature). Field data were recorded in a tropical dry forest at the Seridó Ecological Station, north-eastern Brazil. Nomenclature follows South American Classification Committee (http://www.museum.lsu.edu/~Remsen/SACCBaseline.htm). The predominant diet, based on the literature was listed first when more than one dietary category has been reported for a species.
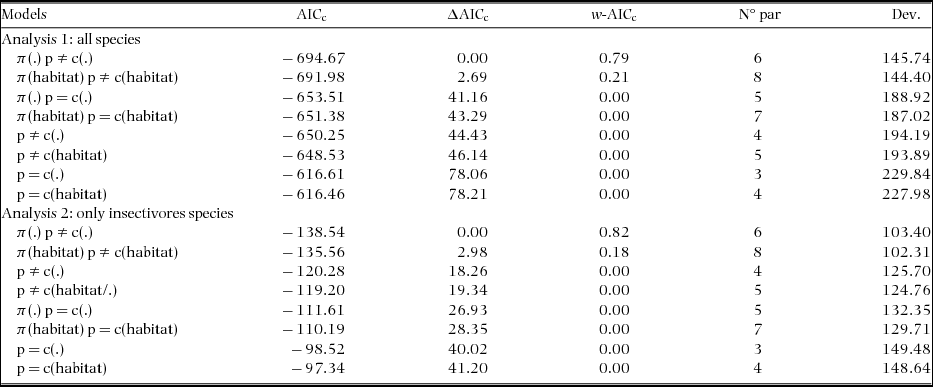
Appendix 2. Candidate models to explain the variation in estimates of capture (p) and recaptures (c) of individual birds during the study's first dry season, in a tropical dry forest of the Seridó Ecological Station, north-eastern Brazil. We used models with (including π-parameter) and without full-heterogeneity (not including π-parameter) for closed populations and ordered these using the Akaike's Information Criterion (AICc). Here we considered a constant model (.), and models including the behavioural response to sampling (presence-p ≠ c or absence-p = c of response) and the habitat type (habitat).
Appendix 3. Candidate models to explain the variation in the estimates of capture (p) and recapture (c) of individual birds during the study's second dry period, in a tropical dry forest of the Seridó Ecological Station, north-eastern Brazil. We used models with (including π-parameter) and without full-heterogeneity (not including π-parameter) for closed populations and ordaining these using the Akaike's Information Criterion (AICc). Here we considered a constant model (.), and models including the behavioural response to sampling (presence – p ≠ c or absence – p = c of response), response to rain (rain), and habitat type (habitat).
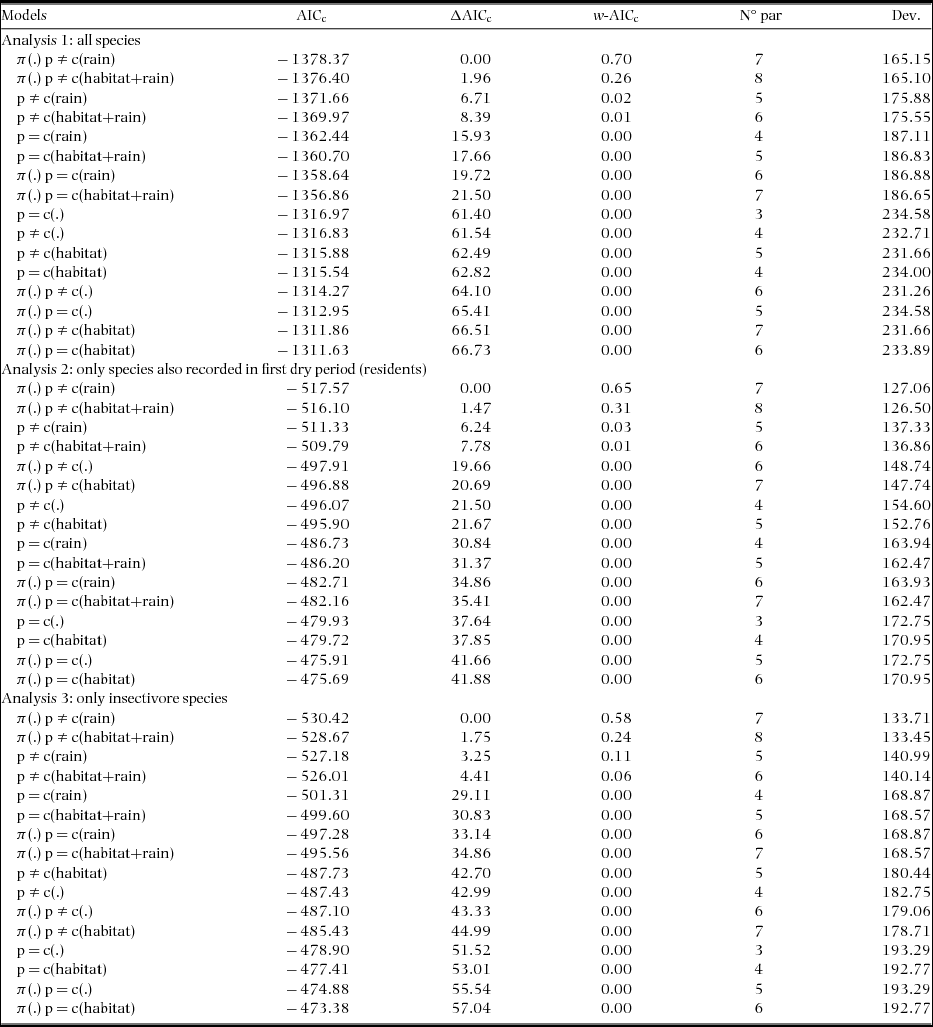
Appendix 4. Candidate models to explain variation in estimates in capture (p) and recapture (c) of individual birds during the study's wet period, in a tropical dry forest of the Seridó Ecological Station, north-eastern Brazil. We used models with (including π-parameter) and without full-heterogeneity (not including π-parameter) for closed populations and ordaining these using the Akaike's Information Criterion (AICc). Here we considered a constant model (.), and models including the behavioural response to sampling (presence – p ≠ c or absence – p = c of response), response to rain (rain), and habitat type (habitat).
