


1. Introduction
As the global economy has entered recession in 2020, triggered by the COVID-19 pandemic, the human casualties, and economic damage are perceived to be very large. Even as the health crisis will gradually become manageable, the impact on economic growth can be long-lasting and the recovery path can take several years. In particular, growth drivers such as the pace of job creation, income generation and investment may take several years to get back to pre-crisis trends. Iniitially the productivity of those growth drivers may be of less concern as the mantra of ‘we’ll do what it takes to avoid worse’ is predominant in this phase of the crisis.
However, once the recovery gets underway the productive use of resources is key to sustained growth. While we do not ignore the short-term challenges of the economic recovery, our primary focus in this paper is on the productivity puzzle from a long-term perspective. Productivity is driven by technological change and innovation which, in turn, depends on investment in human and physical capital as well as in other ‘missing capitals’ often referred to as intangible assets. Indeed, those investments create a positive feedback effect, as the productivity it generates also helps to make more efficient usage of scarce resources in the future. When properly measured and valued, productivity also provides a critical yardstick to realise a fairer distribution of the gains from economic growth to those who bring the resources to bear. It thereby creates the incentives for people to produce and business to invest helping to drive economic growth and raise living standards.
Unfortunately, in the aftermath of the global financial crisis of 2008/2009, many economies around the world, especially advanced economies, have failed to recharge the economy by powering productivity as the key source of growth in the long term. Indeed the latest update of The Conference Board Total Economy Database (July 2020) points at significant weakening in labor productivity growth in Europe up to 2019 (figure 1a–c). While the United States experienced somewhat faster productivity growth from 2017 to 2019 than the Euro Area and the United Kingdom, it still has not recovered to the rates of productivity growth from before the global financial crisis either.

Figure 1. (Colour online) (a–c) GDP per hour worked, Euro Area, United Kingdom and United States, 1995–2019 (per cent change). Source: The Conference Board Total Economy Database (adjusted version) July 2020Note: Dotted line represents the linear trend
The slowdown in productivity growth over the past 15 years has been well documented. There are multiple causes including an exhaustion of catch-up potential in emerging markets impacting economies along entire global value chains, and the drag from the global financial crisis because of low demand and weak investment, too low interest rates causing misallocations an overreliance on cheap labor, and failing fiscal policies (Bauer et al., Reference Bauer, Fedotenkov, Genty, Hallak, Harasztosi, Martinez Turegano, Nguyen, Preziosi, Rincon-Aznar and Martinez2020; Cette et al., 2016; Crafts, Reference Crafts2018; Dieppe, Reference Dieppe2020; Fernald et al., Reference Fernald, Hall, Stock and Watson2017; Syverson, Reference Syverson2016).Footnote 1 Technical measurement issues regarding inputs and outputs may have played a role as well.
In our earlier work we have stressed the importance of time lags in the adoption of new technologies, and in particular the complexity in generating productivity growth from the latest round of new digital technologies since the early 2010s, including the move toward mobile, ubiquitous access to broadband, the rise of cloud storage and advances in artificial intelligence (AI) and robotics (van Ark, Reference van Ark, Askenazy, Bellmann, Bryson and Galbis2016a, Reference van Ark2016b; van Ark and O’Mahony, Reference van Ark, O’Mahony, Jorgenson, Fukao and Timmer2016; van Ark et al., Reference van Ark, Erumban, Corrado and Levanon2016).
While the first priority for economic recovery from the COVID-19 crisis is to restore jobs, it is important that any employment-intensive growth path does go together with a productivity revival. In this paper, we argue that it is possible to avoid another productivity slowdown. Underneath the aggregate figures, there is evidence pointing toward a possible tipping point at which many advanced economies may expect to see more widespread impacts from the adoption and absorption of digital technology on productivity and GDP growth.
In Section 2 we review the latest literature on the productivity impacts of general purpose technologies (GPTs), including the notion of time lapses through which digital technologies result in faster productivity growth. We also look at patterns by which innovation and productivity effects GPTs emerge across industries and disperse across the economy. We explain why the New Digital Economy (NDE) is especially characterised by long lag effects.
In Section 3 we provide an empirical analysis of productivity growth by industry data to observe whether we can detect a distinct pattern across groups of industries pointing to a structural improvement in recent years. We use a taxonomy on digital intensity by industry which was recently developed by the Organisation for Economic Co-operation and Development (OECD) (Calvino et al., Reference Calvino, Criscuolo, Luca and Squicciarini2018), showing that the most digital-intensive industries have experienced a relatively strong performance in terms of labor productivity growth since 2007 and especially since 2013.
In Section 4 of the paper, we discuss the connection between labor and skills in the digital economy, which we believe provides the key to a productivity revival. We developed a new metric on innovation competencies by occupation on the basis of data from the O*Net database on occupation-specific descriptors in the United States (Hao et al., Reference Hao, Ozyildirim and Corrado2018). When applied to the United Kingdom, we find that innovation competencies point at stronger productivity effects by industry.
In Section 5 we focus on how productivity has been behaving in the short-term during the COVID-19 recession. In particular, we address the potential trade-offs between traditional pro-cyclical recovery effects and scarring effects the recession leaves, especially on the labor market. We argue that increased adoption and usage of digital technologies during the COVID-19 crisis may create a positive productivity effect.
In the final section, Section 6, we will review our hypothesis that a productivity revival could be imminent in the light of the recovery from the COVID-19 crisis. In order not to miss this opportunity again, as happened a decade ago, we argue that a coordinated effort from business and policy is needed, and has to be delivered in such a way that the gains from productivity will be more widespread and such that those who provide the resources for growth are incentivised to deliver them in an efficient way.
2. The productivity paradox of the New Digital Economy
It is well known that General Purpose Technologies (GPTs), defined as new methods of producing and inventing new goods and services which are important enough to have a long-term aggregate impact on the economy, can take a significant amount of time to translate to faster productivity growth at the aggregate level of the economy. This is inherent to the three critical characteristics of a GPT as identified by Bresnahan and Trajtenberg (Reference Bresnahan and Trajtenberg1995).Footnote 2
1. Pervasiveness – The GPT should spread to most sectors.
2. Improvement – The GPT should get better over time and, hence, should keep lowering the costs of its users.
3. Innovation spawning – The GPT should make it easier to invent and produce new products or processes.
Historical analysis has focussed on productivity trends in previous technology phases (Bakker et al., Reference Bakker, Crafts and Woltjer2019; Crafts, Reference Crafts2004). Recent literature has shown that the information and communication technology (ICT) revolution of the past 50 years can be characterised as a GPT and doesn’t pale with previous GPTs such as steam technology, electricity and the combustion engine. For example, Hempell (Reference Hempell2005) concludes that ‘investment in information and communication technologies (ICT) are closely linked to complementary innovations and are most productive in firms with experience from earlier innovations’. In a more recent analysis of the evolution of the Internet, Simcoe (Reference Simcoe, Goldfarb, Greenstein and Tucker2015) argues that the modularity of the internet has prevented a fall in return to investments in innovation by ‘facilitating low-cost adaptation of a shared general-purpose technology to the demands of heterogeneous applications’. In a review of the data, Liao et al. (Reference Liao, Wang, Li and Weyman-Jones2016) conclude that:
‘… ICT investment does contribute to productivity but not in the usual manner – we find a positive (but lagged) ICT effect on technological progress. We argue that for a positive ICT role on growth to actually take place, a period of negative relationship between productivity and ICT investment together with ICT-using sectors’ capacity to learn from the embodied new technology was crucial. In addition, it took a learning period with appropriate complementary co-inventions for the new ICT-capital to become effective and its gains to be realised. Our findings provide solid, further empirical evidence to support ICT as a general purpose technology’.
During the latest phase of ICT inventions and applications, which we dubbed the NDE,Footnote 3 and which refers to the combination of mobile technology, ubiquitous access to the internet and the shift toward storage, analysis and development of new applications in the cloud, the question arises if the NDE is an extension of the previous phase of ICT technology, or whether we are starting a new GPT-phase altogether fueled by AI and robotics. The latter issue has been extensively discussed by Agrarwal et al. (Reference Brynjolfsson, Rock, Syverson, Agrawal, Gans and Goldfarb2019) who argue that ‘(H)uman intelligence is a general purpose tool. AI, whether defined as prediction technology, general intelligence, or automation, similarly has potential to apply across a broad range of sectors’. (p. 4).
The shift in substitution of digital automation for horse power (such as in computer numerical control or CNC machinery), and routine administrative tasks (such as in office software) to substitute for human intelligence (such as with AI and robotics) represent the exponential growth in computing power. We therefore will treat the entire ICT era in this paper as one GPT. However, the periodisation, especially comparing the pre- and post-2007 period, allows us to tease out some of the productivity effects from the Old Digital Economy, driven by the introduction of the PC and the rise of the internet, vis-à-vis the NDE.
The time lag factor also plays an important role in the evolutionary school literature on technological change. For example, Perez (Reference Perez2002) distinguished an ‘installation phase’ and a ‘deployment phase’ for any new technological paradigm. During the installation phase, new business spending on machinery, innovation, organisational and management changes exceed the overall output recovery. During this phase, the famous Schumpeter credo of ‘creative destruction’ may put more emphasis on creation than on destruction. Low productivity firms can still survive which has been especially the case in the past decade’s environment of low interest rates, credit growth and weak wage growth where cheap workers could still be relied upon (Andrews et al., Reference Andrews, McGowan and Millot2017). During the deployment phase, the fruits of the new technology become more widespread as less productive firms will lose out on the competition and make room for the reallocation of resources to more productive firms and industries.
Beyond the time lag in the diffusion of the technology, there can also be a time lag in the absorption of new technologies. Evidence from recent business studies suggests that the absorption of new digital technologies has been particularly slow in the NDE. Indeed ‘digitisation’, which is the increase use of digital technology creating new products, new processes, business models and organisational structures, needs to be distinguished from ‘digital transformation’. The latter aims at leveraging digital technologies and the data they produce to connect organisations, people, physical assets and processes, etc. which drives long-term value and productivity (Young, Reference Young2016). Digital transformation causes a wide range of complexities raising the cost of transition ‘that can include an initial duplication of structures and investment, cannibalisation of incumbent business and the diversion of management attention. towards those new technologies’. (McKinsey, 2018). More specifically, related to the most recent wave of AI, Brynjolfsson et al. (Reference Brynjolfsson, Rock, Syverson, Agrawal, Gans and Goldfarb2019) state that:
The most impressive capabilities of AI, particularly those based on machine learning, have not yet diffused widely. More importantly, like other general purpose technologies, their full effects won’t be realized until waves of complementary innovations are developed and implemented. The adjustment costs, organizational changes, and new skills needed for successful AI can be modeled as a kind of intangible capital.
It follows that while new digital technologies have rapidly diffused across the economy, the absorption and translation into better business performance has been quite slow and uneven. This is not an unusual phenomenon. For example, Harberger (Reference Harberger1998) speaks of two types of growth. One is characterised as ‘mushroom’ growth in which a limited number of sectors, industries, or firms experience a much better productivity performance than others. In today’s world, it means that the exciting prospects of a productivity boost from driverless cars, robotics and AI may be mushroom-like with a limited effect on productivity growth at the macroeconomic level. The second type of growth is what Harberger calls ‘yeasty’ growth once the productivity improvements spread more widely across the economy. Even though we may not yet be fully harvesting the yeast effects of digital transformation, accelerated investment and business spending on ICT assets, cloud and digital services across many industries and rising wage premiums on skilled labor coupled with stronger demand bode well for a broader emergence of automation and digitisation.
Another important explanation for the wide dispersion of the productivity effects of new digital technology arises from the firm level. Studies at the OECD and the Massachusetts Institute of Technology (MIT) have pointed at the rising gap between the top echelon of high-performing firms and the rest (Andrews et al., Reference Andrews, McGowan and Millot2017; Autor et al., Reference Autor, Dorn, Katz, Patterson and Reenen2017). In this study, we do not look at this important source of productivity divergence but focus one level higher by looking at performance across industries and its link to the aggregate economy.
3. An industry perspective on productivity growth in the digital economy
To detect structural trends in productivity improvements from a GPT perspective, a useful starting point is to apply a taxonomy of digital intensity by industry. For this, we follow the taxonomy recently developed by the OECD (Calvino et al., Reference Calvino, Criscuolo, Luca and Squicciarini2018). The study uses multiple dimensions relating to technology, market and human capital-related features:
1. Share of ICT tangible and intangible (i.e., software) investment;
2. Share of intermediate purchases of ICT goods and services;
3. Stock of robots per hundreds of employees;
4. Share of ICT specialists in total employment; and
5. Share of turnover from online sales.
While the taxonomy is available for two periods (2001–2003 and 2013–2015), we only use it for the 2013–2015 period. Using an overall summary indicator (the ‘global taxonomy’), we collapse industries at the ISIC Rev. 4 level into two groups: ‘most digital intensive-using’ industries and ‘least digital intensive-using’ ones. Furthermore, we separate out a third group of industries that are defined as producing digital goods and services because of their very different productivity dynamics. Hence our most and least digital-intensive industries are identified as ‘using’ industries compared to producing industries (see Exhibit 1).Footnote 4
Exhibit 1. Digital Industry Taxonomy (ISIC rev.4 code/letter in brackets)
Digital Producing Industries: Computer, electronic and optical products (26), Electrical equipment (27), Publishing, audiovisual & broadcasting (58–60), Telecommunications (61) and IT & other information services (62–63)
Least Digital Intensive Using Industries: Agriculture, forestry & fishing (A), Mining & quarrying (B), Food, beverages & tobacco (10–12), Textiles & leather (13–15), Coke & petroleum products (19), Chemicals and chemical products (20), Pharmaceutical products (21), Rubber & plastics; non-metallic mineral (22–23), Basic metals & metal products (24–25), Electricity, gas, steam and air conditioning supply (D), Water supply; sewerage, waste management and remediation activities (E), Construction (F), Transportation & storage (H), Accommodation & food services (I), Real estate activities (L), Education (P), Human health activities (86), Residential care activities and social work activities without accommodation (87–88),
Most Digital Intensive Using Industries: Wood, paper, printing & media (16–18), Machinery & Equipment n.e.c. (28), Transport equipment (29–30), Other manufacturing (31–33), Trade (G), Financial & insurance activities (K), Legal and accounting activities; activities of head offices; management consultancy activities; architectural and engineering activities; technical testing and analysis (69–71), Scientific research and development (72), Advertising and market research; other professional, scientific and technical activities; veterinary activities (74–75), Administrative and support service activities (N), Public administration & defense (O), Arts, entertainment & recreation (R) and Other services (S)
Figure 2a compares the contribution of the three groups of industries to labor productivity growth for United States, the Euro Area (based on an average for 12 economies) and the United Kingdom for two subperiods: 1996–2006 represents the Old Digital Economy-era and 2007–2018 refers to the NDE era. This periodisation is supported by the shift from investment in ICT equipment (computers and telecommunications) and software to spending on ICT services referring to data storage and processing services (including cloud computing), computer systems design and other information services (including internet publishing) (van Ark et al., Reference van Ark, Erumban, Corrado and Levanon2016).
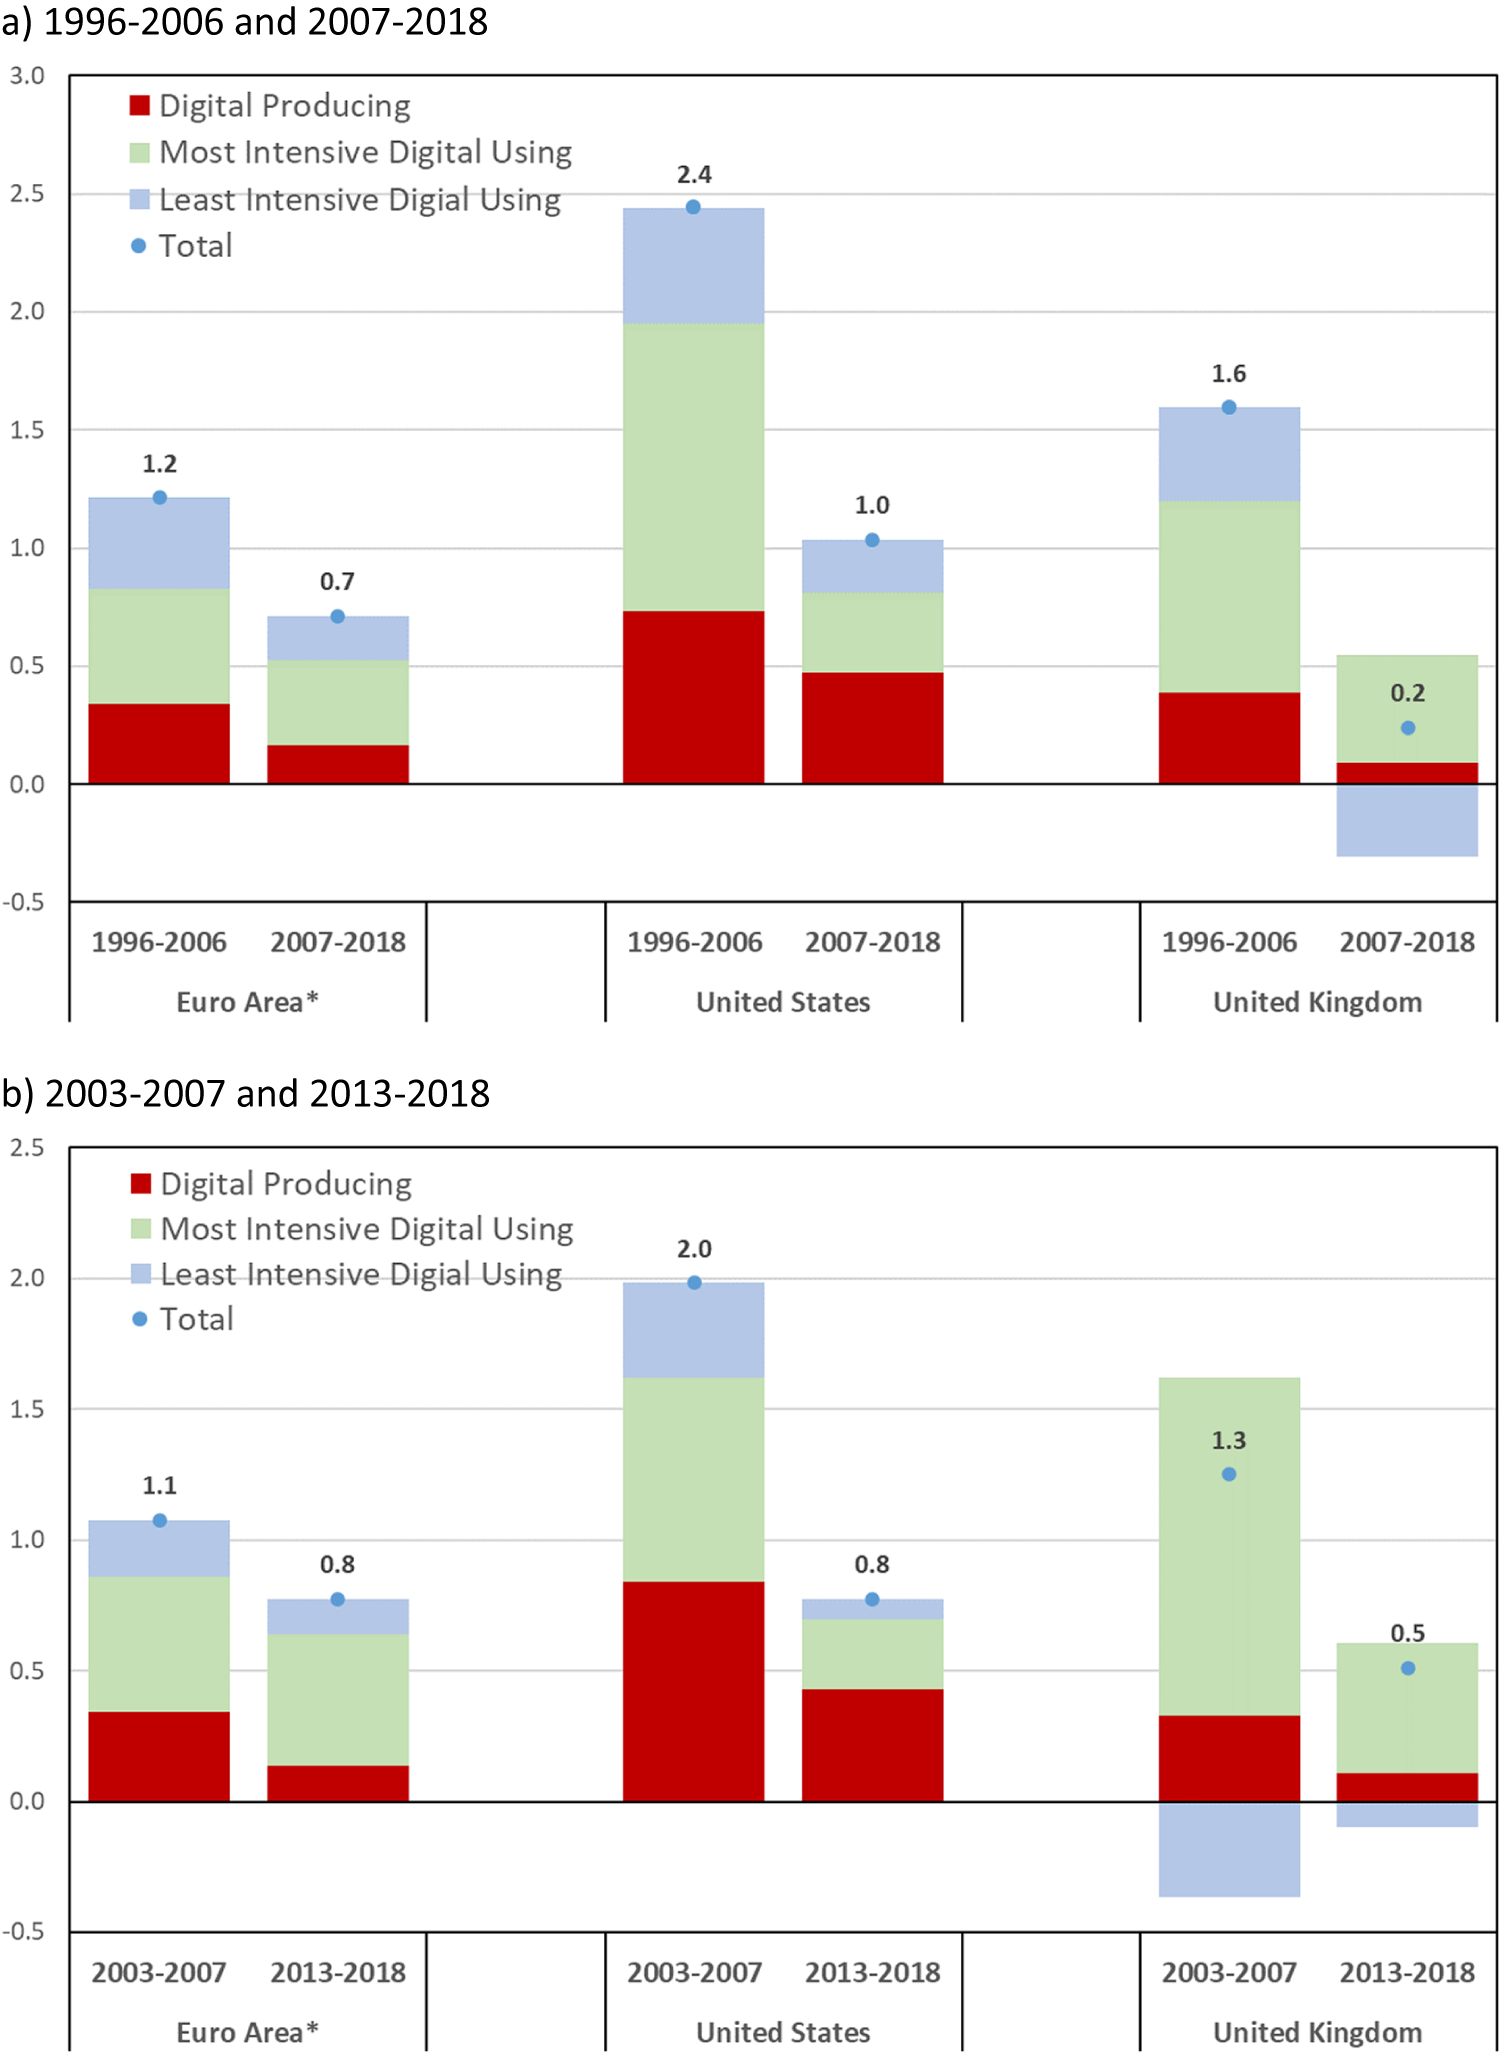
Figure 2. (Colour online) (a) and (b) Growth of output per hour and contributions from digital-producing and most and least intensive-using sectors, in per cent. Notes: For taxonomy used see exhibit 1; for the aggregation method see van Ark et al. (Reference van Ark, de Vries and Erumban2019); Euro Area aggregate is based on data for 12 countries (Austria, Belgium, Germany, Greece, Spain, Finland, France, Italy, Netherlands, Portugal, Slovakia and Slovenia). Sources: Conference Board calculations using data from Eurostat National Accounts; ONS Compendium of data related to labor productivity by low-level industry; BEA Integrated Industry-Level Production Account (KLEMS: Capital (K), labour (L), energy (E), materials (M) and service (S) inputs). Updated November 2020
Figure 2a shows that the dramatic decline in labor productivity between the pre and the post 2007 period, which has been described earlier, occurred across all three industry groups. In line with our earlier work (van Ark, Reference van Ark2016b; van Ark et al., Reference van Ark, Erumban, Corrado and Levanon2016) we find that, paradoxically, the largest slowdown occurred in the most digital intensive-using group. We attribute this counterintuitive effect to the time-lag in productivity effects from digital technology due to its general purpose-nature as well as to the delaying effects from the digital transformation process.
Figure 2b shows the same picture, but by removing the 2008–2009 recession and its immediate aftermath (2010–2012), provides a clearer comparison between the heydays of the Old Digital Economy and the NDE. In particular, the productivity advantage which the United Kingdom and the United States enjoyed over the Euro Area before 2007 has largely eroded since then because of a slowdown in productivity from intensive digital-using industries. Since 2013, when looking at the digital-producing and intensive digital-using industries combined, the contributions from the two industry groups to productivity growth are about the same in the Euro Area, the United Kingdom and the United States. The main differences are the larger contribution from digital-producing industries in the United States, and the negative contributions from the less digital-intensive industries in the United Kingdom, whereas the Euro Area primarily experienced a slowdown in productivity in ICT-producing industries.
The divergence in productivity contributions from digital-producing industries feeds directly into current debates about the predominance of digital production in the United States. The large volume of demand for US-based digital products and services may be one reason why the productivity contribution punches well above the weight of the sector: while the digital producing sector accounts for just over eight per cent of value added in the United States, it contributes for more than half of productivity growth since 2013.
Table 1 compares the productivity contributions from digital producing and most and least intensive-using groups in six Euro Area economies, the United Kingdom and the United States. The country estimates suggest that the productivity contribution from the digital producing sector dropped significantly in all European countries whereas intensive digital-using industries have performed relatively well despite without a large digital-producing sector.
Table 1. Growth of GDP per hour worked and contributions from digital-producing and most and least intensive-using sectors, in per cent

Sources: Conference Board calculations using data from Eurostat National Accounts; ONS Compendium of data related to labor productivity by low-level industry; BEA Integrated Industry-Level Production Account (KLEMS). Updated November 2020.
Note: See figure 2a,b.* Euro Area aggregate is based on data for 12 countries (Austria, Belgium, Germany, Greece, Spain, Finland, France, Italy, Netherlands, Portugal, Slovakia and Slovenia).
Van Ark et al. (Reference van Ark, de Vries and Erumban2019) exploit the full richness of the labor productivity data by industry to analyse how concentrated or widespread productivity growth is. They calculated the cumulative contribution of individual industries to aggregate productivity growth against the cumulative share of these industries in aggregate value added (Harberger, Reference Harberger1998; Timmer et al., Reference Timmer, Inklaar, O’Mahony and van Ark2010). Table 2 shows that, while all three regional entities saw a slowdown in labor productivity growth at the aggregate level, the share of value added in industries that contributed positively to labor productivity in each group was highest in the digital-producing sector, although in this regard the United Kingdom underperformed relative to the United States and the Euro Area. In the most intensive digital-using industries all three countries have held up well in terms of industries contributing positively to productivity growth. The share of value added in the less digital-intensive industries contributing positively to productivity growth was significantly lower than in the most-digital intensive industries. In fact, it even declines in the United Kingdom and the United States.
Table 2. Value added share of industries that contributed positively to aggregate productivity growth (as a per cent of the total of the category)

Sources: Conference Board calculations using data from Eurostat National Accounts; ONS Compendium of data related to labor productivity by low-level industry; BEA Integrated Industry-Level Production Account (KLEMS). Updated November 2020.
Notes: See figure 2a,b.
In sum, our analysis of the industry data suggests that while macro productivity growth has weakened over the past 15 years, the United States has performed relatively well in digital-producing industries. The Euro Area economies and the United Kingdom have been relatively strong performers in digital-using industries. All three areas saw less productivity growth from less digital-intensive industries, and in the United Kingdom it even detracted from productivity growth because a large number of less digital-intensive industries showed productivity declines.
It has been widely hypothesised that the presence of a digital-producing sector might help productivity to grow in the rest economy (Brynjolffson and McAfee, Reference Brynjolfsson and McAfee2014; Corrado and van Ark, Reference Corrado, van Ark, Bauer and Latzer2016). However, the data presented here suggest that this doesn’t necessarily mean that the digital producers need to be domestically based. Despite a smaller digital-producing sector and a lower export base in Germany and the United Kingdom compared to the United States, all three countries have been large importers of ICT services and in fact Germany and the United Kingdom saw more of an improvement in productivity in intensive digital-using sectors than the United States. This analysis also confirms that specialisation patterns may be conducive to additional productivity gains of the three regional entities.
The potential for digital specialisation across countries also raises the question whether complementary investments, for example, in workforce skills and other intangibles assets, are not at least as important as understanding differences in productivity effects from digital usage than the presence of a domestic digital-producing sector. In Section 4 we explore the importance of skills for generating the productivity effects from digital transformation further in Section 4 by looking at the Innovation Competencies of the workforce by industry in the United Kingdom.
4. Innovation competencies of occupations and productivity
As productivity is likely to improve as the result from digital transformation, its disruptive impact on labor markets is also being felt more broadly. It has become an important concern from the perspective of job creation, the share of labor income in total GDP, and its distribution. The productivity effects that come with digitisation may, on balance, have limited net job creation so far (Autor and Salomons, Reference Autor and Salomons2018). While it is unavoidable that digitisation destroys jobs in old industries, it should also create new jobs in industries that can grow faster by using the new technology.
An important precondition for that is the formation of appropriate skills for the NDE. The transition of skills, therefore, needs to be accompanied with new competencies which enable workers to apply digital technologies in producing new products and services that fulfill the needs of consumers. This helps to create a virtuous cycle in which new jobs and raise living standards through higher wages and greater utility from the consumption of those products and services.
In this section, our focus is on how innovation competencies of the workforce align to the needs of the digital transformation process. Using the same OECD taxonomy as in our analysis above, Grundke et al. (Reference Grundke, Marcolin, The Nguyen and Squicciarini2018) show that:
‘… digital intensive industries especially reward workers having relatively higher levels of self-organisation and advanced numeracy skills. Moreover, for workers in digital intensive industries, bundles of skills are particularly important: workers endowed with a high level of numeracy skills receive an additional wage premium, if they also show high levels of self-organisation or managing and communication skills’.
To measure the extent to which competencies relate to industry productivity growth, we apply a novel approach developed by The Conference Board to assess the innovation potential of occupations (IPO). Hao et al. (Reference Hao, Ozyildirim and Corrado2018) assign an innovation potential score to each occupation on the basis of 65 innovation-related job characteristics which are obtained from more than variables on job characteristics for more than 700 occupations from the O*NET database, the primary US source of information on occupations (US Bureau of Labor Statistics). The authors then applied factor analysis to ultimately group those characteristics in 12 competencies:
1. STEM
2. Adaptability/flexibility
3. Autonomy
4. Empowerment
5. Decision making
6. Cooperative teams and group interaction
7. Creativity
8. Mistake handling
9. Learning culture
10. Conflict handling
11. Enterprising
12. Deal with external customers
One of the insights from quantifying competencies is that the IPO seems more widely dispersed than is mostly assumed. For example, while a sales manager may not at face value be assumed to contribute much to the innovative potential of an organisation, this occupation does get a relatively high IPO score – higher than for example a physicist. This is related to the sales manager’s crucial role in representing the customer’s voice in both the beginning and the end of an innovation cycle. Recent research shows that US firms which post job vacancies require AI skills have a large wage premium, also show a wage premium for non-AI vacancies with managerial occupations showing the highest wage premium for AI skills (Alekseeva et al., Reference Alekseeva, Azar, Gine, Samila and Taska2020).
Using tabulations of occupations by industry for the United Kingdom, we have constructed weighted IPO averages by industry (van Ark et al., Reference van Ark, de Vries and Erumban2019).Footnote 5 We generally find that services industries such as advertising and market research, legal, accounting and management consulting as well as research and development have a relatively high innovation potential. In contrast, at the lower end of the list are agricultural industries, as well as goods-producing industries such as clothing, food and drinks and basic metals manufacturing.
Figure 3 shows a comparison of UK industries which showed either an increase or a decline in the IPO score between 2007 and 2017 relative to whether labor productivity growth was positive or negative over the same period. Exhibit 2 shows the aggregate GDP share in each quadrant and the GDP share of the five most important industries in terms of their value-added share. The data show that most industries employed workers with increased innovative potential scores as the top two quadrants account for as much as 85 per cent of all GDP in the United Kingdom in 2017. A larger share of those industries (47 per cent of GDP) also showed positive productivity growth, dominated by industries such as construction, health care, retail trade, public administration and finance, while 38 per cent of GDP was in industries with increasing IPO scores but falling productivity, including large sectors such as real estate and education. Indeed, the majority of digital-intensive using industries were represented in the top right quadrant of the chart. Only 15 per cent of 2017 GDP in the United Kingdom is located in industries with falling IPO scores between 2007 and 2017, even though about 11 per cent represent industries which still exhibited positive productivity growth, including large sectors such as wholesale trade and trade in vehicles where other factors than innovation competencies of the workforce were driving productivity.

Figure 3. (Colour online) Change in Innovation Potential of Innovations (IPO) score and labor productivity growth from 2007 to 2017
Exhibit 2. Change in IPO score and labor productivity growth from 2007 to 2017, top 5 industries by value-added share (per cent of GDP share in 2017, in brackets)

Source: The Conference Board Innovation Potential of Occupations Dashboard, Hao et al. (Reference Hao, Ozyildirim and Corrado2018); Office for National Statistics.
Notes: For the underlying methodology used see van Ark et al. (Reference van Ark, de Vries and Erumban2019); Data are available at on the level of 63 individual industries, based on the ISIC rev.4 classification.
The analysis shows that the relationship between IPO scores and productivity growth is not perfect. By no means would we suggest that workforce competencies are the only factor that drives differences in productivity growth between sectors. More research is needed on how innovation competencies and productivity influence on each other and which other factors might be at play. However, it is encouraging to see that almost half of GDP in the United Kingdom are in industries where workers have improved innovation competencies and show positive productivity growth.
5. The impact of the recession
Since the global economy has entered recession in 2020, triggered by the COVID-19 pandemic, productivity has behaved in an unusual manner. Normally, productivity drops substantially at the start of a recession, as employers are holding on to their resources including their employees for some time even as output slows in the hope that the downturn will be short-lived. However, when the pandemic hit in the first quarter of 2020, and GDP began to drop exceptionally rapidly, governments in many advanced economies put job retention schemes and short-time working arrangements in place to limit job losses while compensating firms for hours not worked. Even as output per worker declined rapidly, especially during the second quarter, the rate of reduction in hours worked has been larger than the loss of jobs, so that output per hour has not been as hard hit in the second quarter. While GDP per hour declined by almost one per cent in the United Kingdom, it increased in the Euro Area and even more so in the United States. During the third quarter, output per hour rebounded sharply in the UK while it turned negative in the Euro Area as the uptick in hours worked far exceeded the recovery in GDP (table 3).
Table 3. Quarterly change in labor productivity growth rates, in per cent
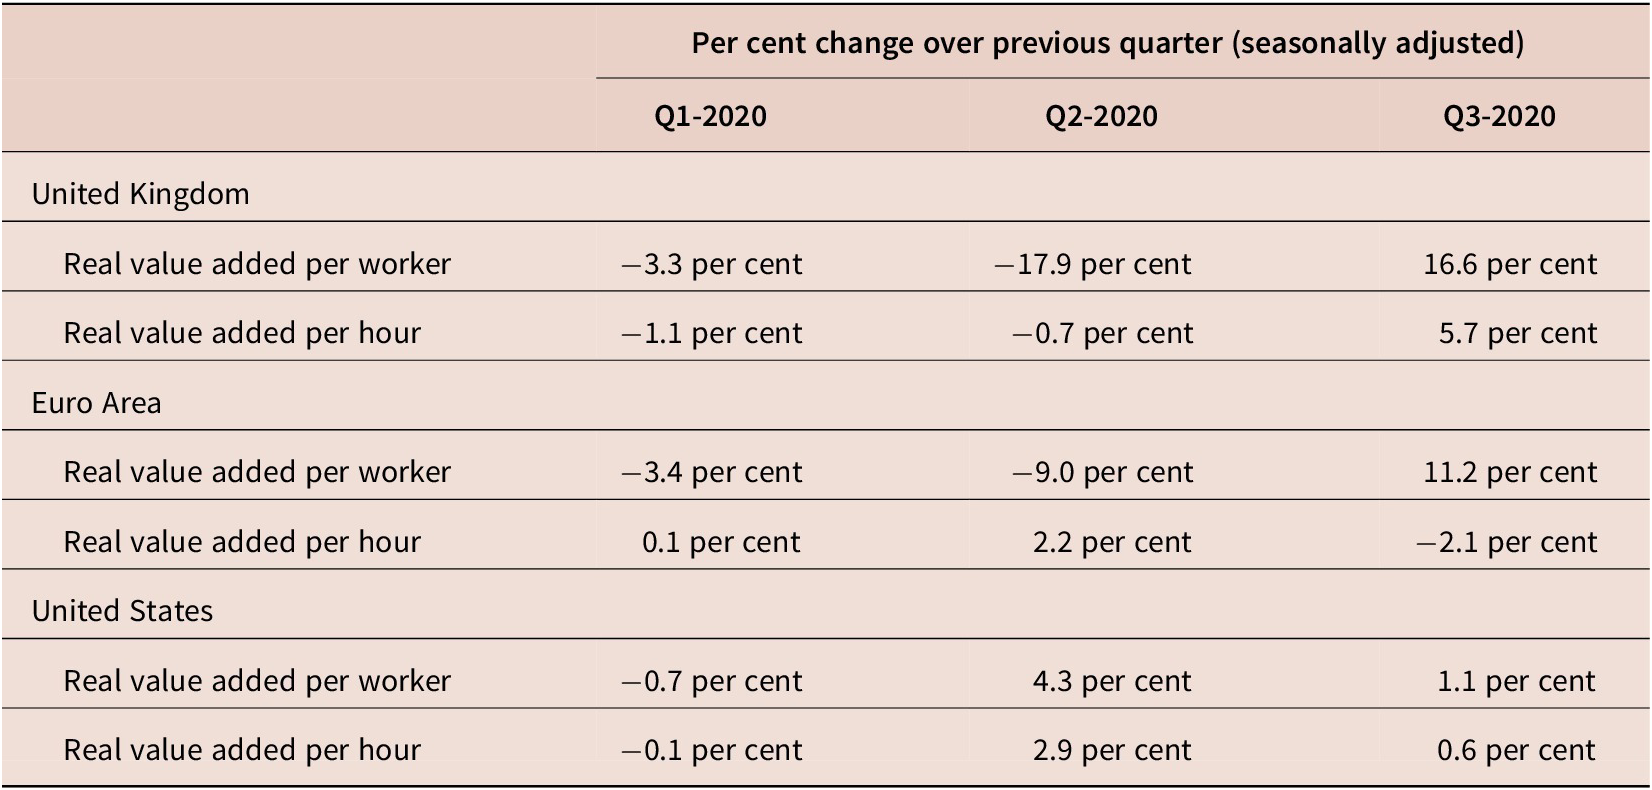
Source: ONS, Eurostat, US employment data are from the household survey provided by BEA while output data are sourced from the BEA.
Note: The US employment and hours denominator refers to data from the Current Population Survey.
In the coming quarters, various forces will influence productivity performance. First, the outlook depends to a large extent on whether, coming out of the recession, productivity will respond in a typical pro-cyclical manner. Second, there may be longer-lasting scarring effects, especially in labor markets. And, third, the adoption of digital technology during the COVID-19 recession may accelerate the process of digital transformation.
When coming out of the crisis, one may expect to see output recover faster than working hours causing a procyclical recovery of productivity. First, the recession will cause some companies to go bankrupt, which often are the least productive ones. Second, incumbent companies tend to be cautious in rehiring until the recovery has taken hold and will consider the need to restructure in the light of changes in the structure of demand. For example, in the post-COVID 19 world changed consumer behaviour may accelerate the delivery of goods and services to online or change the nature of demand for business or leisure travel. However, recent research for the United States shows that more than one third of US jobs may not be recovered in the medium-term (Barrero et al., Reference Barrero, Bloom and Davis2020). It also remains to be seen how large permanent job losses resulting from the crisis will be for other countries once their employment protection programmes wind down.
Indeed, the tradeoff between procyclical recovery and scarring effects on the post-recession productivity performance recovery critically depends on the effects of digital production and usage. There is some evidence of greater digital usage due to increased virtual work, increased on-line shopping and the growth of digital purchases from hardware to software and games, which may support productivity more permanently especially if new conducive policies, such as tax incentives and grants (especially for small and medium-sized enterprises) are implemented (OECD, 2020; Riom and Valero, Reference Riom and Valero2020).
The official quarterly data show many shortcomings in determining the drivers of productivity in the short-term, especially when looking at data on the industry level (ONS, 2020). At the aggregate level, productivity changes may have been caused either by within-industry effects or by a shift from low to high-productivity industries. During the COVID-19 crisis, the latter might have been caused by the fact that some services industries with relatively low levels of output per hour have lost ground to sectors with higher productivity levels. A preliminary analysis of the data for the United Kingdom suggests there has been a large shift (or reallocation) effect. However, there is also some preliminary evidence that within-industry productivity has not been hit as badly in intensive digital-using industries compared to less intensive digital-using industries.Footnote 6
The accelerated shift toward remote working, as a result of COVID-19, accentuates the importance of digital transformation as a driver of the productivity recovery. Pre-COVID research has shown that employees who work from home can be highly productive, provided the working conditions at home are right (Bloom et al., Reference Bloom, Liang, Roberts and Ying2013). However, this productivity gain is not a given. For example, management research shows a weakening of innovation in remote work settings, especially in hybrid settings with some employees working in the office and others working at home. There seems to be a clear advantage to firms that had previously adopted digital technologies to be better at adopting new technologies, and create new products (Riom and Valero, Reference Riom and Valero2020). The potential productivity benefit from virtual work should be an integrated part of a firm’s innovation and business strategy (Gratton, Reference Gratton2020).
6. Conclusion: How to not miss the productivity recovery once again?
How can another phase of sluggish productivity growth, as it occurred over the past 15 years, be avoided? The key to a successful medium-term recovery is to turn the post-recession procyclical productivity rebound into a new era of sustained productivity growth. Those effects in part arise from a ‘cleansing effect’ as the failing firms are often the less productive ones, new and more productive firms enter and incumbent companies absorb the resources (labor and capital) that have been freed up during the recession to drive technological change and innovation (Foster et al., Reference Foster, Grim and Haltiwanger2016). However, such reallocation of resources requires a competitive business environment with low entry barriers that allows ‘zombie firms’ and other types of low productive companies to leave the market and new firms to start up. Some of the latest research shows that the business environment in the United States has not been very conducive to dynamic market competition in recent years, while European markets are in fact more competitive (Philippon, Reference Philippon2019).
Our research suggests that, once the recovery gets underway, digital transformation may have sufficiently matured to provide the key to a sustained recovery in productivity. Digital transformation goes beyond the invention of new digital technologies and needs to lead to diffusion and adoption across the economy. Firms must also create the capacity to absorb and apply technology by way of a skilled workforce, investments in organisational capabilities such as agility and resiliency and a strong innovation culture. New innovations (including those from digital technology or biosciences, as well as innovative solutions for services) may be developed by individual firms in their drive toward revenue and profits. These activities will benefit entire industries or sectors when adopted more broadly creating spillover effects in the form of total factor productivity growth.
There are several implications for macroeconomic and structural policies related to guide this process. For example, tax incentives and grants to accelerate digital adoption may be especially effective when coming out of the recession. Policies which focus on improving physical infrastructure (including widespread broadband, investment in home offices) and human capabilities (worker well-being and managerial capabilities) to deal with digital transformation, may also be conducive for productivity growth. Finally, governments should carefully balance the combined impact of innovation and technology policies and the regulation of markets, and thereby address both national and regional effects.
Acknowledgements
This paper is based on an earlier working paper by the authors which was commissioned by the European Commission, DG ECFIN (van Ark et al., 2019, 2020). It also builds on the Inaugural Prais Lecture on Productivity which the first author delivered at the National Institute for Economic and Social Research on 4th November 2019. The content is updated in light of the COVID-19 pandemic and considers the short- and long-term impacts of the crisis on productivity. This paper includes several empirical updates and reflects the helpful comments from a reviewer.


