

I. INTRODUCTION
As the research interest in the use of nanoparticles (NPs) for healthcare and medical applications increases, so does the need for accurate quantification of the fate and effects of these materials on cell functions. Given the heterogeneity present in biological systems, the use of single-cell analysis techniques for both biological markers and NP content is crucial if biological effects are to be accurately correlated and understood (Drescher et al., Reference Drescher, Giesen, Traub, Panne, Kneipp and Jakubowski2012). For typical cell biological applications, light microscopy such as confocal, or two photon laser scanning using fluorescent markers are among the most common imaging methods employed to probe biological functions and the presence of specific markers at the single-cell level (Peng, Reference Peng2008). Inorganic NP content can be obtained in bulk assays with the most commonly used technique being inductively coupled plasma mass spectrometry (ICP-MS) (Subiel et al., Reference Subiel, Ashmore and Schettino2016). Laser ablation ICP-MS (Drescher et al., Reference Drescher, Giesen, Traub, Panne, Kneipp and Jakubowski2012) and reflectance confocal microscopy are methods that have been applied to quantifying inorganic NP content at the single-cell level; however, these methods typically only provides qualitative measures of NP content (Liu et al., Reference Liu, Kempson, De Jonge, Howard and Thierry2014). Recent advances in synchrotron X-ray fluorescence (XRF) detector technology have now made it possible for statistically significant numbers of cells to be analysed for elemental content in within manageable time frames (Vogt and Lanzirotti, Reference Vogt and Lanzirotti2013; Kempson et al., Reference Kempson, Smith, Gao, Jonge and Thierry2014). The advantage of using XRF over the variants of ICP-MS are high-speed acquisition of multiple elements simultaneously as well as being a non-destructive technique; the latter being advantageous for correlative studies. This allows inorganic NP content to be analysed in the exact same cells as imaged with optical microscopy techniques.
Gold nanoparticles (AuNPs) have been proposed for numerous biological applications because of a combination of favourable properties such as high biocompatibility, ease of surface functionalisation, and specifically for imaging and therapeutic applications, a high atomic number (Jain et al., Reference Jain, Hirst and O'Sullivan2012). Numerous studies have shown the potential for AuNPs to be used as radiosensitisers. Reports range from in vitro (McMahon et al., Reference McMahon, Hyland, Muir, Coulter, Jain, Butterworth, Schettino, Dickson, Hounsell, O'Sullivan, Prise, Hirst and Currell2011a), in vivo using both X-ray and proton beams (Hainfeld et al., Reference Hainfeld, Slatkin and Smilowitz2004; Liu et al., Reference Liu, Wang, Chen, Chen, Leng, Chien, Wang, Kempson, Hwu, Lai, Hsiao, Yang, Chen and Margaritondo2010) as well as Monte Carlo simulations (Douglass et al., Reference Douglass, Bezak and Penfold2013). The significant inter-cellular heterogeneity of internalised AuNP content (Turnbull et al., Reference Turnbull, Douglass, Paterson, Bezak, Thierry and Kempson2015) and large distributions of γH2AX foci values post-irradiation demonstrate the need for correlative microscopy analysis for the investigation of subtle correlations between cell response markers, such as γH2AX and potential radiosensitisers. Another advantage of obtaining single-cell correlated data is the identification of sub-populations within cell cultures and how these may play a role in understanding cellular responses in radiosensitisation studies.
Along with data acquisition advancements, computational techniques need to be developed in parallel to reliably and efficiently process large data sets with input images from two or more entirely different acquisition modalities. In the case presented here, inorganic NP content (gold) quantified using synchrotron XRF has been correlated with γH2AX, a marker for DNA double-strand breaks (DSBs). γH2AX represent DNA DSBs in a 1:1 manner (Subiel et al., Reference Subiel, Ashmore and Schettino2016). In this study, we present a custom MATLAB script (see Supporting Information) to correlate the number of AuNPs in an individual cell with the number of γH2AX (i.e. DSBs) in the same cell for large numbers of cells to investigate fundamental aspects of NP radiosensitisation mechanisms. This is motivated by potential advances in therapeutic applications of inorganic NP radiosensitisers, which have entered human trials (Brun and Sicard-Roselli, Reference Brun and Sicard-Roselli2016).
II. EXPERIMENTAL
A. Cell preparation and staining for γH2AX foci
The human prostate cancer cell line, PC-3, was purchased from Sigma-Aldrich. Cells were grown in RPMI-1640 (Sigma-Aldrich, St. Louis, Missouri, USA) media containing 10% fetal bovine serum (Life Technologies, Carlsbad, California, USA) and 2% penicillin/streptomycin (Sigma-Aldrich). Prior to use, 1% L-glutamine (Sigma-Aldrich) was added to the media. Cells were incubated at 37 °C in a humidified environment in the presence of 5% CO2.
Cells were seeded at passage 8 and cultured on tissue culture-treated polymer coverslips (Ibidi, Martinsried, Germany) at a density of 20 000 cells well−1. Cells were incubated in a humidified chamber at 37 °C in 5% CO2, the media was removed, and media containing the transferrin-conjugated AuNPs was added. Cells were incubated for 2 h in the NP media after which the media was removed and replaced with fresh media and placed back in the incubator for a further 1 h prior to transport for irradiation.
Cells were incubated for 1 h post-irradiation prior to fixation and staining for γH2AX foci. Cell nuclei were identified and imaged using DAPI. After images were acquired, samples were rinsed thoroughly with Milli-Q water and dried in preparation for XRF analysis.
B. AuNP preparation and irradiation conditions
A AuNP solution (0.6 nM) was prepared by the standard sodium citrate reduction method proposed by Enüstün and Turkevich (Reference Enüstün and Turkevich1963) and widely published in the literature (Liu et al., Reference Liu, Kempson, De Jonge, Howard and Thierry2014, Reference Liu, Liu, Jin, He, Zheng, Dai, Ye, Zhao, Chen and Li2015; Cruje and Chithrani, Reference Cruje and Chithrani2015). AuNPs were first treated with a polyethylene glycol (PEG) solution consisting of a mix of short-chain (458.6 Da) to long-chain (2000 Da) PEG (Rapp Polymere, Tübingen, Germany) at a volume ratio of 4:1 based on a previously established protocol (Liu and Thierry, Reference Liu and Thierry2012). The PEGylated AuNPs were then conjugated with human transferrin (Sigma Aldrich) after activation of terminal carboxylic acid groups using standard carbodiimide chemistry to increase cell uptake.
Cells were irradiated at the Royal Adelaide Hospital (RAH) Radiation Oncology Department with a microSelectron Iridium-192 source (Nucletron B-V., Veenendaal, The Netherlands) used for high-dose rate brachytherapy treatments.
C. Confocal and XRF image acquisition and processing
Fluorescence images were acquired using confocal laser scanning microscopy (ZEISS LSM 710; Carl Zeiss, Hamburg, Germany). Images were acquired with a 20× objective using two lasers to provide excitation at 488 nm for γH2AX and 405 nm for DAPI. Image dimensions were approximately 3 mm in the x-direction and 0.4 mm in the y-direction (7168 × 1024 pixels) acquired with 25 slices in the z-direction (48 µm total z depth). XRF elemental distributions were acquired at the Australian Synchrotron XRF microscopy beamline using previously described methods (Paterson et al., Reference Paterson, de Jonge, McKinlay, Starritt, Kusel, Ryan, Kirkham, Moorhead and Siddons2011; Turnbull et al., Reference Turnbull, Douglass, Paterson, Bezak, Thierry and Kempson2015). Raw confocal image sets consisted of two separate channels (DAPI for cell nuclei and γH2AX). Images were exported as raw .czi files and converted to maximum intensity projections for each channel using ImageJ (National Institutes of Health, version 1.47t) and saved as TIFF files.
The three image layers (DAPI, γH2AX, and XRF Au map) were aligned in Adobe Photoshop CC (2015 Adobe Systems Incorporated, San Jose, California, USA) and exported as TIFF files for analysis in MATLAB (2016a).
D. MATLAB script for foci counting and AuNP quantification
To correlate numbers of γH2AX foci with internalised AuNP content, a custom analysis script was written in MATLAB. An overview of the analysis procedure is provided in Figure 1.
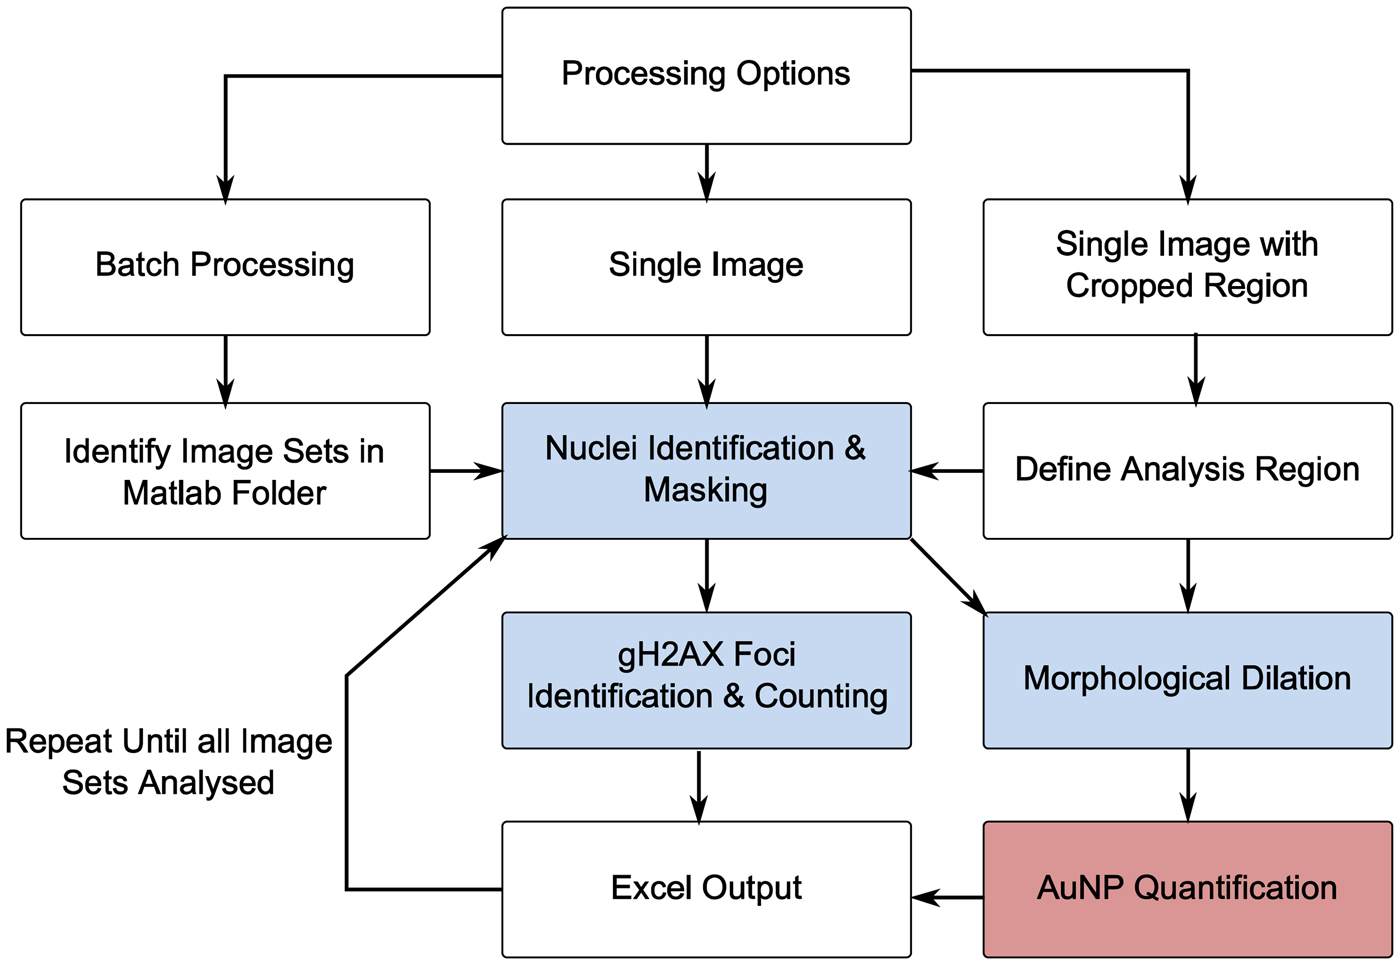
Figure 1. (Color online) Overview of MATLAB analysis process (blue = confocal image; red = XRF image).
Given that the range of typical experimental data will vary depending on experimental design and the number of variables being tested, the script was constructed so that the image sets can be processed in three different ways depending on the user requirement [see Figure 2(a)]. The three options are: process a single image set; batch process whereby all image sets in the current MATLAB folder are identified and processed; or lastly, a specific region from an image set. The last option makes use of the imcrop function that allows the user to draw a rectangular region on the DAPI image [see Figure 2(b)]. This region is then cropped from all three image layers, and the analysis is only performed using the defined region. This option is typically used to define user thresholds for parameters, such as pixel intensity thresholds and pixel areas for key features that will be discussed below as well as debugging and generation of figures.
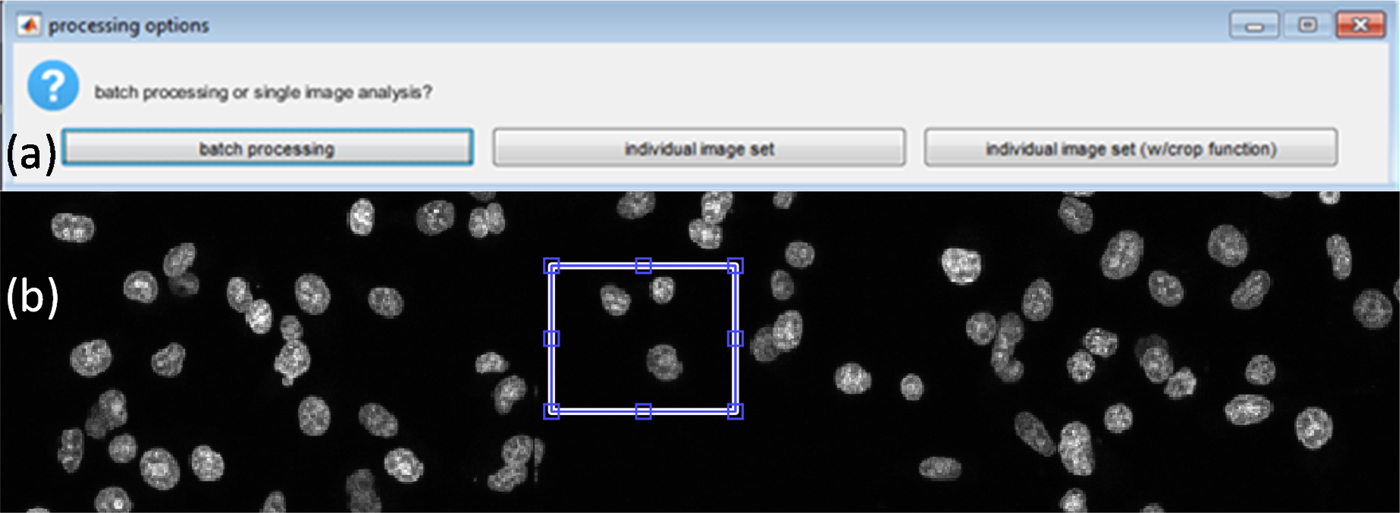
Figure 2. (Color online) (a) Processing options. (b) Defining analysis region using the crop regions option.
E. Cell identification and nuclei masking
Firstly, cell nuclei are masked, so that only pixels within the region defined by the mask on the γH2AX channel are considered as candidates for γH2AX foci. This is achieved using the DAPI image and defining a pixel threshold that defines the minimum pixel intensity required to be considered as part of the cell. Any pixels below this value are set to 0. The built in MATLAB filter fspecial is used to create a two-dimensional circular filter of a user-specified radius that allows for increased sharpness in defining discrete nuclei. A Gaussian filter is then applied and nuclei boundaries are defined and stored [see Figure 3(d)]. The next step is to assign a cell number to all identified nuclei. This is performed using the MATLAB function watershed that returns a label matrix; these labels or cell numbers in this case are used later to correlate the foci count with Au content.
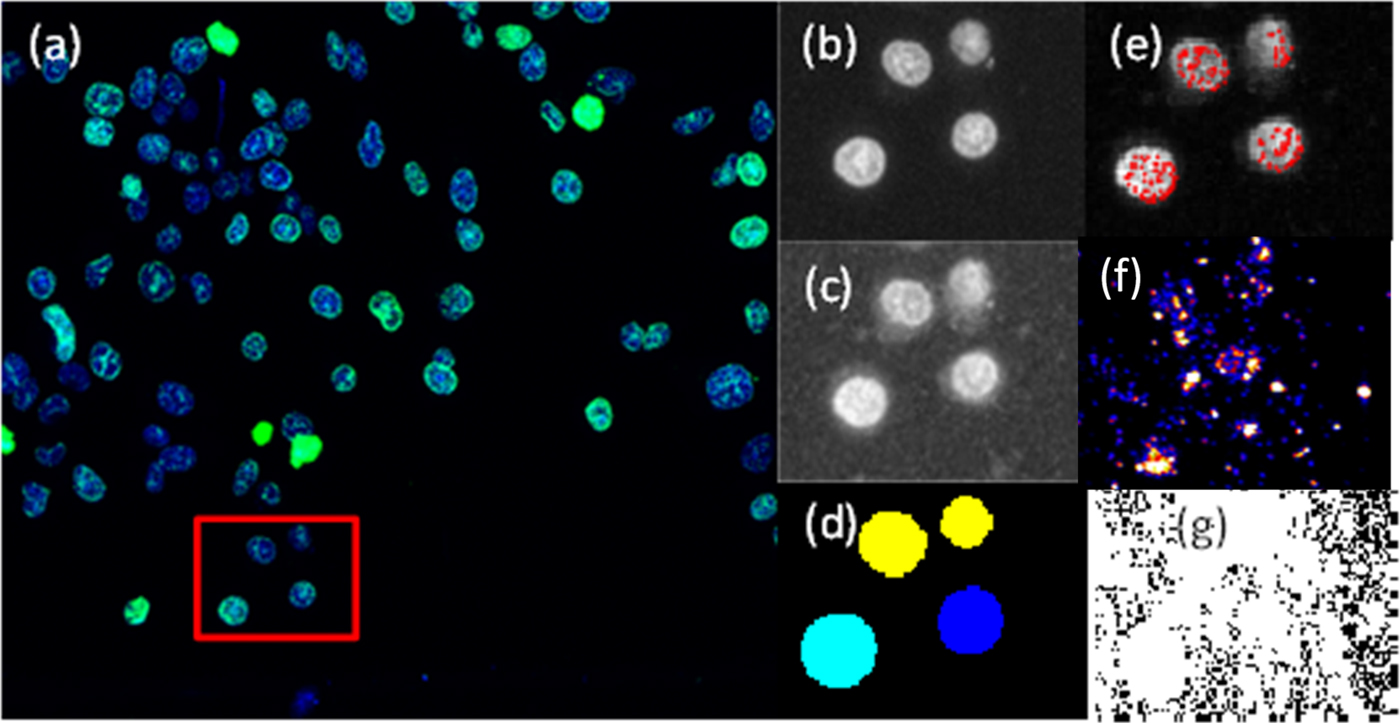
Figure 3. (Color online) Confocal image and cells analysed by defining a region (red box) using the cropped image option. (a) Confocal image of cell nuclei (blue) and γH2AX (green). (b) DAPI greyscale input image. (c) γH2AX greyscale input image. (d) Cell nuclei as identified by the MATLAB script from the DAPI image. (e) Identified γH2AX foci (red). (f) Artificial colour XRF image of Au distribution output from GeoPIXE™ (Ryan, Reference Ryan2000). (g) Exported XRF quantitative Au element distribution used for Au quantification.
F. γH2AX foci identification and counting
The next step is to use the nuclear mask from the previous step with the γH2AX image to identify and count γH2AX foci. After masking the γH2AX image for nuclear regions, a second mask is applied to reduce noise whereby any pixels with intensities below what is considered the minimum pixel intensity required to form a component of a foci are set to zero. After masking and reduction of noise, foci are then quantified in two steps. Firstly, the MATLAB function ordfilt2 is utilised to eliminate any single bright pixel from being counted as foci. To do this, a check is run to ensure that there are enough pixels grouped together of sufficient intensity to be considered a potential focus. This step generates a logical array containing 1 s wherever a local extrema is found and 0 s elsewhere. The next step is to define and count the number of foci in a given nucleus. This step is achieved by a simple logical check that the pixels corresponding to a local extrema in the previous step have a raw pixel intensity value higher than the user-defined minimum for a foci, and these are scored as a foci as shown in Figure 3(e).
During the analysis, checks are implemented to filter out any cells that have been incorrectly masked by defining the maximum and minimum nucleus size in pixels, i.e. DAPI-stained regions must be of a certain rational area to be considered a cell. Along with regions excluded because of size, the script will employ a check based on the mean γH2AX pixel intensity of a cell; specifically, if the mean γH2AX pixel value of the cell is higher than the minimum value defined to be a component of a focus, the cell will be defined as “pan-stained” (indicating a cell undergoing death via apoptosis) and excluded from further analysis. If any cells are excluded during the analysis, then the foci count is set to zero in the exported data summary.
G. AuNP quantification
Given that the exact cellular location of the internalised AuNPs may be anywhere within the cell, a mask needed to be created from the DAPI image to represent the cell as a whole for the subsequent quantification of AuNP content. This assumes that the NPs within the defined dilation can contribute to an increase in DSBs (McMahon et al., Reference McMahon, Hyland, Muir, Coulter, Jain, Butterworth, Schettino, Dickson, Hounsell, O'Sullivan, Prise, Hirst and Currell2011b). To achieve this, the MATLAB function strel was applied, this function is used for morphological dilation with the user having the choice of the dilation factor, and the choice of such will be dependent on experimental considerations. The boundary of a cell region is thus defined by the dilation of the nucleus area with dilation of the DAPI. This mask is then superimposed over the XRF image, in this case the raw gold image [see Figure 3(g)], and the pixel values are integrated within the mask to quantify the gold total content in the area of the cell as defined by the mask.
H. Data output
Once the analysis is complete, a Microsoft Excel output is generated and is given the same filename as the original input images. The output file contains the following data ordered such that each row is a single cell with the columns containing the following data (in order) – foci, pan stained (1 = pan stained, 0 = not), Au content (pg), cell size (pixels), x-coordinate (of cell centre), y-coordinate (of cell centre).
III. RESULTS AND DISCUSSION
Figure 3 visually outlines the step-by-step process shown in Figure 1 of taking the two-channel confocal image and processing it through the MATLAB script developed to quantify the number of γH2AX foci in each cell [see Figure 3(e)]. Figure 3(g) shows the raw XRF image for which the morphological mask generated is used to define the cell region for cellular AuNP quantification.
Figure 4 presents the effects of modifying the two key analysis parameters for γH2AX foci quantification, specifically the minimum pixel intensity threshold and size in pixels of quantified γH2AX foci, the results of which are summarised in Table I. This flexibility allows the user to modify the analysis parameters to correctly reflect the image quality and intensities, which may vary because of a large number of unavoidable experimental considerations and variables.
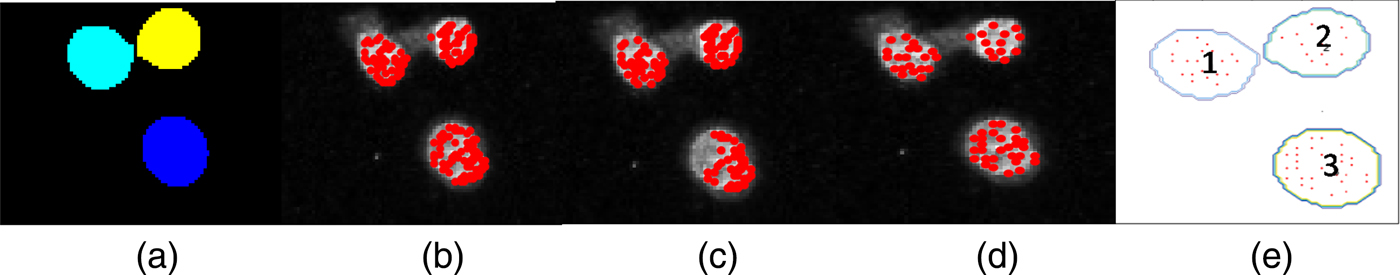
Figure 4. (Color online) Effect of changing analysis parameters on γH2AX foci counts. (a) Cell nuclei identified from DAPI image. (b) Identified foci using threshold setting #1 (Table I). (c) Identified foci using threshold setting #2 (Table I). (d) Identified foci using threshold setting #3 (Table I). (e) Cell numeric labels.
Table I. Effect of changing pixel threshold intensity (thresh) and foci size (ROI) (sq. pixels) on foci count, setting #1 thresh = 125, ROI = 4, setting #2 thresh = 160, ROI = 4, setting #3 thresh = 125, ROI = 9.
The process of staining cells for biomarkers, such as γH2AX for DSBs, is affected by multiple variables and experimental parameters, such as cell line, choice of substrate used for cell plating, antibodies used and their age, staining protocol, and microscope parameters such as laser power and objective used; these factors produce inter-experiment variability even for work conducted in the same laboratories. Given the complexities in experimental data acquisition, any image analysis process must be flexible and robust enough to reliably process images exhibiting differences in key analysis parameters. This issue was addressed and accounted for by having complete user control over the following analysis parameters: DAPI intensity for nuclei masking; maximum and minimum nucleus size; pixel intensity thresholds for defining foci; foci size; and the nucleus dilation factor for integrating the XRF regions for Au quantification. The option to analyse cropped regions provides the user with the capability to quickly assess the effect of the analysis parameters and tailor them to suit the specific images to be analysed.
The advantage of automating the analysis of foci quantification allows for large numbers of cells to be analysed and also large numbers of image sets, and hence experimental variables, can be batched and processed. This is especially important for mechanistic studies as it allows for a large number of experimental conditions to be analysed in an efficient and reproducible manner. As shown in Table I, threshold values affect the out data with regard to foci numbers. Values should be carefully chosen taking into account image resolution, staining quality, background noise, auto fluorescence, and other variables that can impact the definition and contrast of foci. In this sense, the foci numbers have an arbitrary component because of subjectiveness in threshold definitions. It is then paramount that the same values are used consistently across all images from the same experiment for consistent results. Given the subjectiveness in threshold values, different experiments cannot be directly compared; however, inter-experimental trends in data are still valid.
The main advantage is the consistency of analysis compared with manual counting methods, given that the threshold for all important parameters (listed above) can be adjusted at the start of the analysis to suit the specific image properties of the current data and then simply applied consistently across all conditions. This maintains objectivity in foci scoring with no potential user bias.
Although the XRF elemental map is treated as an extra channel/layer in the analysis process, it is data derived from an independent technique and thus distinct from the correlation of variables derived from the same modality, e.g. multi-channel images acquired from a fluorescence microscope with multiple laser sources. This capability can provide important cross-correlative information when studying the biological effects of agents, such as inorganic NPs. Traditionally this has not been achieved with apparatus typically used for cellular studies, such as confocal microscopy and flow cytometry.
IV. CONCLUSION
A custom MATLAB script was written that allows the quantification of γH2AX foci as a marker of DSBs and the subsequent correlation with internalised AuNP content from XRF elemental maps. The script allows user control over all key image processing variables. Without alteration, the code can be used to quantify the effects of different irradiation conditions on γH2AX foci formation as well as all elements measured by XRF. The script can be extended to be used for correlative microscopy with other biological markers or imaging modalities.
ACKNOWLEDGEMENTS
XRF analysis was performed on the X-ray fluorescence microscopy beamline at the Australian Synchrotron, Victoria, Australia. T.T is a recipient of a UniSA APA scholarship. This work was supported by NH&MRC project grant 1045841.


