


Oseltamivir phosphate (Tamiflu®) is an antiviral medication, commonly used to treat influenza A and B. Commercial oseltamivir phosphate, CASRN 204255-11-8, crystallizes in space group P21212 (#18) with a = 24.0079(3), b = 24.6716(2), c = 7.45254(5) Å, V = 4414.24(5) Å3, and Z = 8. A reduced cell search in the Cambridge Structural Database (Groom et al., Reference Groom, Bruno, Lightfoot and Ward2016) yielded a previous single-crystal structure determination at 120 K (Naumov et al., Reference Naumov, Yasuda, Rabeh and Bernstein2013).
In this work, the sample was ordered from the United States Pharmacopeial Convention (USP) (Lot # R00490) and analyzed as-received. The diffraction data for this study were collected on beamline 11-BM at the Advanced Photon Source, Argonne National Laboratory. The room temperature (295 K) crystal structure was refined (Figure 1) using synchrotron (λ = 0.414533 Å) powder diffraction data and optimized using density functional theory techniques.

Figure 1. The Rietveld plot for the refinement of oseltamivir phosphate. The blue crosses represent the observed data points, and the green line is the calculated pattern. The cyan curve is the normalized error plot. The vertical scale has been multiplied by a factor of 5× for 2θ > 1.8° and by a factor of 40× for 2θ > 7.2°.
As in Naumov et al. (Reference Naumov, Yasuda, Rabeh and Bernstein2013), we identified strong hydrogen bonds between the phosphate groups and involving the ammonium groups of the oseltamivir cations (Table I). In addition, we identified N–H⋯O hydrogen bonds involving the amide nitrogen atoms N2 and N4, as well as C–H⋯C hydrogen bonds between the two cations. The strong hydrogen bonds link the cations and the anions into columns parallel to the c-axis, with van der Waals interactions between the columns. The population analysis does not indicate any other significant intermolecular interactions. As expected, the unit cell is larger at 295 K than at 120 K (Table II). The observed unit cell expansion at 295 K is anisotropic. Compared to the unit cell reported for oseltamivir phosphate at 120 K, the thermal expansion at 295 K shifts the diffraction peaks in the powder pattern to lower 2θ, or larger d-spacing (Figure 2). This shift is significant enough that if one were to use the powder diffraction pattern calculated from the 120 K crystal structure, for phase identification, the low-temperature diffraction pattern peak positions would fall outside normal delta 2θ tolerances used in a search/match phase identification analysis. Since powder diffraction data are typically collected at room temperature, the differences in 2θ peak positions point to the need for high-quality powder diffraction data of commercial pharmaceuticals collected at ambient conditions. The Rietveld, DFT, and single-crystal structures agree well (Table III and Figure 3). The two cations have different conformations, mainly in the pentyl side chains. The powder X-ray diffraction pattern is included in the Powder Diffraction File™ (Gates-Rector and Blanton, Reference Gates-Rector and Blanton2019) as entry 00-068-1107.
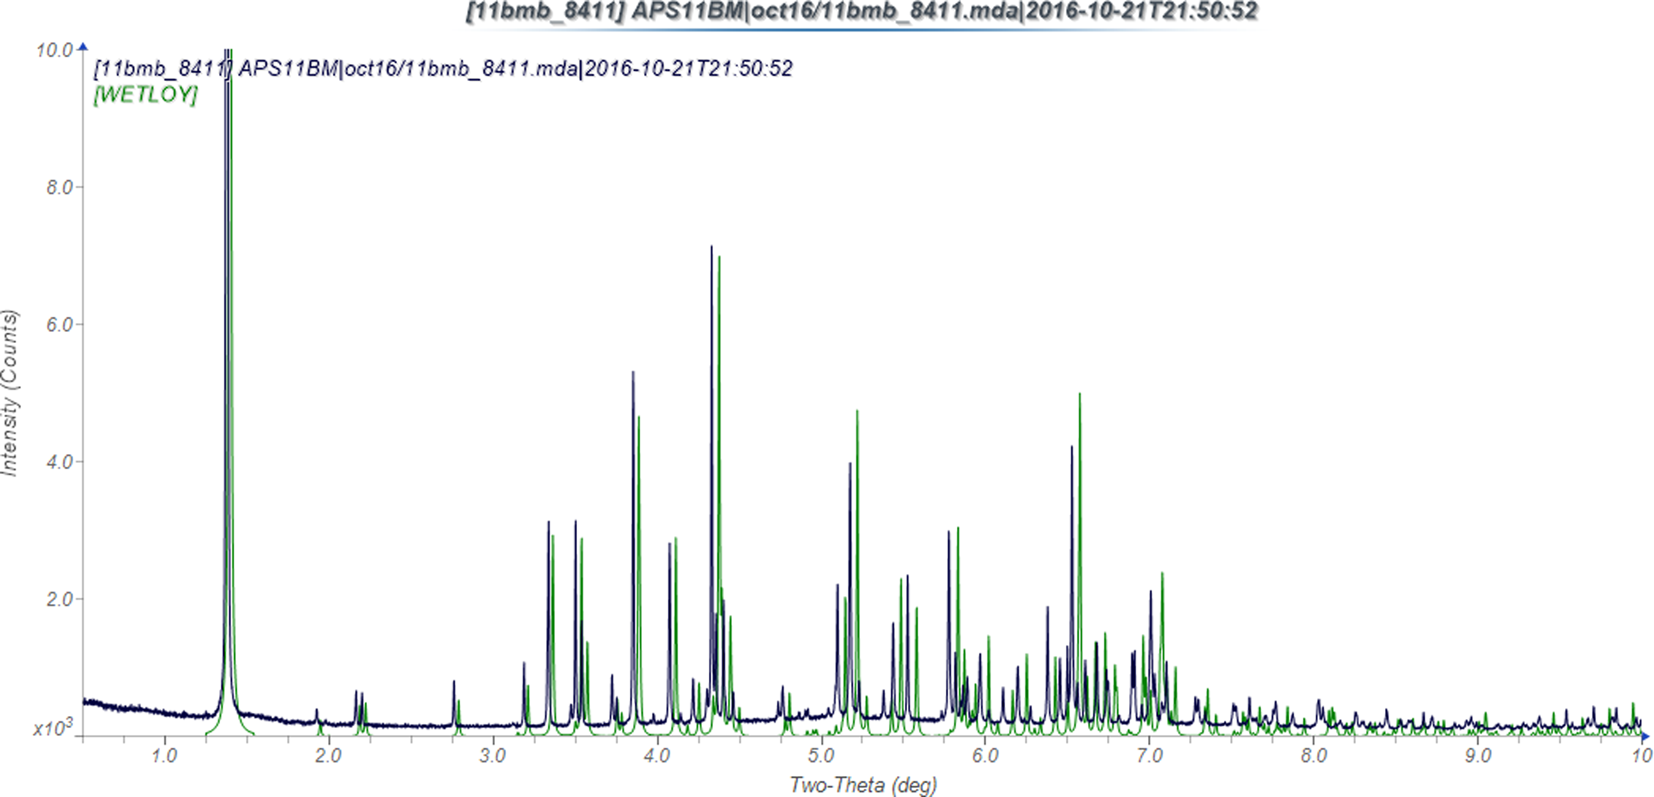
Figure 2. Comparison of the experimental powder X-ray diffraction pattern of oseltamivir phosphate at 295 K (black) and a pattern calculated from the 120 K single-crystal structure (green).

Figure 3. Powder X-ray diffraction pattern of oseltamivir phosphate. The Rietveld-refined structure is indicated in red, and the density functional theory-optimized structure is indicated in blue.
TABLE I. Hydrogen bonds (CRYSTAL14) in oseltamivir phosphate.

TABLE II. Lattice parameters of oseltamivir phosphate (space group P21212).

TABLE III. Root-mean-square Cartesian displacements (Å) in a pairwise comparison of oseltamivir structures.
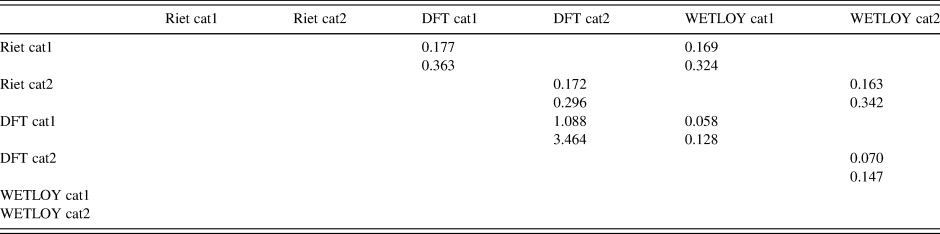
Top value = mean; bottom value = maximum.
DEPOSITED DATA
CIF files were deposited with ICDD. You may request this data from info@icdd.com.
ACKNOWLEDGEMENTS
The use of the Advanced Photon Source at Argonne National Laboratory was supported by the U.S. Department of Energy, Office of Science, Office of Basic Energy Sciences, under Contract No. DE-AC02-06CH11357. This work was partially supported by the International Centre for Diffraction Data. The authors thank Lynn Ribaud and Saul Lapidus for their assistance in the data collection and Andrey Rogachev for the use of computing resources at IIT.
CONFLICTS OF INTEREST
The authors have no conflicts of interest to declare.


