


Phenotypic and aetiological architecture of depressive symptoms in a Japanese twin sample
According to the report by the World Health Organisation (2017), more than 300 million people suffer from depression across the globe and depression is ranked in the top-10 causes of early death. In Japan, the lifetime prevalence of depression is comprised between 3% and 7% (i.e. major depressive disorder as defined by the DSM-5 criteria; American Psychiatric Association, 2013; Kawakami, Reference Kawakami2007; Kessler and Bromet, Reference Kessler and Bromet2013). Although the prevalence is somewhat lower in Japan than in Western countries (Kessler and Bromet, Reference Kessler and Bromet2013), major depression still constitutes a rather common disorder compared with other psychiatric disorders.
Accurately assessing depressive symptoms within and across populations constitutes an essential first step before elucidating the aetiology of depression. However, differences in the phenotypic architecture of dimensional measures of depression are found across populations. The typical three factor structure (i.e. cognitive, affective and somatic symptom domains) of Zung's (Reference Zung1965) Self-rating Depression Scale or SDS is sometimes found to differ across ethnically different samples. For example, four factors were found in Spanish and US samples (Passik et al., Reference Passik, Lundberg, Rosenfeld, Kirsh, Donaghy, Theobald, Lundberg and Dugan2000; Romera et al., Reference Romera, Delgado-Cohen, Perez, Caballero and Gilaberte2008). Within the Spanish sample the symptom factors reflected core depressive, cognitive, anxiety and somatic factors; whereas in the US sample, the factors were slightly different, reflecting cognitive symptoms, manifested by depressed mood, somatic non-eating and somatic eating behaviour. Meanwhile, fewer factors tend to be extracted within Asian samples. For example, an early study of ethnically Chinese people drawn from community-based clinical and non-clinical samples from Hong Kong found two factors described as: depression with somatic complaints and negative view of life (Lee et al., Reference Lee, Chiu, Wing, Leung, Kwong and Chung1994). A study of the Japanese general population found two factors: depressed affect and emptiness (Chida et al., Reference Chida, Okayama, Nishi and Sakai2004). However, three studies in Japanese undergraduates or mothers around birth have replicated the original three factors: cognitive, affective and somatic symptoms (Kitamura et al., Reference Kitamura, Hirano, Chen and Hirata2004; Sakamoto et al., Reference Sakamoto, Kijima, Tomoda and Kambara1998; Sugawara et al., Reference Sugawara, Sakamoto, Kitamura, Toda and Shima1999). Kitamura et al. (Reference Kitamura, Hirano, Chen and Hirata2004) used the largest sample and Sakamoto et al. (Reference Sakamoto, Kijima, Tomoda and Kambara1998) found the same structure using confirmatory factor analytic techniques. The content captured by the factors reported in these studies, in particular those reporting a three-factor solution, relate to the content of diagnostic criteria of the DSM-5. For example, the cognitive symptom domain reflects the DSM-5 diagnostic criteria such as diminished ability to think or concentrate, or indecisiveness, and recurrent thoughts of death; the affective symptom domain reflects a depressed mood, feelings of worthlessness or excessive or inappropriate guilt and the somatic symptom domain reflects significant weight loss or gain, and insomnia or hypersomnia.
Therefore, in this study, we first sought to accumulate reproducible knowledge about the phenotypical structure of depression using exploratory and confirmatory factor analyses. Given these previous studies, we expected to find multiple factors rather than a single factor. Additionally, we tested alternative factor solutions, including higher-order factor and bi-factor models, which both comprise general and specific factors and offer more parsimonious representations of the relationships between the multiple symptom domains of depression. Especially, a bi-factor analysis allows us (a) to simultaneously model depressive symptomatology at the general and the domain-specific levels, (b) to examine whether domain-specific factors retain any unique variance, unshared with other domains (e.g. Holzinger and Swineford, Reference Holzinger and Swineford1937).
Investigating genetic and environmental influences in depression is important because it can provide a modelling scheme that represents the complex and multi-factorial nature of symptom domain risks (Byers et al., Reference Byers, Levy, Kasl, Bruce and Allore2009). A review of twin research prior to 1999 from Australian, Swedish, British and American samples by Sullivan et al. (Reference Sullivan, Neale and Kendler2000) showed that depression has a heritable component that does not appreciably differ between community and clinical samples [h 2 = 37% (95% CI 28–42%) for community samples, and h 2 = 43% (95% CI 21–58%) for clinical samples]. More recently, a study with a large sample of Scottish families demonstrated that the heritability of depression was between 28% and 44% (Fernandez-Pujals et al., Reference Fernandez-Pujals, Adams, Thomson, McKechanie, Blackwood, Smith, Dominiczak, Morris, Matthews, Campbell, Linksted, Haley, Deary, Porteous, MacIntyre and McIntosh2015), whereas in the US sample with an extended family design the heritability estimate of depressive symptoms was not significant [h 2 = 8.6% (95% CI 0–57%), Byers et al., Reference Byers, Levy, Kasl, Bruce and Allore2009]. For non-Western countries, previous research found that the heritability of depression was also moderate, specifically ranging from 34% to 61%, except in the Sri Lankan male sample, where the heritability was only 4% (Ball et al., Reference Ball, Sumathipala, Siribaddana, Kovas, Glozier, McGuffin and Hotopf2009; Chen et al., Reference Chen, Li, Natsuaki, Leve and Harold2014; Chen and Yu, Reference Chen and Yu2015). However, interestingly, although factor analyses at the phenotypic level pointed towards the existence of multiple factors, almost all prior research on the aetiology of depression was based on the total score only, except for a few studies (e.g. McGue and Christensen, Reference McGue and Christensen1997). Therefore, few behavioural genetic studies on depression have taken into consideration the multi-dimensionality of depressive symptoms.
In this study, we aimed to examine the aetiological architecture of depressive symptoms based on findings from phenotypic confirmatory factor analyses. More specifically, the purpose of the present paper was threefold. First, we examined the factorial structure of the SDS in a twin sample from a Japanese community sample to elucidate the phenotypic structure of depressive symptoms. We compared three hypothetical models (i.e. multiple-factor, higher-order factor and bi-factor models; see Fig. 1). Second, we estimated the relative influence of genetic and environmental influences on each domain of depression symptomatology assessed by the SDS. Third, we investigated the relationships between genetic and environmental influences underlying the depressive symptom domains to determine the role these factors play in their observed covariance.

Fig. 1. Three tested models when conducting confirmatory factor analyses.
Method
Subjects and questionnaires
A mail survey was conducted as part of the ongoing longitudinal Keio Twin Study (KTS) for residents living mainly near the Tokyo area in Japan (see Ando et al., Reference Ando, Fujisawa, Shikishima, Hiraishi, Nozaki, Yamagata, Takahashi, Ozaki, Suzuki, Deno, Sasaki, Toda, Kobayashi, Sugimoto, Okada, Kijima, Ono, Yoshimura, Kakihana, Maekawa, Kamakura, Nonaka, Kato and Ooki2013). The total number of participants was 425 twin pairs including 301 MZ twin pairs (211 female MZ, 87 male MZ and 3 sex-unknown twin pairs) and 124 DZ twin pairs (56 female DZ, 26 male DZ and 42 opposite-sex twin pairs). The twins were 23.41 years old (s.d. = 4.24). The participants completed the Japanese version of the SDS (20 items, four-point Likert scale; Fukuda and Kobayashi, Reference Fukuda and Kobayashi1983; Zung, Reference Zung1965) which is widely and commonly used to assess individual differences in depressive symptoms, adequately capturing multiple symptom domains (Cheung and Power, Reference Cheung and Power2012). The descriptive statistics are shown in Table 1. As a whole, the scale was adequately internally consistent (ω = 0.89). The zygosity was determined by questionnaire items on the physical similarity and confusion of the twins by family members, friends and strangers (Ooki et al., Reference Ooki, Yamada, Asaka and Hayakawa1990; Torgersen, Reference Torgersen1979), and has been shown to categorise twin pairs correctly in over 93% of cases (Magnus et al., Reference Magnus, Berg and Nance1983; Ando et al., Reference Ando, Fujisawa, Shikishima, Hiraishi, Nozaki, Yamagata, Takahashi, Ozaki, Suzuki, Deno, Sasaki, Toda, Kobayashi, Sugimoto, Okada, Kijima, Ono, Yoshimura, Kakihana, Maekawa, Kamakura, Nonaka, Kato and Ooki2013).
Table 1. Exploratory and confirmatory factor analyses for depressive symptoms with descriptive statistics

R, reversed items; ω, McDonald's omega coefficients; EFA, Exploratory Factor Analysis; CFA, Confirmatory Factor Analysis. Standardised factor loadings are presented for EFA and CFA. The CFA model presented here is a bi-factor solution, with G, C, A, S standing for the general, cognitive, affective and somatic factors respectively. Values in the bottom three rows indicate inter-factor correlations when applying exploratory factor analysis.
Twin methods
Heritability, or the proportion of the observed variability on a measure directly attributable to genetic influences is estimated by comparing within-pair similarity (such as with Pearson's r) in MZ twins who share 100% of their genetic material to within-pair similarity in DZ twins who share on average 50% of their segregated genes (Knopik et al., Reference Knopik, Neiderheiser, DeFries and Plomin2016). Using structural equation modelling, the phenotypic variance can be decomposed into four components: additive genetic (A), non-additive genetic (D), shared environmental (C) and non-shared environmental (E) variance components. A estimates the additive genetic effects on the phenotype of interest. D represents the interactive contribution of alleles within a single locus; C, or shared environment, estimates environmental influences that make twins similar, regardless of their zygosity; and E, or non-shared environment, represents environmental influences that make twins different, and also includes measurement error. To reveal which influences significantly contribute to phenotypic variances, five models were systematically compared. We fitted the ADE, ACE, AE, CE and E models and evaluated the relative explanatory power of each model. Furthermore, to investigate the nature of the relationships between the multiple sets of symptom domains, we used multivariate genetic analyses to parameterise the variance and covariance between multiple symptoms at the same time. All the behavioural genetic analyses were performed on the raw data using the full information maximum likelihood estimation implemented in the R packages OpenMx 2.0 (Neale et al., Reference Neale, Hunter, Pritikin, Zahery, Brick, Kirkpatrick, Estabrook, Bates, Maes and Boker2016) and lavaan (Rosseel, Reference Rosseel2012). The model fits were evaluated by using the χ2 index and Akaike's Information Criterion (AIC; Akaike, Reference Akaike1987) which is calculated by χ2−2df as well as the Bayesian Information Criterion (BIC, Schwarz, Reference Schwarz1978; Sclove, Reference Sclove1987). The model with the lowest AIC and/or BIC indicates the best fit.
Results
Descriptive statistics and exploratory and confirmatory factor analyses
The descriptive statistics for each SDS item are shown in Table 1. We first examined the age and sex differences in the total depressive symptoms score. We found no significant correlation between age and the total SDS score (r = −0.05, p = 0.18), and no significant differences between the sexes [t(837) = 1.09, p = 0.28]. Although the effects of age and sex on depressive symptoms were statistically insignificant, the regression residuals obtained after controlling for these two factors were used in all of the following analyses (McGue and Bouchard, Reference McGue and Bouchard1984).
The SDS items were subjected to maximum likelihood factor analysis with direct Oblimin rotation, using one twin randomly selected from each twin pair. Five items [i.e. (a): I have trouble with constipation, (b): Morning is when I feel the best (reversed item), (c): I feel that others would be better off if I were dead, (d): I find it easy to do the things I used to (reversed item) and (e): I notice that I am losing weight] showed low factor loadings, which were less than 0.35 on all components and showed high complexity over 2.0, which means none of these five items could contribute efficiently to a simple structure (Hofmann, Reference Hofmann1978). A previous study also found that the first two items [i.e. (a) and (b)] had low loadings when a principal component analysis was conducted (Sakamoto et al., Reference Sakamoto, Kijima, Tomoda and Kambara1998). Item (c) should be classified in the affective symptom domain. However, in line with the previous study (Sakamoto et al., Reference Sakamoto, Kijima, Tomoda and Kambara1998), this was not loaded on any factors, maybe because the item exhibited a floor effect among the non-clinical samples [over two-thirds of the sample answered ‘little or none of the time (1)’ to this item] and the correlation between item (c) and other items became obscured. The content of item (d) is somewhat unspecific and hard to allocate to a specific symptom domain. Although item (e) can clearly be included in the somatic symptom domain (American Psychiatric Association, 2013), in this sample, it was dropped as loading was <0.35 and complexity >2.0. Therefore, these five items were removed from all subsequent analyses.
Our examination of a scree plot obtained with simulations implemented in the R package psy (Falissard, Reference Falissard2012) suggested three factors (Table 1 and Fig. 2). We next performed a confirmatory factor analysis using the R package lavaan (Rosseel, Reference Rosseel2012). In all tested models, the factor loadings were equally constrained across twins and zygosity groups for each item of the depression scale, so that the same factor model was specified across twins in a pair and across zygosity groups (e.g. Olsen and Kenny, Reference Olsen and Kenny2006; Wood et al., Reference Wood, Rijsdijk, Saudino, Asherson and Kuntsi2008). The three-factor model fitted reasonably well to the data, compared to other factor models. The first factor was defined by five items and could be interpreted as being within the cognitive symptom domain [e.g. ‘I find it easy to make decisions (reversed item)’]. The second factor was defined by seven items and could be interpreted as the affective symptom domain (e.g. ‘I feel down-hearted and blue’). The third factor was defined by three items and could be interpreted as the somatic symptom domain [e.g. ‘I eat as much as I used to (reversed item)’]. The resulting three-factor structure supports Zung's (Reference Zung1965) original assumption, and replicated previous research (Kitamura et al., Reference Kitamura, Hirano, Chen and Hirata2004; Sakamoto et al., Reference Sakamoto, Kijima, Tomoda and Kambara1998). McDonald's ω coefficients as measures of internal consistency were acceptable for all three symptom domains (0.86 for cognitive, 0.86 for affective and 0.59 for somatic). Additionally, the inter-factor correlations for the three-factor model were moderate, ranging from 0.32 to 0.56.

Fig. 2. Scree plotted eigenvalues with simulated random normal data (number of iterations = 20).
We then compared a first-order three-factor model with higher-order three-factor and bi-factor models. The model fit indices for the confirmatory factor analyses are shown in Table 2. The results revealed that a bi-factor model explained the data more parsimoniously than the first-order three-factor and higher-order three-factor models. Table 1 also shows factor loadings for both the general and three specific factors. The standardised loadings on the general factor ranged from 0.19 to 0.76. This means that the general factor reflects a broad depressive symptomology. Items from the cognitive symptom domain loaded strongly on the general factor and only weakly on the specific factor, indicating that the general factor adequately captured the cognitive dimension. The affective items loaded similarly on the general and the specific factor. Items for the somatic symptom domain loaded more strongly on the specific factor as opposed to the cognitive symptom domain, indicating that the specific factor captured more of the variance in somatic items than the general factor.
Table 2. Model fit indices to compare four confirmatory factor analyses

AIC, Akaike's Information Criteria; BIC, Bayesian Information Criteria; RMSEA, Root Mean Square Error of Approximation; SRMR, Standardised Root Mean Square Residual. Bold face indicates the best fitting model.
Univariate genetic analysis
The heritability of the total sum-score and the sum-scores reflecting the three dimensions are provided in Table 3. The results from the analyses including opposite sex DZ twins are presented as they were very similar to the results from the analyses excluding opposite sex twins. Estimates indicate that non-additive genetic and shared environmental effects were not detected for any symptom domain and that the AE model fitted the data best, which is consistent with prior empirical studies (e.g. Ball et al., Reference Ball, Sumathipala, Siribaddana, Kovas, Glozier, McGuffin and Hotopf2009; Chen et al., Reference Chen, Li, Natsuaki, Leve and Harold2014; Kendler et al., Reference Kendler, Aggen and Neale2013). The heritability of these symptoms ranged between 0.27 for the somatic symptom domain and 0.41 for the cognitive symptom domain.
Table 3. Genetic and environmental influences on sum-scores indicating three symptom domains and a total score for depression
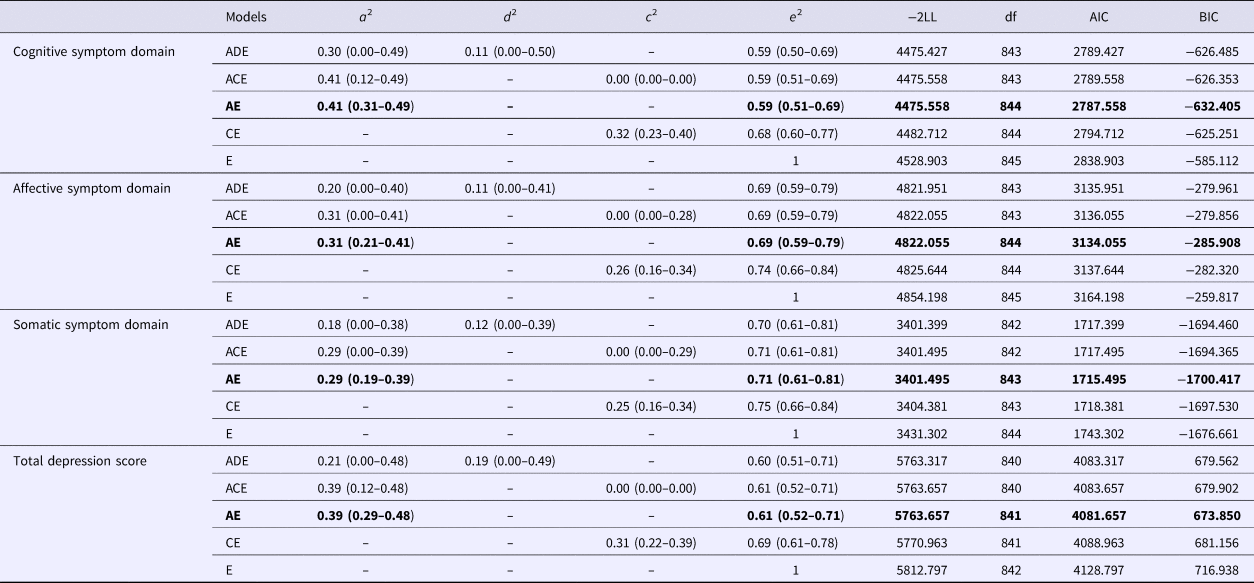
Numbers in parentheses show 95% confidence intervals. a 2 = additive genetic effect, d 2 = non-additive genetic effect, c 2 = shared environmental effect, e 2 = non-shared environmental effect. −2LL = −2 × Log Likelihood, −2LL follows a χ2df distribution; df, degree of freedom; AIC, Akaike's Information Criteria, BIC, Bayesian Information Criteria. Bold faces indicate best fitting models.
Multivariate genetic analysis
Given that individual differences between the depressive symptom domains were explained by only additive genetic (A) and non-shared environmental (E) influences, the multivariate genetic analyses utilised in this section implemented an AE model. Additionally, on the basis of results from the phenotypic confirmatory factor analysis, we selected the best-fitting factorial structure for multivariate genetic modelling, namely a bi-factor solution including a general factor with three specific factors (i.e. cognitive, affective and somatic symptom domains). As shown in Table 4, the variation in the general factor labelled depression was explained by the common genetic factor (47.0%), and by the non-shared environmental factor (53.0%). The symptom domain-specific genetic effect accounted for 29.4% of the variance only in the affective symptom domain, but no significant amount of variance in the cognitive and somatic symptom domains. The symptom domain-specific non-shared environmental effects, including the measurement error, were significant in all three symptom domains and explained the variance from 69.6% to 81.8%. In sum, our results revealed a genetic contribution to the general factor of depression, suggesting a set of shared genetic effects across all items. Specific genetic influences were present only for the affective symptom domain. Moreover, in the general factor and even more so in the specific factors, non-shared environmental effects were prominent.
Table 4. Genetic and non-shared environmental parameters on each factor from the bi-factor solution

Discussion
The aims of this study were: (a) to examine the factorial structure of the SDS in a Japanese twin sample; (b) to estimate the relative contributions of genetic and environmental influences on depressive symptoms dimensions; and (c) to investigate the multivariate genetic and environmental architecture underlying depressive symptom factors.
Factorial structure of depression symptomatology
The results of our exploratory factor analysis yielded three factors describing cognitive, affective and somatic symptomatology. This analysis demonstrated that in a Japanese sample, a three-factor solution describes depressive symptoms better. This is in line with Zung's (Reference Zung1965) original assumption and as reported by previous studies (Kitamura et al., Reference Kitamura, Hirano, Chen and Hirata2004; Sakamoto et al., Reference Sakamoto, Kijima, Tomoda and Kambara1998). Moreover, findings from a series of confirmatory factor analyses supported the idea that a bi-factor model with a general factor and three specific factors fitted the data better than the other alternative models. This suggests that depression may be interpreted as a general psychological construct with three residual factors reflecting cognitive, affective and somatic symptom domains. This general factor captured the variance in cognitive symptoms more fully, followed by affective symptoms and, to a lesser extent, somatic symptoms. Previous studies have reported that a bi-factor solution fits best to the data on other depression scales [e.g. Fong et al., Reference Fong, Chan, Ho, Chan, Chan and Ng2016 for the Center for Epidemiologic Studies Depression Scale (CES-D), and McElroy et al., Reference McElroy, Casey, Adamson, Filippopoulos and Shevlin2018 for the Beck Depression Inventory II (BDI-II)]. Our study could contribute to the accumulating evidence that, across scales, depression appears more likely to have a bi-factor structure rather than a single factor, multiple factors or higher-order factor structure.
Within a non-clinical setting, we were able to demonstrate that the structure of depressive symptomatology could be represented by a general factor, which captured individual differences across a broad range of depressive symptoms. In addition to this core general factor, three factors captured the specific variance shared by items within each of three dimensions − affective, cognitive and somatic. If these findings can be replicated in a clinical sample, this implies that clinicians have to simultaneously attend to depression as a general construct while still attending to specific manifestations, which can be independent of the general construct and of each other. Namely, some patients may manifest somatic symptoms while not having elevated levels of affective and/or cognitive symptoms. As such, differential therapeutic strategies should ideally attend to differential symptomatic profiles.
Genetic and environmental influences on cognitive, affective and somatic domains
Univariate genetic analyses for sum-scores reflecting each dimension were explained by additive genetic and non-shared environmental influences only. These results are congruent with those from a previous meta-analysis (Sullivan et al., Reference Sullivan, Neale and Kendler2000). Heritability estimates were rather comparable, ranging from 29% to 41% for each of the three symptom domains, and approximately two-thirds of the individual differences in each symptom dimension were explained by non-shared environmental influences (Ball et al., Reference Ball, Sumathipala, Siribaddana, Kovas, Glozier, McGuffin and Hotopf2009; Fernandez-Pujals et al., Reference Fernandez-Pujals, Adams, Thomson, McKechanie, Blackwood, Smith, Dominiczak, Morris, Matthews, Campbell, Linksted, Haley, Deary, Porteous, MacIntyre and McIntosh2015; Sullivan et al., Reference Sullivan, Neale and Kendler2000). Although several previous studies reported significant shared environmental influences (Chen et al., Reference Chen, Li, Natsuaki, Leve and Harold2014; Happonen et al., Reference Happonen, Pulkkinen, Kaprio, Van der Meere, Viken and Rose2002), they utilised children and adolescent twin pairs and their parents, whereas the present study was conducted in an adult sample.
Multivariate genetic architecture of depression symptomatology
Genetic contributions
We conducted multivariate genetic analyses based on the results of our exploratory and confirmatory factor analyses. In response to the best-fitting model suggested from our factor analyses at the phenotypic level, we fitted a bi-factor model to the data for behavioural genetic modelling. Previous twin research has shown that depression is substantially heritable. However, to the best of our knowledge, this is the first study fitting a bi-factor model within a twin design to examine the aetiology of depression. As shown in Table 1, almost all items loaded substantially on the general factor, suggesting that a common heritable factor may adequately reflect depression symptomatology. Our estimate of the heritability of the general factor of depressive symptoms was substantial [47.0% (95% CI 36.8–57.1%)], with a higher point estimate than for any of the sum-score reflecting the symptom dimensions. Interestingly, the estimated heritability of the general factor from a bi-factor model was higher than that of the total sum-score. This suggests that the use of bi-factor architecture reduced the measurement error for the general factor, enabling a better estimation of the aetiological components (Henry et al., Reference Henry, Pingault, Boivin, Rijsdijk and Viding2016). Furthermore, our bi-factor model revealed that a significant specific genetic contribution was detected only for the affective symptom domain even though univariate genetic analyses had detected significant heritability for all symptom domains. This suggests that affective symptoms might be influenced by specific genetic influences not captured by the general factor, indicating a partial aetiological independence of the affective symptom domain from the general factor among a Japanese sample.
Overall and in line with the previous studies, our findings supported substantial heritability of the general factor for depressive symptomatology. A shared genetic risk for the general factor of depression may be linked to precursors of depressive symptomatology (e.g. neuroticism of personality traits, Luciano et al., Reference Luciano, Hagenaars, Davies, Hill, Clarke, Shirali, Harris, Marioni, Liewald, Fawns-Ritchie, Adams, Howard, Lewis, Gale, McIntosh and Deary2018). By contrast, prior research on major depression assessed by personal interview (Kendler et al., Reference Kendler, Aggen and Neale2013) revealed that major depression criteria from the DSM-IV did not reflect a single dimension of genetic liability, indicating that genetic influences on clinical criteria of major depression were heterogeneous and reflected the three underlying dimensions of major depression. Differences in results could reflect differences in methods, in particular assessment methods and fitted models because Kendler et al. (Reference Kendler, Aggen and Neale2013) did not fit a bi-factor model to their data.
Our findings of moderate genetic influences on the general factor are consistent with previous research demonstrating that depression is moderately heritable (Sullivan et al., Reference Sullivan, Neale and Kendler2000). We also found that specific factors were mostly influenced by non-shared environmental rather than genetic influences (except for the affective domain in our sample). Whether our findings of a bi-factorial structure and the corresponding estimates of genetic and environmental influences can be replicated using other depression scales remains to be fully investigated. So far, previous studies have shown that the CES-D and BDI-II have a bi-factor structure at the phenotypic level (Fong et al., Reference Fong, Chan, Ho, Chan, Chan and Ng2016; McElroy et al., Reference McElroy, Casey, Adamson, Filippopoulos and Shevlin2018). Additional research is clearly needed in the area. If our findings are confirmed, two interpretations are plausible. First, the fact that the general factor is more heritable than the specific factors, which are mainly explained by the E component, may be due to measurement error. The E component includes both genuine non-shared environmental influences and measurement error. Consequently, the specific factors, which by definition rely on less items, may suffer more from measurement error, artificially lowering heritability and increasing non-shared environmental estimates. Alternatively, we can speculate that the general liability to depression is indeed more heritable, whereas specific manifestations of the disease (i.e. cognitive, affective or somatic) are more dependent on person-specific environmental influences. If verified, such a structure might contribute to explain cross-cultural differences in the clinical manifestations of the common liability to depression.
Non-shared environmental contributions
Non-shared environmental influences accounted for half of the variance in the general factor, and 70–82% of the variance in the domain-specific factors. Importantly, estimates of non-shared environmental influences also include measurement error. These results raise the possibility that, while a general genetic factor largely accounts for the communality between symptoms of depression, non-shared environmental influences may explain most of the dimension-specific factors. According to prior available research, stressful life situations (e.g. individual loss experience such as a job or a beloved one, and interpersonal conflict at social contexts) could be plausible candidates of non-shared environmental triggers (Mazure, Reference Mazure1998 for a review). Therefore, the utility of such specific factors once the general factor is accounted for should be tested in further studies, for example, by testing whether specific factors uniquely associate with predictors and outcomes of depressive symptomatology.
Strengths and limitations
The present study has several limitations. One limitation is that because of the relatively small size of the twin sample, we did not test for sex differences in the measurement and aetiological models. The development of depression may involve sex differences, and females generally do show a higher prevalence of depression. However, previous studies on the heritability of depression showed mixed results: several previous studies reported no differences in heritability between females and males (Agrawal et al., Reference Agrawal, Jacobson, Gardner, Prescott and Kendler2004; Chen and Yu, Reference Chen and Yu2015; Foley et al., Reference Foley, Neale, Gardner, Pickles, Prescott and Kendler2003), while other studies found that sex differences in heritability did exist (Kendler et al., Reference Kendler, Gardner, Neale and Prescott2001; Reference Kendler, Gatz, Gardner and Pedersen2006). Since a sex-limitation analysis in behavioural genetic models can help answer the question of whether females and males are influenced by the same amount of genetic and environmental influences, further research with a larger sample size in Asian populations is needed. Another possible limitation is that the twin sample used in the present study is based on a healthy population sample, not a clinical sample. However, Kendler et al. (Reference Kendler, Gatz, Gardner and Pedersen2006) and Sullivan et al. (Reference Sullivan, Neale and Kendler2000) have suggested that findings from general population sample studies of depression are comparable to those of clinical sample studies, and research on depression symptomatology in non-clinical samples is important in its own right. Specifically, it can be argued that using a non-clinical sample allowed us to study the phenotypic and genetic architecture of individual differences in depression using a broad range of depression scores, whereas a clinical sample may entail range restrictions and reduced correlations.
Conclusions
Despite the above limitations, by using a genetically informative sample, the present study extended previous findings in several ways. Confirmatory factor analyses at the phenotypic level confirmed the multidimensionality of individual differences in depressive symptoms and, in addition to a general factor, identified three residual factors reflecting three domains of depressive symptoms: cognitive, affective and somatic. Most importantly, multivariate genetic modelling revealed that the general factor, which adequately reflected depressive symptomatology across dimensions, was moderately heritable, whereas domain specific factors were mostly influenced by non-shared environmental influences.
Author ORCIDs
Yusuke Takahashi, 0000-0003-3108-1109.
Acknowledgements
We are extremely grateful to all the twin families who took part in this study.
Financial support
This work was supported in part by the Japan Society for the Promotion of Science KAKENHI Grant-in-Aid for Scientific Research on Innovative Areas (grant no 26118709 and 17H05924) to Y.T.
Conflict of interest
None.
Ethical standards
The authors assert that all procedures contributing to this work comply with the ethical standards of the relevant institutional committees on human experimentation and with the Helsinki Declaration of 1975, as revised in 2008.


