


Introduction
Attention-deficit/hyperactivity disorder (ADHD) is characterized by inattention, hyperactivity, and/or impulsivity (American Psychiatric Association, 2013). The prevalence of ADHD in older adults is most frequently studied at the age of 50 years and over (Dobrosavljevic, Solares, Cortese, Andershed, & Larsson, Reference Dobrosavljevic, Solares, Cortese, Andershed and Larsson2020). The prevalence of persistent ADHD in older adults is estimated at 2.58% and of symptomatic adult ADHD at 6.76% (Song et al., Reference Song, Zha, Yang, Zhang, Li and Rudan2021). Controversially, ADHD may or may not persist from childhood (Moffitt et al., Reference Moffitt, Houts, Asherson, Belsky, Corcoran, Hammerle and Caspi2015; Sibley, Mitchell, & Becker, Reference Sibley, Mitchell and Becker2016). Nonetheless, ADHD is increasingly recognized as a condition that persists from childhood into later adulthood, with symptoms impacting functioning well beyond childhood and early adult life (Kooij et al., Reference Kooij, Bejerot, Blackwell, Caci, Casas-Brugue, Carpentier and Asherson2010). ADHD in adulthood is associated with functional impairment, a substantial economic burden (Faraone et al., Reference Faraone, Banaschewski, Coghill, Zheng, Biederman, Bellgrove and Wang2021), excess psychiatric comorbidities (Choi, Woo, Wang, Lim, & Bahk, Reference Choi, Woo, Wang, Lim and Bahk2022), and dementia risk (Levine et al., Reference Levine, Rotstein, Kodesh, Sandin, Lee, Weinstein and Reichenberg2023). ADHD in older adults represents a particular treatment challenge because cardiovascular conditions are prevalent, and some ADHD psychostimulant medications pose risks to cardiovascular health (Goodman, Mitchell, Rhodewalt, & Surman, Reference Goodman, Mitchell, Rhodewalt and Surman2016). Nonetheless, the phenotypic expression of ADHD in adults remains unclear and is rarely examined in representative samples.
The optimal number of factors or symptom clusters comprising the ADHD in older-adults phenotype remains unclear. The DSM-5-TR posits two core dimensions, inattention and hyperactivity/impulsivity, alongside a general factor encompassing both (American Psychiatric Association, 2022). Empirical evidence in adults without dementia supports a two-factor model (Das, Cherbuin, Easteal, & Anstey, Reference Das, Cherbuin, Easteal and Anstey2014). However, research within community settings (Gibbins, Toplak, Flora, Weiss, & Tannock, Reference Gibbins, Toplak, Flora, Weiss and Tannock2012), including the Rockland County study (Callahan & Plamondon, Reference Callahan and Plamondon2019), often identifies three distinct symptom clusters: inattention, hyperactivity, and impulsivity. Frequently, a general ADHD factor is observed (Park, Silveira, Elliott, Savalei, & Johnston, Reference Park, Silveira, Elliott, Savalei and Johnston2018), forming a bifactor model. In the bifactor model, the general factor is not associated with the symptom clusters and so may lack clinical utility (Arias, Ponce, & Nunez, Reference Arias, Ponce and Nunez2018; Bonifay, Lane, & Reise, Reference Bonifay, Lane and Reise2016). An alternative hierarchical model posits a direct association between the general factor and its constituent symptom clusters. Even the empirical translation of ADHD symptomatology to the adult domain often proves elusive (e.g. the seemingly straightforward symptom of ‘often talk excessively’ is empirically more accurately classified as an expression of impulsivity rather than hyperactivity in adults (Alarachi, Merrifield, Rowa, & McCabe, Reference Alarachi, Merrifield, Rowa and McCabe2024). Collectively, past research underscores the ambiguity surrounding the precise phenotypic expression of ADHD in adults.
Potentially, several clinical factors contribute to the ambiguity surrounding the phenotypic expression of ADHD in older adults. The DSM-5-TR posits a link between ADHD and neurocognitive impairments in attention, executive function, and memory (American Psychiatric Association, 2022), yet robust empirical evidence supporting this assertion in the adult population remains elusive (Moffitt et al., Reference Moffitt, Houts, Asherson, Belsky, Corcoran, Hammerle and Caspi2015; Schoechlin & Engel, Reference Schoechlin and Engel2005). Indeed, ADHD in older adults is diagnostically challenging due to its potential symptomatic overlap (e.g. inattention) with cognitive impairment (Das et al., Reference Das, Cherbuin, Easteal and Anstey2014) and dementia. Similarly, depression is more prevalent among older adults with ADHD, possibly due to shared symptoms and executive function deficits, or because depression emerges as a response to the burden of ADHD symptoms (Choi et al., Reference Choi, Woo, Wang, Lim and Bahk2022; Marks, Newcorn, & Halperin, Reference Marks, Newcorn and Halperin2001).
Furthermore, research on the association between ADHD polygenic scores (PGS) and self-reported ADHD symptoms in adulthood shows age-related inconsistency. For example, a PGS derived from genome-wide association studies (GWAS) of childhood ADHD was significantly elevated among individuals diagnosed with ADHD in childhood, but not in adulthood (Moffitt et al., Reference Moffitt, Houts, Asherson, Belsky, Corcoran, Hammerle and Caspi2015). Similarly, in a recent review, the polygenic scores used in studies of adult and older adult cohorts were also derived from childhood ADHD GWAS, rather than from adult-onset or age-specific ADHD samples (Ronald, de Bode, & Polderman, Reference Ronald, de Bode and Polderman2021). This mismatched developmental context may contribute to the inconsistent associations observed across age groups and raises important questions about the generalizability of childhood-derived ADHD PGS to later-life phenotypes. Collectively, these clinical and research factors may be integral to the ADHD phenotype in middle- and older- aged adults, a possibility as yet untested.
This study aims to identify the optimal model of ADHD symptom expression in middle- and older-aged adults by applying competing confirmatory factor analytic models to as yet unpublished data from the US Health and Retirement Study (Sonnega et al., Reference Sonnega, Faul, Ofstedal, Langa, Phillips and Weir2014). This study is a nationally representative cohort of adults aged 50 and older. Following identification of the best-fitting model of ADHD symptoms, complementary analyses were undertaken to: examine ADHD symptom expression in individuals without cognitive impairment; incorporate cognitive function tests, depressive symptoms, and ADHD PGS into the adult ADHD phenotype; evaluate ADHD symptoms separately in middle-(50–64 years) and older- (≥65 years) aged adults; and methodologically to assess ADHD symptom expression across administration modes (face-to-face versus telephone) and with population-weighted adjustments to represent the national US population. By clarifying the degree to which ADHD symptoms in middle- and late- life reflect underlying genetic liability and cognitive functioning, this study seeks to advance understanding of ADHD across the adult lifespan and to inform research and clinical practice regarding its recognition and interpretation in older populations, where diagnosis and differentiation from cognitive decline may be particularly challenging.
Methods
Population
The current study source population consisted of a random sample of participants in the 2016 wave of the Health and Retirement Study (HRS), a nationally representative, longitudinal survey of individuals aged 50 years and older in the United States (Sonnega et al., Reference Sonnega, Faul, Ofstedal, Langa, Phillips and Weir2014). The data collection period for the 2016 HRS interview was from April 2016 to April 2018. Within the 2016 wave, the HRS approached and interviewed a random sample of individuals aged 50 years or older in an experimental module examining the prevalence of ADHD symptoms in middle- and older-aged adults (N = 2,091; Supplementary eText 1 and eFigure 1). The protocol and content of the interview administration format did not differ between the face-to-face and telephone groups. These HRS study participants provided written informed consent using procedures approved by the University of Michigan Institutional Review Board in accordance with the Declaration of Helsinki.
Measures
ADHD symptoms in middle- and older-aged adults
This ADHD symptom measure is based on the Adult ADHD Self-Report Scale (Kessler et al., Reference Kessler, Adler, Gruber, Sarawate, Spencer and Van Brunt2007). It comprises 18 symptoms (items), classified in four ways in the HRS data as: Yes; No; DK (Do not Know); NA (Not Ascertained); or Refused. The measure was administered by interview and was the primary measure of the expression of the symptoms of ADHD. Empirical research has identified six items within the 18-question Adult ADHD Self-Report Scale (ASRS) as the most predictive indicators of adult ADHD (Kessler et al., Reference Kessler, Adler, Ames, Demler, Faraone, Hiripi and Walters2005). These items are often favored in epidemiological studies of older populations. However, the Adult ADHD Self-Report Scale, like most ADHD diagnostic tools, was validated originally for individuals aged 18–44 years (Kessler et al., Reference Kessler, Adler, Ames, Demler, Faraone, Hiripi and Walters2005). In older age groups, its psychometric properties remain uncertain, leading to the potential of misclassification (Ustun et al., Reference Ustun, Adler, Rudin, Faraone, Spencer, Berglund and Kessler2017).
Secondary measures
Cognitive classification and measurement.
Cognitive status was determined using the validated Langa-Weir Classification algorithm, which utilizes cognitive test performance or proxy reports to categorize participants as Normal, Cognitively Impaired but Not Demented (CIND), or Dementia (Langa, Weir, Kabeto, & Sonnega, Reference Langa, Weir, Kabeto and Sonnega2023). Cognitive function was measured with the 20-item Telephone Interview for Cognitive Status (TICS-20) (Crimmins, Kim, Langa, & Weir, Reference Crimmins, Kim, Langa and Weir2011) (Detailed in Supplementary eText 2).
Depressive symptoms.
Depressive symptoms in the past week were assessed using the 8-item Center for Epidemiologic Studies Depression Scale (CES-D), with total scores ranging from 0 to 8, where higher scores indicate greater symptom severity (Mojtabai & Olfson, Reference Mojtabai and Olfson2004) (Detailed in Supplementary eText 3).
ADHD polygenic score (PGS)
PGS in the HRS were constructed using DNA samples collected from HRS participants between 2006 and 2012 for individuals of African Ancestry (AA) and European Ancestry (EA). The current study used the ADHD PGS based on the 2019 Psychiatric Genomics Consortium and the Foundation Initiative for Integrative Psychiatric Research, which included both child and adult cases, with a predominance of childhood ADHD. The consortium corroborated the polygenicity of ADHD by observing that a higher ADHD risk is significantly associated with a higher PGS. Significant overlap was found between the genetic variations associated with ADHD between the HRS genetic sample and GWAS. Hence, the PGS was created within the HRS.
Analytic approach
Missing information was examined to test if the data significantly diverged from the assumption of missing completely at random. Item frequencies were computed to examine their distributions, and bivariate item tetrachoric correlations were calculated with false-positive discovery-adjusted p-values. The rate of probable ADHD based on the 6-item ASRS Screener scoring method was calculated. Exact 95% confidence intervals for the screen-positive rate were calculated using the Clopper-Pearson method, which is based on the binomial distribution.
In the primary analysis, 10 a priori competing confirmatory factor analysis (CFA) models of ADHD were fitted and examined for construct validity. We fitted (1) a single-factor model with a general propensity to ADHD; Two-factor models of inattention and hyperactivity/impulsivity were fitted configured as: (2) two uncorrelated factors (3) two correlated factors, and (4) two factors and a general ADHD factor at the apex; Three-factor models comprised of inattention, hyperactivity and impulsivity (5) as uncorrelated factors; (6) correlated factors; and (7) with a hierarchical general ADHD factor at the apex, following the symptom configuration of Park (Park et al., Reference Park, Silveira, Elliott, Savalei and Johnston2018). Models 5–7 were repeated for models 8–10, except following the symptom configuration of Alarachi (Alarachi et al., Reference Alarachi, Merrifield, Rowa and McCabe2024). The Alarachi (Alarachi et al., Reference Alarachi, Merrifield, Rowa and McCabe2024) model sets ‘often talk excessively’ as an expression of impulsivity, whereas the Park model (Park et al., Reference Park, Silveira, Elliott, Savalei and Johnston2018) sets it as an expression of hyperactivity. These 10 models were estimated and visualized.
No model modifications were made to these 10 a priori-specified models. All the models were fitted with the weighted least squares means and variance adjusted (WLSMV) estimator. The WLSMV estimator is appropriate for categorical data. Because symptom-level data are ordinal and have highly skewed distributions, we used polychoric correlations with robust standard errors to fit the models. To assess how well each a priori model fitted the data, we examined the following scaled fit indices: the chi-square value, the comparative fit index (CFI), the Tucker-Lewis index (TLI), and the root-mean-square error of approximation (RMSEA). Nonsignificant chi-square tests indicate a good model fit; nonetheless, this test is generally overpowered in large sample sizes. A good model fit to the data is indicated by CFI and TLI values greater than .95 and RMSEA scores less than .05 (Bollen & Curran, Reference Bollen and Curran2006). Once the best-fitting model was identified, it was plotted to examine the loadings.
Complementary analysis
First, we challenged the reliability and statistical power of the best-fitting model. For the best-fitting model, internal consistency (reliability) was assessed using the Kuder–Richardson Coefficient (KR-20). Although reliability exceeding 0.7 is widely considered acceptable, very high reliability means a test taps a narrow bandwidth (i.e. symptoms superfluously overlap), contrary to high validity (Kline, Reference Kline1999). A post-hoc power analysis based on RMSEA-derived non-central chi-square theory was conducted to evaluate the best-fitting model (MacCallum, Browne, & Sugawara, Reference MacCallum, Browne and Sugawara1996).
Next, using CFA, four complementary analyses were undertaken to identify clinical factors integral to ADHD symptoms of the best-fitting model. First, potentially, individuals with dementia or cognitive impairment may report symptoms of ADHD (e.g., inattention). Hence, based on the established Langa-Weir Classification Algorithm (Langa et al., Reference Langa, Weir, Kabeto and Sonnega2023), in subgroup analysis, we refitted the best-fitting CFA restricted to individuals without a history from 1995 to 2016 of CIND or dementia. Second, in sensitivity analysis, we tested if cognitive function based on the TICS-20 (Crimmins et al., Reference Crimmins, Kim, Langa and Weir2011) was integral to the best-fitting model of ADHD symptoms. Third, in sensitivity analysis, we tested if depressive symptoms based on the CES-D were integral to ADHD symptoms in the best-fitting model. Fourth, prior studies of the association between ADHD PGS and the risk of ADHD based on reported information not in older adults are unclear (Moffitt et al., Reference Moffitt, Houts, Asherson, Belsky, Corcoran, Hammerle and Caspi2015; Ronald et al., Reference Ronald, de Bode and Polderman2021). An untested possibility is that the ADHD PGS may load onto the general propensity to ADHD as ascertained by the interviews. Hence, we tested the possibility that ADHD PGS may be integral to the self-reported expression of ADHD.
Aging and ADHD symptoms were examined in three ways. Few studies examine the structure of ADHD symptoms in groups of middle-aged (50–64 years) and older-age adults (65 years and over), despite differences in ADHD symptomatology with aging. Furthermore, originally, the ASRS was validated up to age 44 years (Kessler et al., Reference Kessler, Adler, Ames, Demler, Faraone, Hiripi and Walters2005). Hence, we refitted the best-fitting model restricted to middle-aged (50–64 years) and older-age adults (65 years and over). The structures were then compared with measurement invariance testing that involves fitting a series of increasingly constrained CFA models: configural, metric (weak), and scalar (strong) invariance. Generalized estimating equation (GEE) models were fit to examine the association between age, sex, and their interaction on ADHD symptom counts.
Methodological factors were considered in two ways. First, we conducted measurement invariance tests (configural, weak, and strong) to compare the administration mode groups (face-to-face vs telephone). Second, using complex weights to represent the national population is uncommon in CFA since it may or may not alter the accepted fit index cutoff values. Hence, in sensitivity analysis, we weighted the analysis to represent the national US population.
All software used in the current analysis are listed in Supplement eText 4.
Results
The HRS approached 2,091 individuals for consent to be interviewed in the ADHD module. Among individuals aged 50 years and over at the 2016 HRS interview, after removing missing data (Supplementary eText 1), the analytic cohort consisted of 1,562 (74.7%) individuals with ADHD item responses without missing information (Supplementary eFigure 1: Study flow chart).
Sample characteristics of the analytic sample
Table 1 shows the analytic sample characteristics (N = 1,562). The analytic sample had a median age of 64 years at the 2016 interview (IQR = 57–74; range = 50–96), with 814 (52.1%) participants aged 50–64 years and 748 (47.9%) aged ≥65 years. This sample was mainly interviewed face-to-face (971, 62.16%), female (female: N = 922, 59.03%), married (N = 845, 54.10%), and living in the community (N = 1,555, 99.55%).
Table 1. Sample characteristics
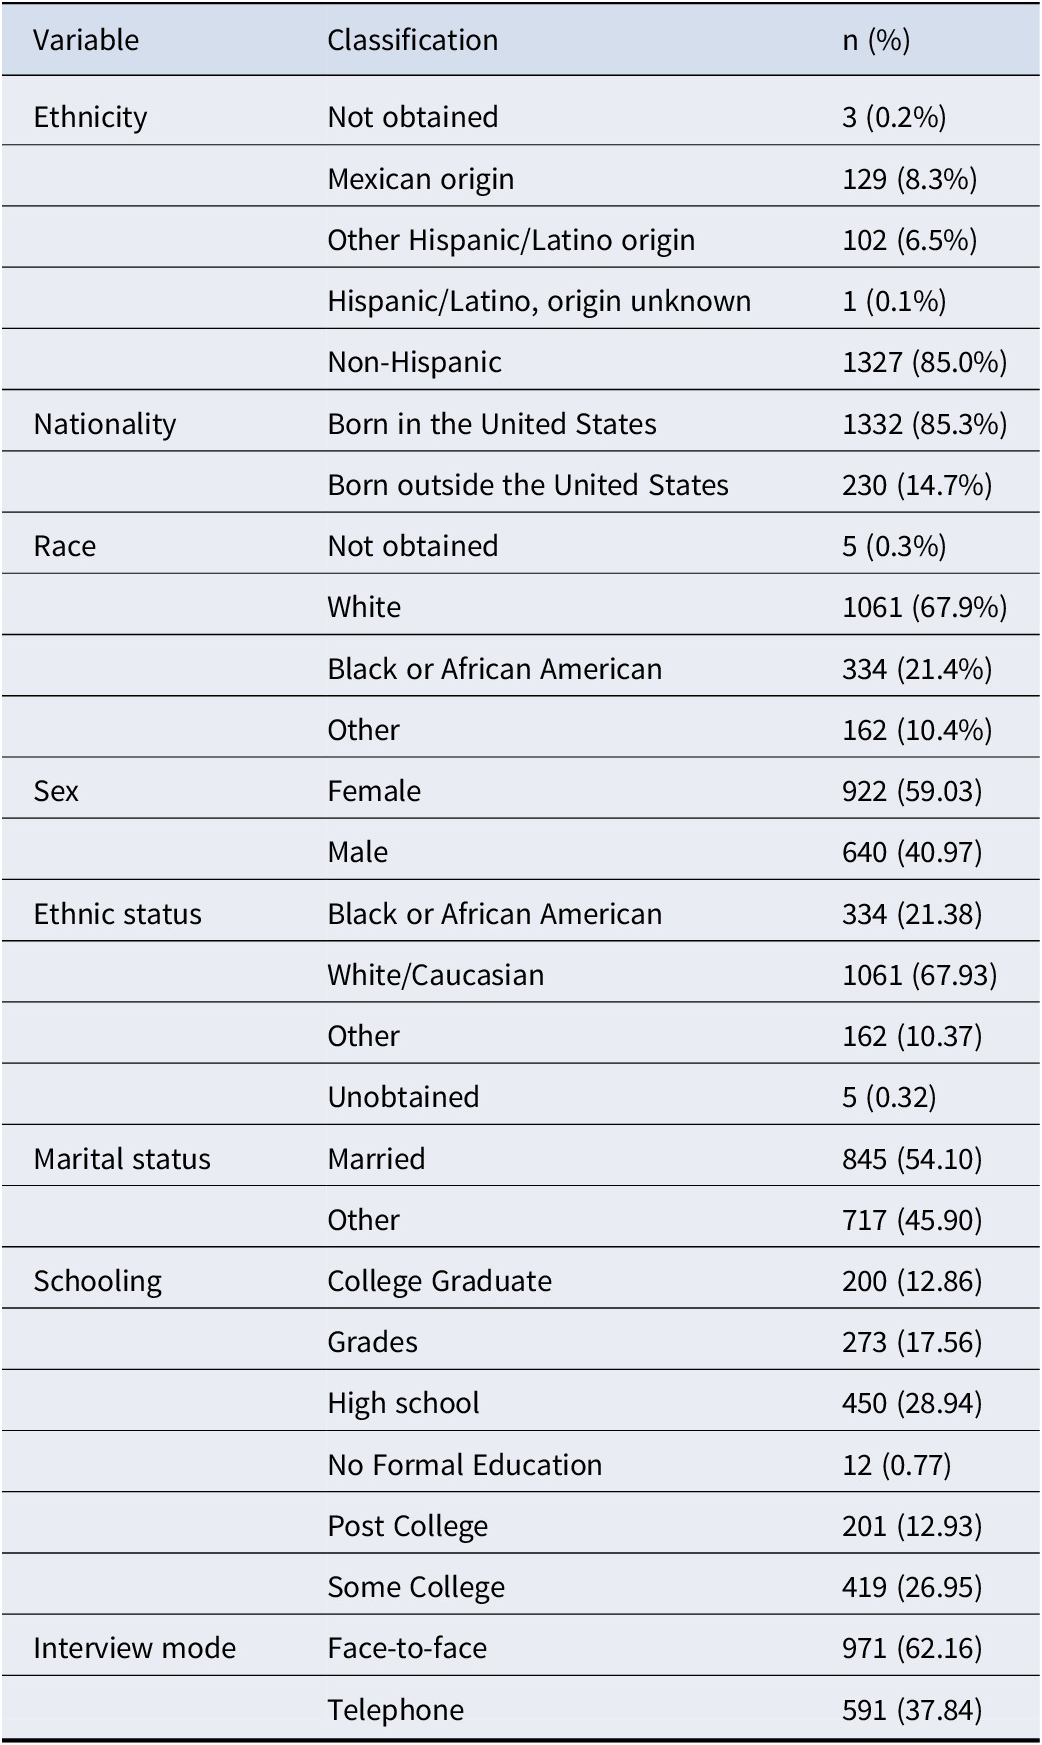
Note: All values are based on 2016 interview year information. Ethnicity was based on participant self-identification and categorized according to U.S. Census standards. ‘Hispanic/Latino, origin unknown’ includes individuals who identified as Hispanic/Latino but did not specify a subgroup. Nativity was classified as either born in the United States or born outside the United States. Race was reported independently of ethnicity. ‘Other’ includes all racial identities not classified as White or Black/African American. ‘Not obtained’ indicates missing or undisclosed responses.
ADHD item responses and correlations
The ADHD symptom distributions were computed (Supplementary eTable 1), showing that ADHD symptom responses were negatively skewed. Bivariate tetrachoric correlations were calculated and adjusted for FDR (Benjamini & Hochberg, Reference Benjamini and Hochberg2018). Four bivariate tetrachoric correlations were not statistically significant (>.05): between the ADHD symptom ‘Often on the go or act driven’ and the symptoms ‘Difficult to sustain attention’, ‘Fail to give attention or make careless mistakes’, ‘Not listening when spoken to directly’, and ‘Difficult to organize tasks or activities’ (Supplementary eFigure 2). In the total sample, 9.6% (95% CI: 8.2%–11.2%) of participants screened positive for probable ADHD based on the 6-item ASRS Screener scoring method.
ADHD confirmatory factor analysis
Examination of the CFA models showed that the single and two-factor models were not a satisfactory fit to the data (Models 1–4; Table 2). The three uncorrelated factor models tested were not a good fit to the data (models 5 and 8; Table 2). The three-factor models of Park were not a good model fit to this data (models 6 and 7; Table 2) (Park et al., Reference Park, Silveira, Elliott, Savalei and Johnston2018). The remaining 3-factor correlated factors and hierarchical models (models 9 and 10) of Alarachi were a good fit to the data based on the CFI, TLI, and RMSEA, with slightly lower RMSEA values for the hierarchical 3-factor model of Alarachi (Alarachi et al., Reference Alarachi, Merrifield, Rowa and McCabe2024) (model 10; Table 2). This model was plotted (Figure 1), and all the ADHD symptom loadings on the factors were statistically significant (Supplementary eTable 2). Hence, model 10 was considered the best-fitting model to the data and was submitted for further testing in complementary analysis.
Table 2. Model fit indices of competing models

Note: The comparative fit index (CFI), the Tucker-Lewis index (TLI), and the Root-Mean-Square Error of approximation (RMSEA). Nonsignificant chi-square tests indicate a good model fit, although its asymptotic distribution would be significant due to sample size; CFI and TLI values greater than 0.95 indicate good fit denoted; RMSEA scores less than .05 are considered good. Fit index values corresponding to a good model fit are highlighted by a * symbol.
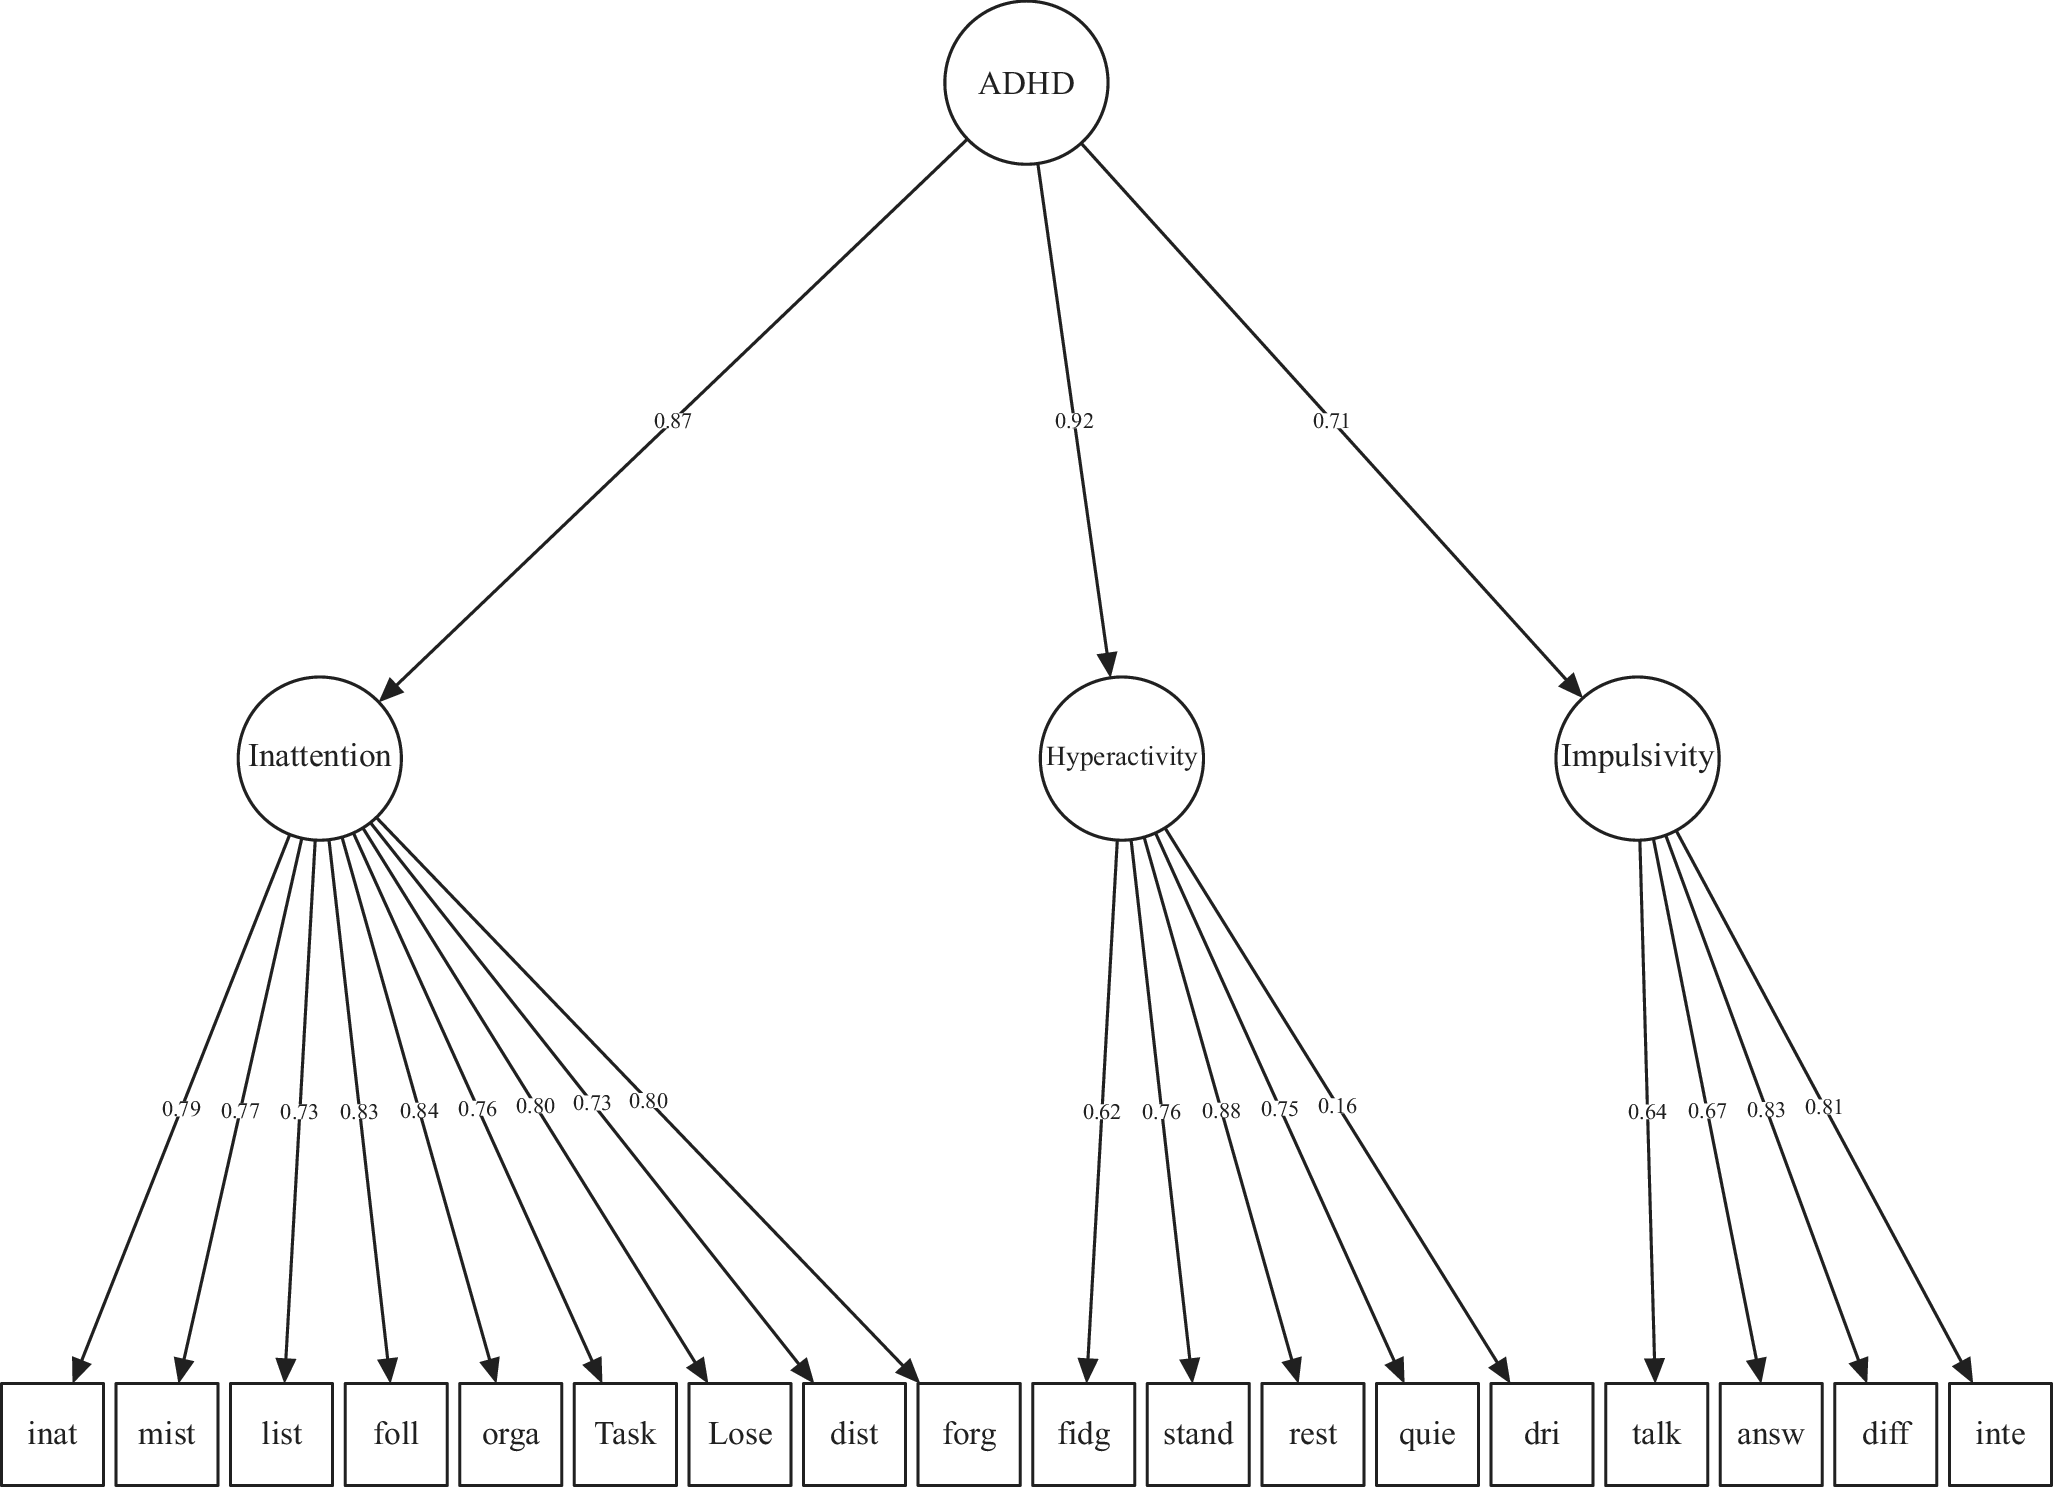
Figure 1. Hierarchical factor and 3 second-order factors.
Item loadings of the best-fitting model based on Alarachi et al. (Reference Alarachi, Merrifield, Rowa and McCabe2024). Items left-to-right abbreviated from: Difficult to sustain attention; Fail to give attention or make careless mistakes; Not listening when spoken to directly; Fail to follow thru on instructions and finish jobs; Difficult to organize tasks or activities; Avoid tasks requiring sustained attention; Lose things needed for tasks; Distracted by external stimuli; Forgetful during daily activities; Move hands or feet or fidget in chair; Stand up when you should remain seated; Often feel restless; Difficulty engaging in leisure activities quietly; Often on the go or act driven; Often talk excessively; Give answers before questions completed; Difficult to await your turn; Interrupt activities of others or intrude.
Complementary analysis
Internal consistency was satisfactory for the general ADHD factor (KR-20 = 0.84) and Inattention (KR-20 = 0.83) but was low for hyperactivity (KR-20 = 0.56) and impulsivity (KR-20 = 0.58). Statistical power to detect a misfit corresponding to RMSEA = 0.040 was >.999, with an estimated Type II error (β) of approximately 8.87 × 10⁻¹⁶ (Supplementary eFigure 3).
The best-fitting model (model 10) showed a satisfactory fit to the data when restricted to individuals without a history of CIND or dementia (fit indices: Table 3; loadings: Supplementary eFigure 4). Model 10 also demonstrated a satisfactory fit with the addition of a cognitive factor (TICS-20) and then PGS, and an adequate fit adding depressive symptoms (CES-D) (Table 3, Supplementary eFigures 5–7).
Table 3. Complementary analysis: refitting the best-fitting model
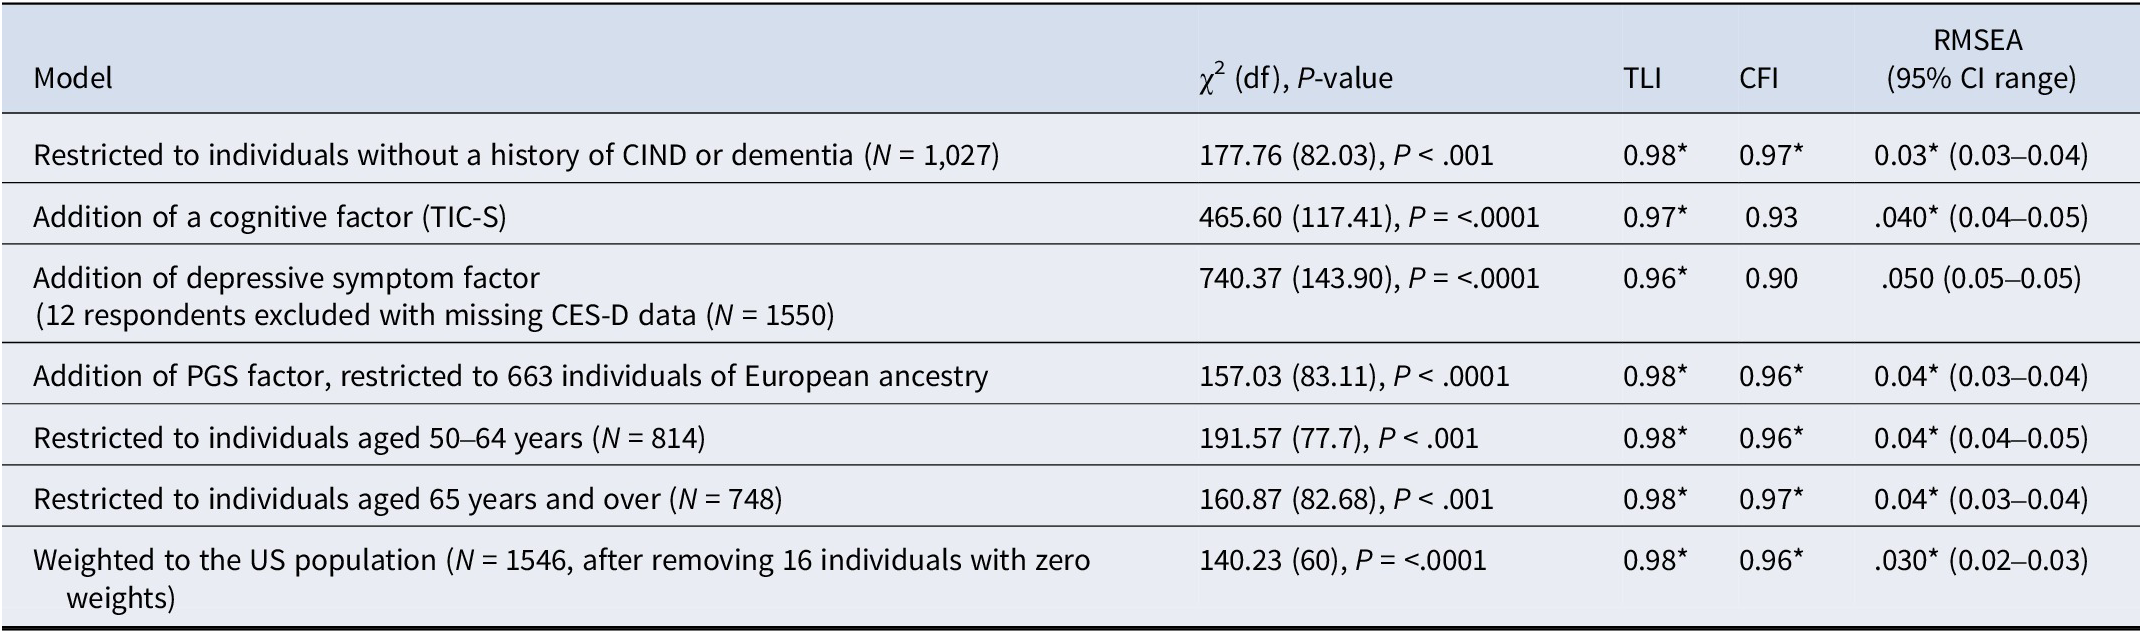
Note: The comparative fit index (CFI), the Tucker-Lewis index (TLI), the Root-Mean-Square Error of approximation (RMSEA), Cognitively Impaired but Not Demented (CIND), Telephone Interview for Cognitive Status (TICS-20), 8-item Center for Epidemiologic Studies Depression Scale (CES-D), and polygenic score for ADHD (PGS). Nonsignificant chi-square tests indicate a good model fit, although its asymptotic distribution would be significant due to sample size; CFI and TLI values greater than 0.95 indicate good fit denoted; RMSEA scores less than .05 are considered good. Fit index values corresponding to a good model fit are highlighted by a * symbol.
Model 10 demonstrated a satisfactory fit to the data in both the 50–64 and ≥ 65 age groups (Table 3; Supplementary eFigures 8–9). Additionally, model 10 demonstrated a good fit in support of configural and weak invariance across age groups (Supplementary eTable 3). However, the slight decrease in fit for the strong invariance model suggested that some item intercepts may differ by age group, indicating partial non-invariance (Supplementary eTable 3). GEE models of symptom trajectories indicated that, with aging, hyperactivity and impulsivity symptoms progressively declined, whereas inattention symptoms gradually increased (Supplementary eFigure 10). No significant age-by-sex interaction was observed. Overall, symptoms of ADHD across older adulthood showed a modest decline.
Comparisons of model 10 between the face-to-face and telephone administration groups supported configural, metric, and scalar invariance, indicating equivalent ADHD symptom structure, loadings, and intercepts (Supplementary eTable 3). Model 10 showed a satisfactory fit to the data when weighted to represent the national US population (Table 3, Supplementary eFigure 11).
Discussion
This study examined the phenotypic expression of ADHD symptoms in middle- and older-aged adults using competing confirmatory factor analytic models based on interviews in the HRS (Sonnega et al., Reference Sonnega, Faul, Ofstedal, Langa, Phillips and Weir2014). The best-fitting model had a hierarchical structure, with a general factor of ADHD at the apex and three symptomatic expressions of ADHD (i.e. inattention, hyperactivity, and impulsivity) arranged underneath. This structure remained a good fit to the data in complementary analyses: in individuals without cognitive impairment; when including cognitive function tests, depressive symptoms, and ADHD polygenic scores; in middle-(50–64 years) and older-aged adults (≥65 years); and methodologically, across administration modes (face to face versus telephone) and weighted to represent the national US population. To the best of our knowledge, this is the first representative study to explore the phenotypic expression of ADHD symptoms in middle- and older-aged adults, and evaluate the integral role of ADHD polygenic scores, cognitive factors, and depressive symptoms.
This hierarchical model is partly consistent with the current research regarding ADHD symptoms in middle- and older-aged adults. Consistent with some prior evidence is that the ADHD symptom ‘often talk excessively’ was empirically an expression of impulsivity rather than hyperactivity (Alarachi et al., Reference Alarachi, Merrifield, Rowa and McCabe2024), suggesting this is a symptomatic nuance of adult, not childhood ADHD. Like past research, three distinct factors of ADHD symptoms in middle- and older-aged adults were observed (Callahan & Plamondon, Reference Callahan and Plamondon2019; Gibbins et al., Reference Gibbins, Toplak, Flora, Weiss and Tannock2012). Unlike past studies, these three factors were directly associated with the general ADHD factor. This model implies that while these symptoms can vary in severity and presentation, they are all part of the same disorder.
The results suggest that while the overall structure of ADHD symptoms is consistent across middle- and older-adult age groups. However, some ADHD symptom questions may be interpreted differently by individuals of different ages. The screen-positive prevalence observed in the current sample (9.6%) was somewhat higher than that reported by Kessler et al. (Reference Kessler, Adler, Ames, Demler, Faraone, Hiripi and Walters2005). This difference potentially reflects differences in age, sample characteristics, or retrospective reporting patterns (prefixed by ‘do you often’ in the current study to capture symptom frequency compared to usually a past 4-week time frame in the ASRS). This potential for age-related differences in response highlights the need for caution when comparing raw ADHD symptom scores between age groups. The present findings indicate that, regardless of sex, symptoms of hyperactivity and impulsivity decline progressively with aging, while inattention symptoms gradually increase from middle to old age. This is consistent with prior developmental research showing that hyperactivity and impulsivity decline from childhood through adolescence into early adulthood (Dopfner et al., Reference Dopfner, Hautmann, Gortz-Dorten, Klasen and Ravens-Sieberer2015). Our findings extend prior clinical observations in younger populations. Specifically, longitudinal follow-up of boys with ADHD showed that inattention symptoms were less likely to remit than hyperactivity or impulsivity (Biederman, Mick, & Faraone, Reference Biederman, Mick and Faraone2000). Nonetheless, in the absence of diagnostic data in our sample, we cannot disregard the possibility that some individuals represent cases of childhood-onset ADHD with delayed recognition in adulthood.
Complementary analysis aimed to examine plausible clinical features linked to the phenotypic expression of ADHD symptoms in middle- and older-aged adults. The inclusion of cognitive function within the ADHD symptom model demonstrated a satisfactory fit, suggesting that neurocognition constitutes an integral component of the ADHD phenotype, consistent with DSM-V criteria (12), particularly within the context of adult ADHD. The inclusion of depressive symptoms within the ADHD symptom model was indicative of an adequate fit, suggesting that depressive symptoms may represent an integral component of the ADHD phenotype. This interpretation aligns with prior research documenting the frequent co-occurrence of depression and ADHD, particularly in adults through middle age (Choi et al., Reference Choi, Woo, Wang, Lim and Bahk2022). Furthermore, the incorporation of an ADHD polygenic score significantly enhanced model fit, providing preliminary evidence for a genetic contribution to adult ADHD. Collectively, these findings suggest that the general ADHD symptom factor may be influenced by genetic factors and exhibits an association with neurocognitive deficits.
Strengths and limitations
Our study has multiple strengths. The current source population was based on an established and large representative US sample (Sonnega et al., Reference Sonnega, Faul, Ofstedal, Langa, Phillips and Weir2014). Statistically, we compared 10 competing models of the phenotypic expression of ADHD symptoms in middle- and older-aged adults. In complementary analyses, we addressed clinical features of ADHD symptoms, the phenotype of middle- and older adults and methodologically did not rely solely on subjective self-reports during the interviews.
The current study is not without limitations. ADHD symptoms in middle- and older-aged adults were based on self-reports in interviews rather than clinical reports with a comprehensive assessment process, including interviews, rating scales, observation, and collateral information (e.g. from family). Such clinical reports reduce bias and enhance objectivity in the ascertainment process. Another limitation of our measure is the absence of embedded validity indices (e.g. inconsistency or infrequency scales), which are included in clinical tools, such as the Conners’ Adult ADHD Rating Scales (Conners, Erhardt, & Sparrow, Reference Conners, Erhardt and Sparrow2002). We may have partially mitigated this limitation by excluding individuals with cognitive impairment, systematically addressing missingness, and checking administration mode (see Supplementary eText 1 and Supplementary eTable 4). Nonetheless, including validity indices would have reduced the risk of misclassification due to inattentive or non-credible responses. Moreover, given the reliance on capturing frequent symptoms and the possibility of symptom fluctuation with aging, the prevalence estimates reported herein should be interpreted with caution when extrapolated to older adult populations.
The use of the TICS-20 as a measure of cognitive function is a study limitation. While the TICS-20 is validated for older populations and enables large-scale cognitive assessments, it primarily evaluates memory and basic attentional processes. The absence of dedicated executive function tasks limits the specificity of the TICS-20, with which ADHD-relevant cognitive domains could be examined. Also, there is currently an inadequate sample size overlap between the harmonized cognitive assessment protocol (HCAP; Langa et al., Reference Langa, Ryan, McCammon, Jones, Manly, Levine and Weir2020) and the ADHD module to examine more cognitive domains.
In complementary analyses, the present study examined: (1) whether cognitive performance, (2) depressive symptoms, and (3) ADHD PGS are associated with the latent phenotype of ADHD symptoms in adults. While regression and other analytic approaches could have been applied, CFA was selected to model ADHD as a latent construct, enabling the reduction of measurement error and the capture of shared variance among observed symptoms. This approach is particularly suited to older adults, where symptom expression may be more heterogeneous or attenuated by age-related processes. CFA also permits cognitive performance to be examined as an indicator of the ADHD factor, rather than as an external correlate, allowing for the possibility that cognitive deficits are psychometrically embedded within the ADHD phenotype. Likewise, ADHD PGS were evaluated as integral to the latent ADHD factor to assess alignment with the underlying symptom structure rather than with isolated symptom reports. This modeling strategy thus enables an evaluation of whether cognition and genetic liability to ADHD are structurally linked to the ADHD phenotype. Analyses were restricted to individuals without cognitive impairment or dementia to mitigate potential confounding with neurodegenerative processes and to better isolate neurocognitive variation in symptom expression.
Our ADHD PGS analysis was restricted to individuals of European descent for two reasons. There was a lack of overlap between the ADHD PGS and interview data in those of African ancestry. Furthermore, most GWAS analyses that form the foundation for the validity of PGS are based on individuals of European descent; hence, PGS may lack the same validity for other ancestral groups. A further limitation is that the ADHD PGS used in this study were derived from a discovery sample predominantly composed of childhood ADHD cases (Demontis et al., Reference Demontis, Walters, Martin, Mattheisen, Als, Agerbo and Neale2019). This may limit the extent to which the genetic liability captured reflects ADHD persistence or expression specifically in older adults.
We could not differentiate continuity from childhood and adult-onset ADHD. Hence, the results are relevant to individuals with ADHD symptoms aged 50 or older, and implications regarding onset and incidence are inappropriate. It remains essential to differentiate between persistent ADHD, where childhood-onset symptoms continue into adulthood, and symptomatic ADHD, in which current symptoms are reported without necessarily meeting retrospective childhood diagnostic criteria (Barkley et al., Reference Barkley, Murphy and Fischer2008). Unfortunately, we could not examine aspects of the lifespan longitudinally owing to a lack of ADHD assessments in our cross-sectional data.
ADHD is a complex condition that involves cognitive, emotional, and behavioral aspects. An 18-item symptom-based survey like ours may oversimplify the diagnostic criteria, leaving out essential nuances of how ADHD is manifest in different contexts. Similarly, affect and other comorbidities may play a more nuanced role in ADHD in older adults than we ascertained with the CES-D. Particularly, the roles of anxiety and depressive disorder warrant further research.
Finally, the subscales demonstrated modest internal reliability. Although coefficients exceeding 0.70 are generally considered acceptable, it is recognized that very high reliability may reflect item redundancy and a narrow construct range, potentially compromising validity (Kline, Reference Kline1999). Also, measurement uncertainty exists, despite our complementary analysis comparing middle-aged and older adults, when applying these ASRS to individuals aged 50 years and older (Kessler et al., Reference Kessler, Adler, Ames, Demler, Faraone, Hiripi and Walters2005). Consequently, scale development is warranted for observational research into ADHD symptoms and diagnoses in older adults.
Conclusions
The current study results showed that, in this representative US sample of middle- and older-aged adults, the best-fitting model had a hierarchical structure comprised of a general factor of ADHD symptoms at the apex and arranged underneath three symptomatic expressions of ADHD (i.e. inattention, hyperactivity, and impulsivity). These findings, reported here for the first time, reveal novel insights into the structure and expression of phenotypic expression of ADHD symptoms in middle- and older-aged adults. Tentatively, the model suggests that treatments should target the general factor of ADHD rather than focusing solely on specific symptoms. This hierarchical model implies that the general phenotypic expression of adult ADHD has affective, cognitive and genetic expressions, may be a direction toward developing treatment targets, and offers a framework for studying its mechanisms.
Supplementary material
The supplementary material for this article can be found at http://doi.org/10.1017/S0033291725101347.
Acknowledgments
Health and Retirement Study (HRS 2016 Core Final Release (Version 2.0), Module 1, Symptom Prevalence of Adult Attention Deficit Hyperactivity Disorder) public use dataset. Produced and distributed by the University of Michigan with funding from the National Institute on Aging (grant number NIA U01AG009740). Ann Arbor, MI (2016).
Funding statement
This research received no specific grant from any funding agency, commercial or not-for-profit sectors.
Competing interests
The author(s) declare none.
Ethical standard
The authors assert that all procedures contributing to this work comply with the ethical standards of the relevant national and institutional committees on human experimentation and with the Helsinki Declaration of 1975, as revised in 2008 and the authors assert that all procedures contributing to this work comply with the ethical standards of the relevant national and institutional guides on the care and use of laboratory animals.


 Open access