


Introduction
All herbicides used in the United States are required to follow an extensive registration process with the U.S. Environmental Protection Agency (US EPA 1998). Supporting data for herbicide registrations include terrestrial field dissipation (TFD) studies that provide insight into herbicide fate once it is applied to the targeted area. Data generated from TFDs can vary widely depending on local environmental conditions and crop production systems. These data are often used to simulate herbicide movement in surface and ground water using computer programs. Traditionally, a Pesticide Root Zone Model (PRZM) and an Exposure Analysis Modeling System (EXAMS) were used to explore ecological risk from runoff and erosion, and surface water movement, respectively (US EPA 2008). Now, more hybrid models that include PRZM and EXAMS, PRZM5, and the Pesticide in Water Calculator are being used to assess ecological risk from herbicide movement in the environment. These models can use input parameters generated from TFD studies, but errors could be introduced based on assumptions within the models. Differential results have been reported when using parameters from laboratory and field studies where PRZM modeling predicted herbicide dissipation (Ma et al. Reference Ma, Holland, James, McNaughton and Rahman2000).
Herbicide dissipation is commonly described by single first-order kinetics but it can be erroneous if other major factors on degradation are not considered (Baer and Calvet Reference Baer and Calvet1999; Diez and Barrado Reference Diez and Barrado2010). Herbicides sometimes exhibit a dissipation pattern that is biphasic, with a sharp initial decline, then followed by slower dissipation (Gustafson and Holden Reference Gustafson and Holden1990). The term half-life is used as a description of herbicide dissipation and is calculated as t 1/2 = 0.693/k. where k is the first-order rate constant. The half-life calculation assumes that dissipation is independent of the initial herbicide concentration. Making this assumption could introduce errors into herbicide fate modeling, leading field persistence forecasts to be misleading.
There have been attempts to validate herbicide fate models with field data. Carsel et al. (Reference Carsel, Mulkey, Lorber and Baskin1985) reported that the PRZM model was successful at predicting aldicarb fate using field-site data from three states. Pesticide runoff models could be accurate when simulations involved arid regions where sprinkler irrigation was the main water source but they were inaccurate when predicting where flood irrigation was used (Zhang and Goh Reference Zhang and Goh2015). Different initial herbicide concentrations and later model predictions seemed to be problematic when trying to predict herbicide soil profile movement (Mueller et al Reference Mueller, Jones, Bush and Banks1992; Willian et al. Reference Willian, Mueller, Hayes, Bridges and Snipes1999). When optimizing input parameters to match field settings, some herbicides still could not be accurately modeled (Mueller Reference Mueller1994). Sensitivity analysis of pesticide models showed that pesticide half-life was an important input parameter (Carsel et al. Reference Carsel, Mulkey, Lorber and Baskin1985). Initial concentration and data transformations can manipulate half-life values that will affect the model fit (Buelke and Brown Reference Buelke and Brown2001). Jackson (Reference Jackson2003) reported that different half-life values derived from the same data can vary in the PRZM-3 model and over all simulations, the shortest half-life fit the model best.
Initial herbicide concentration effects on subsequent dissipation have been reported. Sulfonylurea herbicide half-lives were influenced by the initial herbicide concentration that was applied at twice the normal field use rate (Menne and Berger Reference Menne and Berger2000). Rodrígues-Cruz et al. (Reference Rodríguez-Cruz, Pose-Juan, Marín-Benito, Igual and Sanchez-Martin2019) reported that dissipation rates of pethoxamid had decreased with the rate applied. Gan et al. (Reference Gan, Becker, Koskinen and Buhler1996) reported persistence of atrazine to be longer when higher rates were applied in the field. Gupta and Gajbhiye (Reference Gupta and Gajbhiye2002) reported flufenacet persistence was affected by initial dosage.
This research project was conducted with three herbicides commonly used in Tennessee. Although the three herbicides are similar in how they are used in production agriculture, they differ in chemical stability, recalcitrance to microbial degradation, volatility, and other chemical characteristics. These herbicides also belong to distinct chemical classes and cover a spectrum of short to long field persistence.
Saflufenacil has a relatively short field persistence (1 to 36 d) (Grossman et al. Reference Grossman, Niggeweg, Christiansen, Looser and Ehrhardt2010; Mueller et al. Reference Mueller, Boswell, Mueller and Steckel2014). Saflufenacil has been reported to dissipate quickly in most soils; however, environmental factors can influence that dissipation rate. Researchers in Canada reported saflufenacil carryover that negatively affected cabbage (Brassica oleracea L.), carrot (Daucus carota L.), cucumber (Cucumis sativus L.), onion (Allium cepa L.), pepper (Capsicum Annuum L.), and sugar beets (Beta vulgaris L.) planted a year later if applied at rates up to 200 g ai ha-1 (Robinson and McKnaught Reference Robinson and McNaughton2012). Additional data from Canada have suggested that saflufenacil can dissipate more slowly if the environment is not optimum for degradation (Gauthier and Mabury Reference Gauthier and Mabury2020).
Atrazine has a medium-length field persistence (60 d on average) (Shaner Reference Shaner2014). Atrazine has traditionally been classified as having a long persistence in field studies, but other data suggest enhanced degradation could be prevalent if soils are repeatedly exposed to atrazine (Krutz et al. Reference Krutz, Shaner, Weaver, Webb, Zablotowicz, Reddy, Huang and Thomson2010; Mueller et al. Reference Mueller, Parker, Steckel, Clay, Owen, Curran, Currie, Scott, Sprague, Stephenson, Miller, Prostko, Grichar, Martin, Kruz, Bradley, Bernards, Dotray, Knezevic, Davis and Klein2017). Atrazine degradation and dissipation has been well documented, and several dissipation routes were reported (Krutz et al. Reference Krutz, Shaner, Weaver, Webb, Zablotowicz, Reddy, Huang and Thomson2010).
Pyroxasulfone is characterized as having a relatively long field persistence (16 to 134 d) (Shaner Reference Shaner2014; Mueller and Steckel Reference Mueller and Steckel2011; Westra et al. Reference Westra, Shaner, Westra and Chapman2014). Dissipation was affected by soil moisture content and temperature (Kaur et al. Reference Kaur, Kaur and Kaur2024).
Given the importance of herbicide half-life as an input parameter used in simulation models, this research examined the interaction of initial herbicide dosage applied to the field or laboratory situation, and what effect that initial dosage had on the observed herbicide half-life in that particular situation. This effort was conducted as an environmentally focused soils project, as opposed to an agronomic project. Similar to how the U.S. EPA requests TFD field studies to be conducted, no crop was present, and the plot area was maintained free of vegetation. One difference from the U.S. EPA protocol was that additional rainfall was not added to exceed a certain amount of measured evapotranspiration as per the normal TFD protocol. Otherwise, our research is similar to how a registrant would conduct a TFD study. While appropriate methodologies were used throughout, good laboratory procedures were not fully implemented. The use rates ranged from 100 to 10,000 g ha−1, providing two orders of magnitude difference in the initial dosage in the field trial. These high-use rates would never be used under field situations (Anonymous 2025a, 2025b, 2025c) but were examined to determine the effect of dosage on observed half-life. Although mistake applications to fields are rare and never intention, where excessive rates are applied mistakes do occasionally occur and lead to questions about the following crops. In addition, given that these herbicides are routinely applied to the soil surface, in theory, a greater concentration of a given material could be present in the top 1 mm of soil soon after application.
The primary objective of this project was to elucidate the effect of initial dosage on observed herbicide half-life under field and laboratory conditions. A second objective was to examine the application of individual herbicides compared with the same herbicides at the same concentrations but applied in mixtures and to determine whether an interaction occurred between herbicides applied as a mixture in the soil environment. It is possible that soil microbes could preferentially alter the different herbicides due to the presence of the other herbicides.
The justification of this research resides with the supreme importance of accurately simulating pesticide fate in our environment. Given the great complexity of the natural ecosystem where pesticides are used, computer simulation programs are used to estimate and predict the environmental fate of pesticides after application. Understanding pesticide fate in soil is paramount to allow for sustainable use, if possible, or negate a given use of a pesticide if environmental loadings infringe upon the health and positive outcomes of humans or endangered species. A foundational question of these pesticide simulation models is how long a given chemical remains in the soil environment, denoted by the estimated dissipation of the compound.
Materials and Methods
Field Dissipation
Two field experiments were conducted in 2019 to 2021 at the East Tennessee Research and Education Center in Knoxville, in adjacent (20 m apart), but different parts of the same field. One started in May 2019 and the second in May 2020. The field had no previous residual herbicide use for several years and had been planted with soybean (Glycine max L. Merr.) in 2018. A tandem disk harrow was used to ensure soil surface uniformity of trial area prior to initiation. Field plots were in a Shady-Whitwell soil complex, pH 5.3, 10.7 meq/100 g CEC, and 2.7% organic matter (Table 1). Paraquat (Gramoxone® SL 2.0; Syngenta Crop Protection, Greensboro, NC) was applied prior to herbicide application to desiccate any plant material and was also used to maintain vegetation-free plots throughout the study. Plots were maintained with no vegetation to inhibit interference with sample collection as previously suggested (Gallaher and Mueller Reference Gallaher and Mueller1996; Mueller and Senseman Reference Mueller and Senseman2015) and to be consistent with TFD methods. Soil samples collected prior to herbicide application were analyzed to ensure that no residual herbicide was present in the soil (data not shown).
Table 1. Pertinent properties of soils from Tennessee, Georgia and Illinois used in dissipation experiments in 2019–2021.a,b

a Abbreviations: CEC, cation exchange capacity; OM, organic matter content; P, phosphorus; K, potassium; Mg, magnesium; Ca, calcium; meq, milliequivalents.
b Soil analysis was performed by Midwest Laboratories, Omaha, NE (https://midwestlabs.com).
Individual plots measured 3 m wide × 12 m long with 1-m buffer between treated areas. Treatments were applied in May for both field studies to coincide with normal preemergent application timings in cropping systems for this region (personal experiences). All treatments were applied using a CO2-pressurized backpack sprayer calibrated to deliver 190 L ha−1 at 276 kPa. The spray boom was 3 m wide and equipped with Tee Jet 8002 flat-fan nozzles (TeeJet Technologies, Glendale Heights, IL) on 0.5-m centers. Sprayer nozzles were approximately 0.75 m above and vertically oriented to the soil surface to ensure proper overlap of spray pattern. Additionally, to further facilitate uniform application, herbicides were mixed at one half the final rate and broadcast on each plot twice, spraying in opposite directions. The application technique of two applications per plot encouraged uniform distribution of test material and continuity of spray solution by thorough agitation of each mix. Considering that some treatment concentrations were high, mixing a fraction of the final concentration encouraged application uniformity. This application technique directly addresses Day 0 sampling error, a major hinderance posed by herbicide dissipation field research. Day 0 sampling errors are a common occurrence on these types of studies (Blumhorst and Mueller Reference Blumhorst and Mueller1997; Graham et al. Reference Graham, Clay, Jackson, Jones, Arthur, Barefoot and Clay2003).
The experimental design was a 3 × 3 factorial arrangement of treatments in a randomized complete block with three replications. The first factor was the commercially formulated herbicides of atrazine, pyroxasulfone, and saflufenacil. The second factor was the herbicide rates of 100, 1,000, and 10,000 g ai ha−1, which may be referred to as low, medium, and high, respectively. Additionally, a tank-mix treatment of all herbicides was applied at the 1,000 g ai ha−1 rate. The herbicide treatment rates used in the field studies are higher than normal use rates as previously discussed. Camargo et al. (Reference Camargo, Senseman, Haney, Guice and McCauley2013) used a similar technique of applying 15 times the normal use rate of saflufenacil for a field dissipation study.
Field Sample Collection and Analysis
Field soil sample collection intervals were approximately 0, 3, 7, 14, 21, 28, 42, 56, 79, 84, 98, 112, 140, 168, 196, 224, 280, and 365 d after treatment (DAT). Eighteen sampling intervals of 10 treatments and three replications and 2 yr resulted in 1,080 soil samples. Soil samples were collected using a golf-cup cutter (Par Aide Products, St. Paul, MN) and were 8 cm deep and 10 cm wide resulting in a soil sample of ∼800 cm3 (about 1,200 g). Soils were placed in freezer storage within 30 min of collection to minimize dissipation processes and samples remained frozen at −20 C until analysis. Soil sampling depth in these studies was limited to surface sampling, so there was the possibility that some herbicides could have leached below the sampling zone during the duration of the studies. Previous research has shown limited downward movement of herbicides in these soils under normal weather conditions (Willian et al. Reference Willian, Mueller, Hayes, Bridges and Snipes1999).
For processing, collected samples were removed from the freezer and thawed. Samples were thoroughly homogenized and a portion (15 ± 0.2 g of moist soil) was weighed into a 50-mL conical centrifuge tube (Nunc; Thermo Fisher Scientific, Waltham, MA) for extraction. The extractions were corrected for the amount of water in each sample, based on the starting and final dry weights of the sample. Methanol (30 mL) was added to the conical tube, placed on shaker for approximately 1 h, filtered using 0.45-μm polytetrafluoroethylene filters and analyzed via liquid chromatography–mass spectrometry (LC-MS) (6470 Triple Quadrupole; Agilent, Santa Clara, CA). The mobile phase was acetonitrile + 0.1% formic acid and water + 0.1% formic acid and used a phenyl-hexyl analytical column (Agilent). An external standard technique was used, and the conservative limit of detection was 1 ng g−1 for all herbicides in these soils. LC-MS peaks were converted to herbicide concentrations of nanograms per gram (ng g−1) of soil. Data were regressed as nanograms per gram against DAT using first-order kinetics exponential decay model by Sigmaplot version 14.0 (Systat Software, Chicago, IL). The software provided results for the Y intercept, the first-order rate constant, and the standard error around those parameter estimates for each regression curve. The herbicide concentration data was empirically fit to the following equation:
 $${\rm f} = a^*e^{(-b^*x)}$$
where a is the Y intercept and represents the hypothetical initial herbicide concentration, and b represents the first-order rate constant (k) empirically fitting the data of herbicide decline over time. This two parameter, single exponential decay model fit most of the data curves relatively well with some exceptions, r 2 mean = 0.922, minimum = 0.62, and maximum = 0.99. Half-life (t 1/2) was calculated using the first-order rate constant and the equation t1/2 = 0.693/k. Statistical evaluation of rate constants (and thus half-life values) was accomplished by comparing each rate constant ± its standard error, with a nonoverlapping interval indicating a difference in herbicide half-life values for those two examined regression lines (Mueller and Senseman Reference Mueller and Senseman2015).
Laboratory Degradation
Laboratory studies were conducted using previously described methods (Mueller et al. Reference Mueller, Parker, Steckel, Clay, Owen, Curran, Currie, Scott, Sprague, Stephenson, Miller, Prostko, Grichar, Martin, Kruz, Bradley, Bernards, Dotray, Knezevic, Davis and Klein2017). Soils were collected from the field location in Tennessee previously described, and also from Worth County, Georgia, near 31.50583°N, 83.65611°W; and Warren County, Illinois, near 40.66669°N, 90.751497°W (Table 1). Surface soils (0 to 15 cm) from Georgia and Illinois were collected from areas with no history of herbicide use in at least 20 yr. Soil from Georgia (0 to 15 cm), collected from a pecan [Carya illinoinensis (Wangenh.) K. Koch] orchard, was a Tifton sandy loam, pH 5.4, 4.6 meq/100 g CEC, and 0.9% organic matter. Soil from Illinois, collected from an organic farm, was a Sable silty clay loam, pH 6.6, 28 meq/100 g CEC, and 6.8% organic matter. Soils from Georgia, Tennessee, and Illinois were low, medium, and high in organic matter, respectively. Soil containers were opened periodically to ensure the soil’s aerobic processes were not prohibited. Soils were analyzed to ensure that no detectable residues of atrazine, saflufenacil, and pyroxasulfone were present before laboratory study initiation (data not shown).
Fortifying stock solutions were prepared for each herbicide from a separate analytical standard for atrazine, pyroxasulfone, and saflufenacil (all >98% purity) from ChemService, Inc. (West Chester, PA). Stock solutions were made by dissolving the analytical herbicide in water by stirring overnight and using gentle heat when needed. Stock solutions were filtered to remove any undissolved particles. Organic solvents have been reported to allow higher concentrations of herbicides to dissolve but these were not used in these experiments to avoid negative impacts on the microbial communities of soils (Dyrda et al. Reference Dyrda, Boniewska-Bernacka, Man, Barchiewicz and Slota2019). Final solutions were prepared by diluting the stock solution with water to the desired concentrations. A range of concentrations (all stated in ng g−1) of each herbicide was examined, including atrazine (44 to 9,140, mean = 1,675), pyroxasulfone (11 to 1,800, mean = 502), and saflufenacil (38 to 8,000, mean = 1,790). Each herbicide by concentration by soil combination was examined in 28 individual vials to determine degradation over time. Atrazine and saflufenacil concentrations had higher initial dosages than pyroxasulfone due to its lower water solubility (Shaner Reference Shaner2014). A mix of all three herbicides was added to discern differences in dissipation with tank-mix applications, similar to the field studies. When soils were being fortified, additional vials containing no soil were also “fortified” with the same amount of herbicide-containing solution. These vials were processed as the soil-containing vials to determine percent recovery, and also to verify precise and accurate initial herbicide doses in each experiment.
Moist soils were sieved using a 2.0-mm sieve (Gilson Company, Lewis Center, OH) to remove rocks and large debris. Soils were then saturated to field capacity and allowed to drain overnight. Vials for each soil were prepared similarly. Liquid scintillation vials (20 mL, Wheaton Millville, NJ) were prepared in pairs for each sampling interval and a portion of soil (5 ± 0.2 g moist soil) was added to each vial. Each vial was fortified with a single analytical herbicide dissolved in 500 µL of water. The combined herbicide treatments were fortified using 250 µL of each herbicide. Lesser amounts of aqueous herbicide solution were added to the vials for the three-way mixes to have similar soil moisture inside each vial, because soil moisture differences can affect herbicide dissipation (Savage Reference Savage1978; Taylor-Lovell et al. Reference Taylor-Lovell, Sims and Wax2002). Once soil and herbicide solutions were added, vials were then allowed to statically equilibrate in a dark incubator at 22 C for the duration of the study. Vials were opened and allowed to vent for approximately 30 min at approximately 56 DAT, then again at 126 DAT.
Duplicate vials of each treatment in each soil were removed from the incubator at −1 (prior to fortification), 0, 3, 7, 14, 21, 28, 42, 56, 70, 84, 98, 126, 154, 182 DAT and placed into storage at −20 C until extraction. Extraction of laboratory samples was performed similarly to field collected samples. Methanol (12 mL) was added to vials, placed on shaker (⁓1 h), filtered using 0.45-μm polytetrafluoroethylene filters and analyzed via LC-MS. LC-MS methods were the same as the field trials. Four different laboratory studies conducted with various combinations of soils (Georgia, Illinois, or Tennessee), the three herbicides at various initial concentrations either alone or in combination resulted in a total of 1,680 analyses for the laboratory portion of this research.
Results and Discussion
Field Dissipation
Weekly precipitation; and high, low, and average temperatures for the duration of the field studies were normal for this location (see Figures 1 and 2). Both studies received rain soon after application (1 wk), but overall rainfall patterns were different between years with 2019 having several dry periods in the months after herbicide application. Total precipitation for the 2019 field study measured 177 cm, which was markedly higher than the 2020 field study with 134 cm. Measured precipitation was above the 10-yr average for Knoxville, Tennessee, in the 2019 field study, but was normal for the 2020 field study. Observed temperature patterns were similar for the duration of the studies.

Figure 1. Average, minimum, and maximum weekly temperature and precipitation data for Knoxville, TN, during the 2019 herbicide dissipation study. Data are referenced to the date when herbicides were applied to field plots.
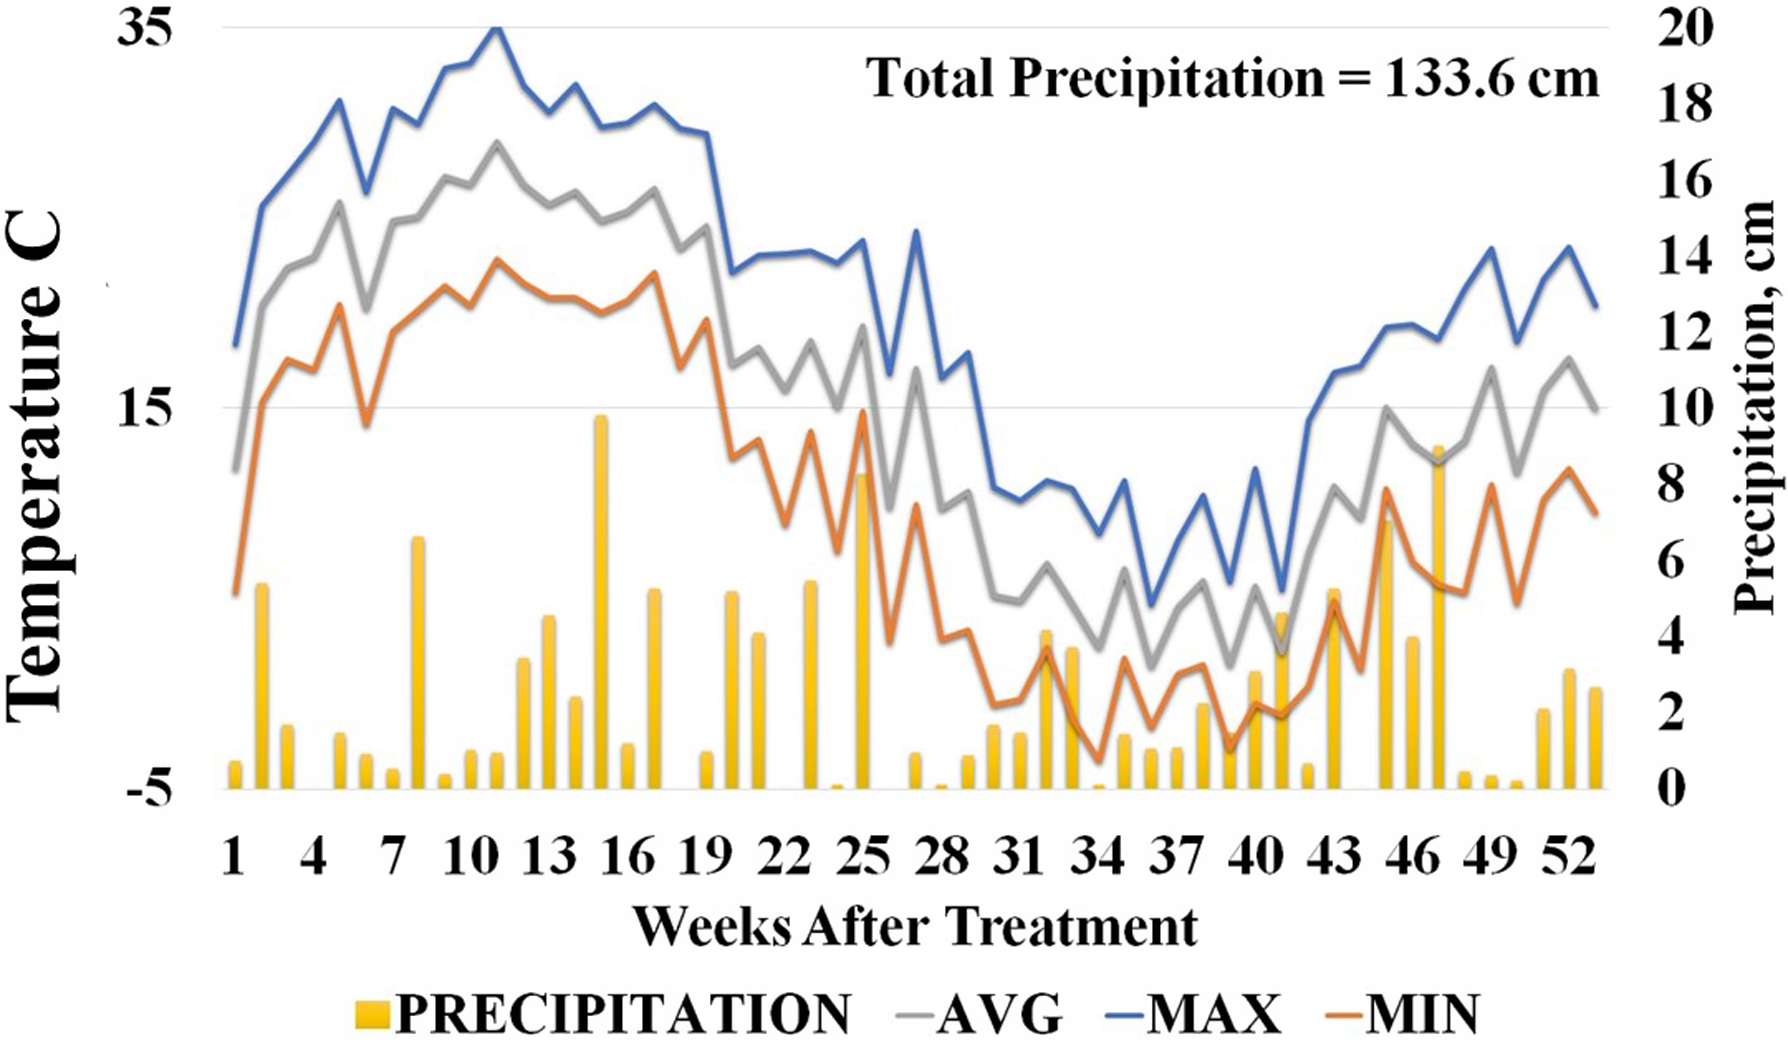
Figure 2. Average, minimum, and maximum weekly temperature and precipitation data for Knoxville, TN, during the 2020 herbicide dissipation study. Data are referenced to the date when herbicides were applied to field plots.
Soil samples were collected only from the 0- to 8-cm soil zone in this field study. This sampling procedure would not measure any herbicide moving below the surface zone. However, other dissipation losses were also not quantified. There was no attempt to measure how much herbicide was lost due to volatilization, or to photodegradation of each applied product. Thus, the measured herbicide concentrations in the 0- to 8-cm zone at each sampling interval represent the sum total of all processes acting simultaneously to reduce the herbicide concentration.
At the end of the sampling period for the field studies, >95% of the applied parent molecule had dissipated, which meets the EPA guidance for the duration of a TFD study (US EPA 2008). To illustrate the field experiment, a figure representing atrazine sprayed in 2020 is shown in Figure 3. Field study regression coefficients, r 2 values, and half-life values are presented in Table 2. Overall, herbicides dissipated in patterns as expected, following a characteristic biphasic curve (Figure 3). Half-life values were essentially identical comparing the same herbicide at 1,000 g/ha applied alone or in a mixture to a common plot (Table 2). The values from single herbicide or mixed herbicide applications were all considered in the later overall regression analysis.

Figure 3. Atrazine dissipation in 2020 in field soil from a Tennessee location as a function of initial herbicide concentration over time. Low, medium and high rates of atrazine were applied at 100, 1,000 and 10,000 g ai ha−1. The half-life is reported in days for each plot based on first-order regression analysis. Data points are shown as the mean of three field replications ± 1 SE. Solid lines represent first-order regression lines. Actual regression parameters for all field data are shown in Table 2.
Table 2. Field study regression coefficients, r 2 values, and half-life in days for atrazine, pyroxasulfone, and saflufenacil from field studies in Knoxville, TN, from experiments started in 2019 and 2020.a,b

a Abbreviations: A, atrazine, PYROX, pyroxasulfone, SAF, saflufenacil; SE, standard error.
b Mix indicates that all three herbicides were fortified within a single soil sample for each experimental unit.
Atrazine half-life in 2020 was 9.3, 12.1, and 12.9 d for 100, 1,000, and 10,000 rates, respectively (Figure 3). These half-lives are shorter than previously reported for atrazine, but are comparable to those in soils that have an atrazine use history (Krutz et al. Reference Krutz, Shaner, Weaver, Webb, Zablotowicz, Reddy, Huang and Thomson2010; Mueller et al. Reference Mueller, Parker, Steckel, Clay, Owen, Curran, Currie, Scott, Sprague, Stephenson, Miller, Prostko, Grichar, Martin, Kruz, Bradley, Bernards, Dotray, Knezevic, Davis and Klein2017). The atrazine results in 2019 were different, with more rapid atrazine loss at the 10,000 dose compared with the lower doses (Table 2). All atrazine half-life values were <15 d, which suggested that enhanced degradation could explain the lower half-lives. Calculated half-lives were unchanged based on different initial concentrations, and regression analysis suggests there is no relationship between dissipation rate and initial herbicide concentration under field conditions (r 2 = 0.080) (Figure 4).

Figure 4. Regression analysis of first-order half-life (in days) against the initial herbicide dose (measured in nanograms per gram of soil at Day 0) from field studies carried out in Tennessee in 2019 and 2020. The regression equation is y = mx+b, where m is the linear slope of the regression line and b is the y intercept. Half-life values are based on the entire sampling interval for the various individual treatments.
Pyroxasulfone dissipation in the field was more rapid in both years at 100 and 1,000 ng g−1, and less rapid at 10,000 ng g−1 (Table 2). Pyroxasulfone half-lives in 2020 were 24, 26, and 54 d for low, medium, and high rates, respectively (Table 2). Results were similar in 2019 (Table 2). These half-lives are comparable to those reported in previous studies of pyroxasulfone (Mueller and Steckel Reference Mueller and Steckel2011; Westra et al. Reference Westra, Shaner, Westra and Chapman2014). Dissipation of pyroxasulfone is variable, with the major environmental contributor reported to be soil moisture, and the major degradation pathway to be microbial. Regressing initial concentration against observed half-lives suggests there is a relationship (r 2 = 0.92), and a higher initial pyroxasulfone herbicide concentration correlates to a greater half-life (Figure 4). However, caution is advised, since only two observations are basically responsible for this correlation. Additionally, the highest rate for pyroxasulfone is approximately 100 times the normal use rate of 100 g ha−1. Still, for pyroxasulfone, there was an effect of initial concentration on observed half-life in the field, with both years providing consistent findings.
Saflufenacil half-life values in 2020 were 7.2, 8.7, and 9.2 d for 100, 1,000, and 10,000 ng g−1, respectively (Table 2). Results from 2019 were similar, with all half-life values less than 10 d (Table 2). These half-lives are comparable to the reported half-lives of 1 to 36 d (Mueller et al. Reference Mueller, Boswell, Mueller and Steckel2014; Shaner Reference Shaner2014). Although these half-lives are markedly shorter than >200 d reported in a study in Canada (Robinson and McKnaughton Reference Robinson and McNaughton2012). These differences can be attributed to the effects of temperature conditions on saflufenacil dissipation. Saflufenacil half-lives in the field studies were not correlated to the initial concentrations, and regression suggested there was no relationship (r 2 = 0.0038) (Figure 4).
Field studies indicated half-lives for atrazine, pyroxasulfone, and saflufenacil were comparable to those in previous reports. Regression analysis suggested that atrazine and saflufenacil dissipation were unaffected by herbicide concentration (r 2 = 0.080 and 0.0038 for atrazine and saflufenacil, respectively), while pyroxasulfone dissipation was positively correlated with initial herbicide concentration (r 2 = 0.92). These data indicate that herbicide concentration can have an effect on rate of dissipation under field conditions for one of three herbicides examined. However, the 10,000 ng g−1 rate of pyroxasulfone was an extreme departure from the normal use rate, although the 10,000 ng g−1 dose for saflufenacil was also an extreme departure. These data indicate that using a single half-life in computer simulations based on an independent initial concentration would not increase errors in herbicide modeling for atrazine and saflufenacil, but for pyroxasulfone some errors may occur at higher initial doses.
Laboratory Degradation
For all laboratory degradation study results, it is important to remember that this test system precludes the possibly major dissipation mechanisms of photodegradation (because the incubator was dark), volatilization (the vials were sealed, so no vapor was emitted), and leaching from the surface soil zone (there was no water movement) (Mueller and Senseman Reference Mueller and Senseman2015). Thus, the laboratory studies were a measurement of degradation by microbial or chemical processes. There was no apparent effect of one herbicide affecting the degradation of another herbicide in any of the soils in those treatments in which multiple herbicides were examined in the same vial (see Table 3). The first-order regression analyses provided good indications of herbicide dissipation, with the r 2 mean over all studies being 0.9465 (all values are shown in Table 3)

a Abbreviations: ATR, atrazine; GA, Georgia; IL, Illinois; ppb, parts per billion; ppbw, parts per billion by weight; PYROX, pyroxasulfone; SAF, saflufenacil; SE, standard error; TN, Tennessee.
b R 2 values ranged from 0.79 to 0.99, with a mean of 0.9465 and a median of 0.96 (individual values not shown). Measured initial herbicide concentration ± 1 SE and first-order rate constant ± 1 SE, and half-life in days for atrazine, pyroxasulfone, and saflufenacil. Herbicides were added to untreated soils alone (no mixed) or with all three herbicides together in comparable initial concentrations (yes mixed). Each line in the table is based upon regression of data sets of n = 28 from 0 to 182 d after initial dosing. Soil descriptions appear in Table 1. Four laboratory studies were conducted, denoted as LS1 to LS4 (column 1).
c Mix indicates all three herbicides were fortified within a single soil sample for each experimental unit.
Atrazine degradation half-life in Tennessee soil ranged from 9 to 39 d (Table 3). These half-life values were comparable where enhanced atrazine degradation has been reported (Krutz et al. Reference Krutz, Shaner, Weaver, Webb, Zablotowicz, Reddy, Huang and Thomson2010; Mueller et al. Reference Mueller, Parker, Steckel, Clay, Owen, Curran, Currie, Scott, Sprague, Stephenson, Miller, Prostko, Grichar, Martin, Kruz, Bradley, Bernards, Dotray, Knezevic, Davis and Klein2017). Different initial concentrations of atrazine showed a difference in subsequent degradation in Tennessee soil (Figure 5, red box symbols). This response appeared to follow a nonlinear curve, with lower half-life values at higher initial doses, regression values not shown (Figure 5). Half-life values for soils from Georgia ranged from 23 to 31 d, with a mean of 26; half-life values for soils from Illinois ranged from 31 to 38 d, with a mean of 33 (Table 3). Both the Georgia and Illinois soils had no previous history of atrazine use, which contributed to the slower dissipation compared with the Tennessee soil.

Figure 5. Regression of herbicide half-life values against initial herbicide dosages in laboratory studies from three different soils and three different herbicides. Symbols indicate various soils: stars (★) = Illinois soil; triangles (▲) = Georgia soil; squares (■) = Tennessee soil. See Table 1 for details of soil parameters. Different initial doses (the X variable on the graph) for the herbicides were established by using different concentrations of fortifying herbicide solutions.
The pyroxasulfone half-life ranged from 18 to 89 d (Table 3). Mean half-life values for Georgia, Illinois, and Tennessee were 78, 59, and 37 d, respectively. The laboratory data from Tennessee soils exhibited similar pyroxasulfone dissipation in laboratory conditions compared with the Tennessee field studies (Table 2). These comparisons of pyroxasulfone in the field and laboratory suggest that microbial degradation was a dissipation pathway, but other mechanisms may also be important. Slower laboratory dissipation in Georgia and Illinois soils was not expected, and the basis for those observations is unknown.
Saflufenacil degradation half-life values ranged from 15 to 90 d (Table 3), with 54, 74, and 34 d for Georgia, Illinois, and Tennessee, respectively. Dissipation of saflufenacil in the laboratory occurred more slowly than it did in the field (Table 2), indicating other loss mechanisms besides microbial and chemical degradation were affecting saflufenacil loss in the field environment.
Regressing initial saflufenacil and pyroxasulfone concentration and calculated half-life in the laboratory studies suggested no correlation (r 2 = 0.04) (Figure 5). Interestingly, when atrazine’s initial concentration was regressed against half-life values, there was a correlation (r 2 = 0.45) (Figure 5). However, a visual inspection of the Tennessee data suggested a curvilinear regression would fit the data better (r 2 = 0.86, curvilinear regression analysis not shown). Atrazine data suggested that an increase in concentration would result in a shorter half-life, or that higher initial concentrations of atrazine decreased dissipation time. This finding contradicts the initial thoughts that an increase in concentration would increase the rate of dissipation. Soils with known or suspected enhanced herbicide degradation should be noted in TFD studies because dissipation calculations could be altered compared with a soil without enhanced degradation.
In field and laboratory studies, herbicide mixes were also included as treatments. However, the data indicated that mixes and individual herbicides dissipated similarly (Tables 2 and 3). Confidence intervals were compared around first-order rate constants, and because confidence intervals overlapped, there was no significant difference in the dissipation rates of mixes vs. individual herbicides.
Although herbicide degradation can be positively or negatively influence in soils when mixed with other pesticides, we did not observe this. It is common practice for an applicator to apply several different products together for similar and/or completely different control measures (i.e., herbicide and fungicide, herbicide and herbicide, herbicide and insecticide, etc.) in the same crop. For instance, Haney et al. (Reference Haney, Senseman, Hons and Zuberer2000) reported that glyphosate stimulated soil microbial activity. Stimulated microbial activity could cause shorter half-life values than previously observed if applied as a tank mix.
Practical Implications
These results suggest that initial herbicide concentration did not influence dissipation rates for two of three herbicides in the field and two of three in the laboratory, although they were different herbicides that were affected by initial concentration; and the response was different for the two affected herbicides. Pyroxasulfone had slower field dissipation at high rates compared with low rates, and atrazine degraded more rapidly at high compared with lower initial doses. The reasons for these observations are areas for further study.
A second finding is that research examining herbicide in TFD studies could potentially examine more than one herbicide per study. Currently, typical TFD studies include two or three plots of a single active ingredient with at least a 1-yr duration (>95% dissipation). Benefits to these study arrangements include cost savings as compared with current TFD parameters and possible reduction in study variability.
Acknowledgments
We thank Trey Clark, Joseph Beeler, Dave Kincer, and Shelby Lanz for their technical assistance. Soils collected by Dr. Mark Bernards (U.S. Department of Agriculture–Agricultural Research Service) and Dr. Eric Prostko (University of Georgia) are appreciated.
Funding
This research received no direct support from any industry sponsor. This research was supported in part by Hatch Project grant TEN 0526 from the Tennessee Agricultural Experiment Station.
Competing Interests
R. Landry is employed by Valent USA, which sells a formulated product that contains pyroxasulfone. The other authors declare no conflicts of interest.


 Open access