


I. INTRODUCTION
The polycarboxylate anions are the precursors of a huge set of coordination polymers (Horike and Kitagawa, Reference Horike and Kitagawa2011). This abundance of compounds is because of the strength of the bonds that form, the wide range of possible O-donor ligands, and the different coordination modes they exhibit (Salles et al., Reference Salles, Maurin, Serre, Llewellyn, Knöfel, Choi, Filinchuk, Oliviero, Vimont, Long and Férey2010). In the subset of aliphatic carboxylates, a large conformational freedom property must be added; which manifests itself in a variety of connection modes that yield a wide variety of architectures and topologies, many of which remain unexplored (Rao et al., Reference Rao, Natarajan and Vaidhyanathan2004; Sibille et al., Reference Sibille, Mazet, Malaman, Wang, Didelot and François2015; Yang et al., Reference Yang, Qin, Cheng, Zhang and Yao2015 and references therein). Some of the aliphatic carboxylates possess novel properties as adsorbents (Rao et al., Reference Rao, Natarajan and Vaidhyanathan2004 and references therein), molecular sieve (Rao et al., Reference Rao, Natarajan and Vaidhyanathan2004 and references therein), magnetic (Kim et al., Reference Kim, Jung, Hong and Demazeau2001; Rao et al., Reference Rao, Natarajan and Vaidhyanathan2004 and references therein; Saines et al., Reference Saines, Barton, Jain and Cheetham2012), optical (Rao et al., Reference Rao, Natarajan and Vaidhyanathan2004 and references therein), luminescent (Yang et al., Reference Yang, Qin, Cheng, Zhang and Yao2015), and non-linear optical materials (Jiang and Fang, Reference Jiang and Fang1999; Ahmad et al., Reference Ahmad, Ahmad and Kotru2015) in addition to serving as precursors of nanoparticles (Randhawa and Gandotra, Reference Randhawa and Gandotra2006). To take advantage of these properties in technological applications, it is necessary to determine the crystalline structure of the new compounds and carry out systematic crystallographic studies that will allow finding regularities in the interaction between organic ligands and metals building units. Establishing these regularities is also possible to find correlations between metal–ligand interactions and the phase composition of the reaction products in equilibrium in order to obtain the compounds as pure as possible. In addition, the thermal evolution of these materials can be very complex, which is closely related to their properties (Saines et al., Reference Saines, Barton, Jura, Knight and Cheetham2014).
In this study, we report the syntheses, and the crystallographic, vibrational, and thermal characterizations of two zinc aliphatic dicarboxylates with molecular formulas: [Zn2(C6H8O4)2] (zinc adipate) and [Zn2(OH)2(C4H4O4)] (zinc succinate). From now on, we will refer to them as ZnAdp and ZnSc, respectively. The crystal structure of ZnSc was determine from the single crystal and the thermal expansion coefficient of ZnAdp was estimated from powder diffraction patterns at 298 K and the crystal structure reported at 123 K (Klaus et al., Reference Klaus, Lehenmeier, Herdtweck, Deglmann, Ott and Rieger2011).
II. EXPERIMENTAL
The coordination polymers compound were prepared by the precipitation method from aqueous solutions of zinc acetate [Zn(C2H3O2)2·2H2O, Meyer Chemical Reagent grade] and adipic acid (C6H10O4, Sigma-Aldrich Reagent grade), or succinic acid (C4H6O4, Meyer Chemical ≥ 99.8%), with sodium hydroxide (NaOH, Hycel valued volumetric solution 1 N). In both the cases, the salt solution was added slowly into the acid solution. The mixtures were transfer to 85 ml Teflon-lined stainless steel autoclaves for a hydrothermal treatment. The concentrations, temperature, and time of both solutions are presented in Table I. After the hydrothermal treatment, the precipitates were washed with distilled water and separated by centrifugation; finally they were slowly dried at laboratory conditions.
Table I. Synthesis conditions and reagents used.

a C6H10O4, Sigma-Aldrich reagent grade.
b C4H6O4, Meyer chemical ≥99.8%.
c Zn(C2H3O2)2.2H2O, Meyer Chemical reagent grade.
Infrared (IR) spectra from 4000 to 400 cm−1, were obtained using a Nicolet FT-IR iS5 spectrometer in an ATR mode. Thermogravimetric analyses were carried out using a TA Instruments high-resolution (Hi-Res™) thermogravimetric analyzer, TGA 2950. The mass loss profiles of the samples studied were analyzed using the instrument control software Universal Analysis 2000 v 4.4A. The heating rate was dynamically controlled from 0.001 to 5 °C min−1 (instrumental resolution = 5) with an air purge rate of 62.5 ml min−1. True densities experiments were performed with helium in AccuPyc 1340 gas pycnometer from Micromeritics. About 0.1 cm3 of dry powders samples were placed in the sample cup and purged with helium tenfold. Then, ten density experimental runs were carried out.
X-ray powder diffraction patterns were collected in Bragg–Brentano geometry at 298 K with CuKα 1 radiation, Bruker (D8 Advance), with a primary graphite monochromator and a lynx-eye detector. The unit cell was previously identified and its parameters were calculated during the Miller indexes assignment with the help of TREOR and DICVOL algorithms (Werner et al., Reference Werner, Eriksson and Westdahl1985; Boultif and Louer, Reference Boultif and Louer2004). The ZnAdp crystal structure was refined by the Rietveld method with the FullProf program (Rodríguez-Carvajal, Reference Rodríguez-Carvajal1993) using the reported crystal structure of this compound at 123 K (Klaus et al., Reference Klaus, Lehenmeier, Herdtweck, Deglmann, Ott and Rieger2011). All non-hydrogen atoms were refined with isotropic displacement parameters (IDP) restricting its change by atom type. The zinc atoms were refined first, then oxygen and, at the end the carbon.
The X-ray diffraction (XRD) data for the ZnSc were collected at 298 K on a Bruker Smart Apex diffractometer equipped with a CCD detector maintained near –54 °C and the χ-axis fixed at 54.74°. The frame data were acquired with the SMART (Bruker, 1999) software using MoKα radiation (λ = 0.71073 Å) from a fine-focus tube. Initial cell constants were determined from ninety 15-s frames. A complete hemisphere of data is scanned on omega (0.3°) with a run time of 15 s per frame at the detector resolution of 512 × 512 pixels. A total of 2400 frames were collected in four sets and a final set of 50 frames, identical to first 50 frames, were also collected to determine crystal decay. The frames were then processed using the SAINT software (Bruker, 2008b) to give the hkl file corrected for L p/decay. Absorption corrections were applied (transmission range: 0.5533–0.7452) using the SADABS program (Bruker, 2008a). The crystal used for the diffraction study showed no decomposition during data collection. The number of measured and unique reflections was 3224 and 334, respectively, with R int 0.0442. Assignment of the space group was un-ambiguous and the unique group Cccm was dictated by the systematic absences in addition with a centric intensity distribution statistics. The structure was solved by direct methods, using the SHELXS program (Sheldrick, Reference Sheldrick2008) and refined by least-squares method on F 2, SHELXL-2014 (Sheldrick, Reference Sheldrick2008), incorporated in APEX2 suite (Bruker, 2012). All non-hydrogen atoms were refined anisotropically. Hydrogen atoms attached to C-atoms were placed in their geometrically generated positions and refined as a riding model, while those attached to O-atoms were located on a difference Fourier map at advanced refinement stage and their positional parameters refined.
III. RESULTS AND DISCUSSION
A. Vibrational analyses
The IR spectra of both precipitates do not show the characteristic bands of the precursor acid at about 1700 cm−1. This confirms that the carboxylate groups in the adipate and succinate ligands are completely deprotonated. The absence of ν (OH) vibration evidences that ZnAdp is anhydrous. The ν (OH) vibration in ZnSc, appears as a broad signal in the region from 3430 to 3146 cm−1. The widening is evidence of the existence of hydrogen bonding in the crystal structure. This signal is not very strong, suggesting the absence of water molecules.
The asymmetric ν as (CO2) and symmetric ν s (CO2) stretching vibrations are found in the region of 1600–1300 cm−1. These bands are sensitive to the nature of the bonding with the metal ions; therefore, their separation is also indicative of the structure of a given carboxylate. Several rules have been established in the literature (Deacon and Phillips, Reference Deacon and Phillips1980) to relate the coordination modes of the carboxylate groups with the separations between the bands (Δν). The IR spectra of ZnAdp and ZnSc show the ν as (CO2) bands at 1530 and 1534 cm−1 and two ν s (CO2) bands at 1445, 1400 cm−1 and 1403, 1385 cm−1, respectively. The absorption bands shift are Δ = 150 cm−1 for ZnSc and 130 cm−1 for ZnAdp, which is consistent with bridge bidentate syn-anti coordination mode of the carboxylates group (Deacon and Phillips, Reference Deacon and Phillips1980). The presence of two ν s (CO2) bands in each case suggest two different bond distances in syn and anti coordinations modes of the ligand with zinc atoms. The shift in the position of the ν s (CO2) bands is associated with the difference in the chain lengths of adipate and succinate ligands.
B. Thermogravimetric analysis
Thermogravimetric curves have no thermal events at temperatures below 200 °C. This behavior is consistent with the anhydrous character of the compounds observed by IR spectroscopy. A single thermal event with a weight loss of 60.55% is observed from 340 to 417 °C for ZnAdp. It was assigned to the evolution of C6H8O3, associated with the decomposition process (expected weight loss: 61.15%). The thermal evolution is more complex in ZnSc than in ZnAdp sample. The ZnSc sample thermogravimetric curve shows two thermal events. The first starts at 209 °C up to 264 °C, where the weight loss rate approaches to zero. This tendency continues until 357 °C where the weight loss rate increases sharply due the second thermal event. This weight loss ends at 429 °C to complete a full-weight loss of 36.48%. Thermogravimetric profiles of transition metal hydroxosuccinates under oxygen atmosphere show a unique and abrupt weight loss, characteristic of the anions evolution (Livage et al., Reference Livage, Egger, Nogues and Ferey1998). A profile with two thermal events suggests the existence of impurities in the sample. The impurity prevents a quantitative analysis based on the thermogram. However, it can be assumed that the second thermal event is associated with the decomposition of ZnSc, among other events.
C. Crystal structures
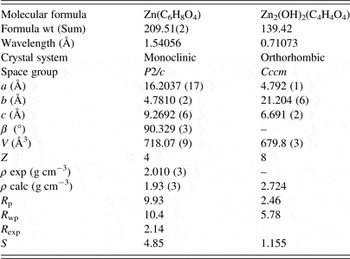
The XRD analysis reveals that compounds studied exhibit very different molecular structures. Their patterns were indexed in a monoclinic (adipate) and orthorhombic (succinate) unit cell with figure of merit M(20) > 80 and F(20) > 130. Table II shows the crystal data and their cell parameters refined.
1. Zn2(C6H8O4)2(ZnAdp)
The (2 0 0) and (4 0 0) reflections of ZnAdp powder pattern at 298 K are shifted with respect to the position of this peaks in the simulated powder pattern reported by Klaus et al. (Reference Klaus, Lehenmeier, Herdtweck, Deglmann, Ott and Rieger2011) (Figure 1). The crystal structure of ZnAdp reported by Klaus et al., was determinate by single crystal at 123 K. The structure at 298 K was refined in the same space group P2/c but with slight expansion of the cell volume of 0.95%. Therefore, the shifts described above could be explained based on positive thermal expansion of the material. The coefficient of isobaric thermal expansion calculated from the structures at 123 and 298 K crystallographic data is 5.40 × 10⁻⁵ K−1. The highest temperature dependence occurs in a direction. A similar behavior was observed in an isostructural cobalt adipate (Saines et al., Reference Saines, Barton, Jura, Knight and Cheetham2014).
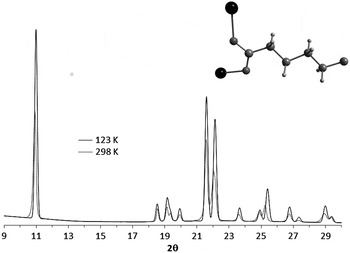
Figure 1. XRD powder patterns of ZnAdp at 298 K (dashed line) and simulated from Klaus et al. (Reference Klaus, Lehenmeier, Herdtweck, Deglmann, Ott and Rieger2011) data at 123 K (solid line). Inset, bridge bidentate syn-anti coordination mode of the carboxylates group.
Table II. Crystal data and structural refinement parameters.
The asymmetric unit contains one crystallographic site for: Zn(II) cation and two halves of adipate ligands [L1: C1–C3, Oc1–Oc2; L2: C4–C6, Oc3–Oc4], accommodating four formula units (Z = 4) in the unit cell. The two halves of adipate ligands L1 and L2 have the same coordination modes: bridge bidentate syn-anti as was predicted in the vibrational analysis section (Figure 1, inset). The atoms of zinc, present a tetrahedral coordination, by four oxygen atoms of adipate ligands (L1, L2). The bond distances and angles of the ZnO4 tetrahedral and adipate ligands are very similar to those found at 123 K.
2. Zn2(OH)2(C4H4O4)(ZnSc)
X-ray powder diffraction studies revealed some impurities which could not be identified. This corresponds with the results of thermal analysis.
The structure of this compound was determined by single crystal in the Cccm space group. The asymmetric unit contains one crystallographically site for: Zn(II) cations (Zn), succinate ligand (L1: C1→C2, Oc1→Oc2) and hydroxyl group (Oh), accommodating eight formula units (Z = 8) in the unit cell. The zinc atom has a tetrahedral coordination, two oxygen atoms of different chains succinate [Zn–Oc1 = 1.962(3) and Zn–Oc2 = 1.992(3) Å] and two oxygen atoms of hydroxyl groups [Zn–Oh = 1.937(2) Å]. Tetrahedrons are connected via the hydroxyl groups to form one-dimensional inorganic chains [Zn···Zn = 4.792 (2) Å] parallel to the axis c (Figure 2). Carboxylates succinate anions exhibit the bridge bidentate coordination, allowing the carbon atoms of ligand act as pillars [Zn···Zn = 7.117 (2) Å] between chains ZnO4. The resulting framework is a polymer sheets linked by hydrogen bonds [Oh···Oh = 2.869 (3) Å] through the hydroxyl groups.

Figure 2. Layers of ZnO4 tetrahedra chains connected by succinate ligands interacting with each other by hydrogen bond in 2 × 1 × 2 supercell of ZnSc. View in the c-direction. The oxygen atoms are represented in globe style.
Solvent accessible voids in crystal structures of ZnAdp and ZnSc calculated by PLATON (Spek, Reference Spek2009) were null for probes radius greater than 1 Å. These estimations were confirmed experimentally by CO2 adsorption at 273.15 K up to 1 atm.
SUPPLEMENTARY DATA
Infrared spectra and thermogravimetric curves of ZnAdp and ZnSC, an image of the crystal structure of ZnAdp, atomic positions, bonds distances, and angles for the structure of both compounds are supplied as supplementary information.
SUPPLEMENTARY MATERIAL
To view supplementary material for this article, please visit http://dx.doi.org/10.1017/S0885715616000221.
ACKNOWLEDGEMENTS
This research was partially supported by the Projects: CONACyT 154626, CONACyT-CNPq 174247, SECITI-CLAF 025/2014, and DAGAPA-PAPIIT IG-100315. SENER-117373, CONACYT-CB2007-82964. The authors thank Damaris Cabrero Palomino and Adriana Tejeda Cruz for their technical assistance.


