


Introduction
Habitats shaped by distinctive geological and extreme edaphic conditions are biodiversity hotspots that support highly specialised and often threatened species adapted to harsh, nutrient-poor soils (Hulshof and Spasojevic Reference Hulshof and Spasojevic2020). Soil properties play a crucial role in driving plant species composition, with complex geologies contributing to global biodiversity (Myers et al. Reference Myers, Mittermeier, Mittermeier, Da Fonseca and Kent2000). Examples such as the limestone grasslands of Europe (Köhler et al. Reference Köhler, Gigon, Edwards, Krüsi, Langenauer, Lüscher and Ryser2005), the white sand soils of Guyana (Fine and Baraloto Reference Fine and Baraloto2016), and ultramafic and karst ecosystems in tropical regions (Garnica-Díaz et al. Reference Garnica-Díaz, Berazaín Iturralde, Cabrera, Calderón-Morales, Felipe, García, Hechavarría, Guimarães, Medina, Paul, Rajakaruna, Restrepo, Siebert, Van Den Berg, Van Der Ent, Velasquez and M. Hulshof2023; Geekiyanage et al. Reference Geekiyanage, Goodale, Cao and Kitajima2019) highlight how soil composition fosters habitat specialisation and endemism. While environmental heterogeneity is central to structuring these ecosystems (Trethowan et al. Reference Trethowan, Brambach, Cámara-Leret, Laumonier, Sheil, Ferry Slik, Webb, Murdjoko, Bastian, Kartawinata, Mansor, Mansur, Mirmanto, Nurtjahya, Permana, Rozak, Wilkie, Rahmad, Arifiani, Putu Gede, Damayanto, Puglisi, Asmarayani, Benu, Bramley, Dharma, Heatubun, Hidayat, Kuswandi, Mathews, MegawatiRustiami, Santika, Santoso, Setiawan, Triono, Wambrauw, Wanma, Hery Yanto, Siregar, Sadili, Dewi Atikah, Kintamani, Tjoa, Culmsee, Girmansyah, Gunawan, Pitopang, Utteridge, Morley, Schrader and Brearley2024), the mechanisms underlying plant diversity and adaptation in such soils remain poorly understood, especially in certain regions of the tropics. Despite their global distribution, these habitats are often overlooked in macroecological studies, which tend to prioritise climatic gradients over geodiversity (Gaston and Blackburn Reference Gaston and Blackburn2000). Heathlands in Southeast Asia are one such habitat that highlights the ecological significance of these underappreciated systems.
Heathlands are characterised by perennial sclerophyllic plants thriving on highly acidic and nutrient-poor sandy soils and represent some of the most diverse ecosystems globally (Adeleye et al. Reference Adeleye, Haberle, Harris, Hopf, Connor and Stevenson2021; Proctor et al. Reference Proctor, Anderson, Chai and Vallack1983a). This unique combination of soil properties supports high levels of local endemism and species turnover along environmental gradients (Keith et al. Reference Keith, Lindenmayer, Lowe, Russell-Smith, Barrett, Enright, Fox, Guerin, Paton, Tozer and Yates2014). Heathlands are particularly extensive in tropical regions, where they often form transitional habitats from flooded river basins to drier forests, notably in the lowlands of Brazil, Colombia, Peru, and Venezuela (Coomes and Grubb Reference Coomes and Grubb1996), parts of the Guyanas (Adeney et al. Reference Adeney, Christensen, Vicentini and Cohn-Haft2016), and coastal West Africa (Proctor Reference Proctor1999). The origin of these ecosystems dates to the Pleistocene, arising from sediment aggradation during periods of lower sea levels and drier climates (Thorp et al. Reference Thorp, Thomas, Martin and Whalley1990), and influenced by subsequent climatic variations and indigenous land-use practices (Adeleye et al. Reference Adeleye, Haberle, Harris, Hopf, Connor and Stevenson2021; McWethy et al. Reference McWethy, Haberle, Hopf and Bowman2017).
Heathlands in the Sundaland biodiversity hotspot of western Indonesia and Malaysia form a distinct and poorly documented ecoregion known locally as ‘kerangas’ (Dinerstein et al. Reference Dinerstein, Olson, Joshi, Vynne, Burgess, Wikramanayake, Hahn, Palminteri, Hedao, Noss, Hansen, Locke, Ellis, Jones, Barber, Hayes, Kormos, Martin, Crist, Sechrest, Price, Baillie, Weeden, Suckling, Davis, Sizer, Moore, Thau, Birch, Potapov, Turubanova, Tyukavina, De Souza, Pintea, Brito, Llewellyn, Miller, Patzelt, Ghazanfar, Timberlake, Klöser, Shennan-Farpón, Kindt, Lillesø, Van Breugel, Graudal, Voge, Al-Shammari and Saleem2017). These habitats exhibit a distinctive coexistence of typical heathland vegetation dominated by shrubs and trees (Davies et al. Reference Davies, Moss and Hill2004), forming unique forest formations (Sprecht and Womersley Reference Sprecht and Womersley1980). The lowland kerangas forests of Borneo are particularly notable, sharing characteristics with high elevation or coastal heath forests, but differing markedly in their habitat structure (Ikbal et al. Reference Ikbal, Din, Tuah, Md Jaafar, Ahmad and Sukmaria Sukri2023). These forests exhibit substantial variation in hydrology (De Graaf et al. Reference De Graaf, Bobbink, Smits, Van Diggelen and Roelofs2009) and can comprise tall, closed canopies, stunted, dry savannah-like open canopies or wet kerangas conditions (Kartawinata Reference Kartawinata1980; MacKinnon Reference MacKinnon1996). Central Kalimantan in Indonesia hosts the most extensive kerangas habitats, often appearing as patches within mixed dipterocarp forests or as stunted lower montane forests (Ashton Reference Ashton2014). Heterogeneous formations and the lack of a clear definition owing to several variations of this habitat type have made it challenging to document kerangas forests accurately both ecologically and geographically. Attempts to classify kerangas have been based on varying soil properties (Langner et al. Reference Langner, Achard, Vancutsem, Pekel, Simonetti, Grassi, Kitayama and Nakayama2015; Saxon and Sheppard Reference Saxon and Sheppard2010). Early assessments (Brünig Reference Brunig1974; MacKinnon Reference MacKinnon1996) are based on gross estimations limited by technology and remote sensing information, potentially misrepresenting them as dipterocarp forests, swamps, or degraded areas.
Despite extensive studies on the floristic and soil characteristics of kerangas elsewhere in Borneo (Brünig Reference Brunig1974, Din et al. Reference Din, Metali and Sukri2015, Newbery and Proctor Reference Newbery and Proctor1984, Riswan and Kartawinata Reference Riswan and Kartawinata1991), documentation of the various formations in Kalimantan remains limited. This lack of focus results in a significant knowledge gap compared to more humid ecosystems like peatlands and dipterocarp forests. Redundant or inaccurate classification and estimation of kerangas, compounded by significant land use change in Indonesia (Gaveau et al. Reference Gaveau, Sloan, Molidena, Yaen, Sheil, Abram, Ancrenaz, Nasi, Quinones, Wielaard and Meijaard2014), further complicates reliable mapping and effective spatial planning. The ecological value and importance of kerangas forests hence remain relatively unacknowledged, and as a result, there is insufficient representation within protected areas or conservation management more broadly (Giesen et al. Reference Giesen, Wijedasa and Page2018; Trethowan et al. Reference Trethowan, Brambach, Cámara-Leret, Laumonier, Sheil, Ferry Slik, Webb, Murdjoko, Bastian, Kartawinata, Mansor, Mansur, Mirmanto, Nurtjahya, Permana, Rozak, Wilkie, Rahmad, Arifiani, Putu Gede, Damayanto, Puglisi, Asmarayani, Benu, Bramley, Dharma, Heatubun, Hidayat, Kuswandi, Mathews, MegawatiRustiami, Santika, Santoso, Setiawan, Triono, Wambrauw, Wanma, Hery Yanto, Siregar, Sadili, Dewi Atikah, Kintamani, Tjoa, Culmsee, Girmansyah, Gunawan, Pitopang, Utteridge, Morley, Schrader and Brearley2024).
Kerangas ecosystems face considerable threats from deforestation, land conversion, invasive plants, and recurrent fires, exacerbated by hydrological changes and increased nitrogen and sulphur deposition (Jambul et al. Reference Jambul, Limin, Ali and Slik2020; Tuah et al. Reference Tuah, Tennakoon, Jaafar and Sukri2020). These factors make kerangas particularly vulnerable, leading to potential transformations into open savannahs with sparse shrub and grass cover (Din et al. Reference Din, Metali and Sukri2015). Such changes result in severe biodiversity loss, threatening specialist organisms and complex ecological interactions (De Graaf et al. Reference De Graaf, Bobbink, Smits, Van Diggelen and Roelofs2009). The ongoing fragmentation heightens edge effects and the influence of surrounding land cover types (Piessens et al. Reference Piessens, Honnay, Devlaeminck and Hermy2006). Given the long recovery time for these forests and past challenges in re-establishing native vegetation (Riswan Reference Riswan1982), prioritising research and conservation strategies is crucial.
Here we revise the current distribution of kerangas across Kalimantan by spatially reassigning and reclassifying kerangas from available maps and spatial layers. We then focus on the kerangas-mosaic landscape in Central Kalimantan, using vegetation plot data to highlight the biotic and abiotic characteristics that differentiate between habitat types in the mosaic. Emphasising floristic composition and sub-habitat differences, our goal is to establish baseline information to facilitate further research and inform conservation strategies for this critical habitat type in Indonesia.
Study area
Our vegetation study was focused on the Mungku Baru Education and Research Forest (MBERF), in Central Kalimantan, spanning ∼ 50 km2 of forest area managed by a local university (Universitas Muhammadiyah Palangkaraya). MBERF lies within the Rungan-Kahayan River catchment area, north of the provincial capital, Palangka Raya (Figure 1). The landscape encompasses 4,729 km2, comprising largely forests without strict protection status, small forest areas under the social forestry scheme of Indonesia, and peat swamps under the Peatlands Moratorium. The landscape ranges between 30 and 85 m above sea level and is represented by peat swamps in the south to lowland mixed dipterocarp forests to the north. MBERF lies in the northern part of this landscape and features relatively undisturbed mosaic kerangas and swamp habitats, bordered by oil palm plantations, logging concessions, and artisanal gold mines. The site is watered by blackwater tributaries of the Rakumpit River. During the study (2016–2020), the region received rainfall ranging from 48 to 556 mm (BPS, 2024).
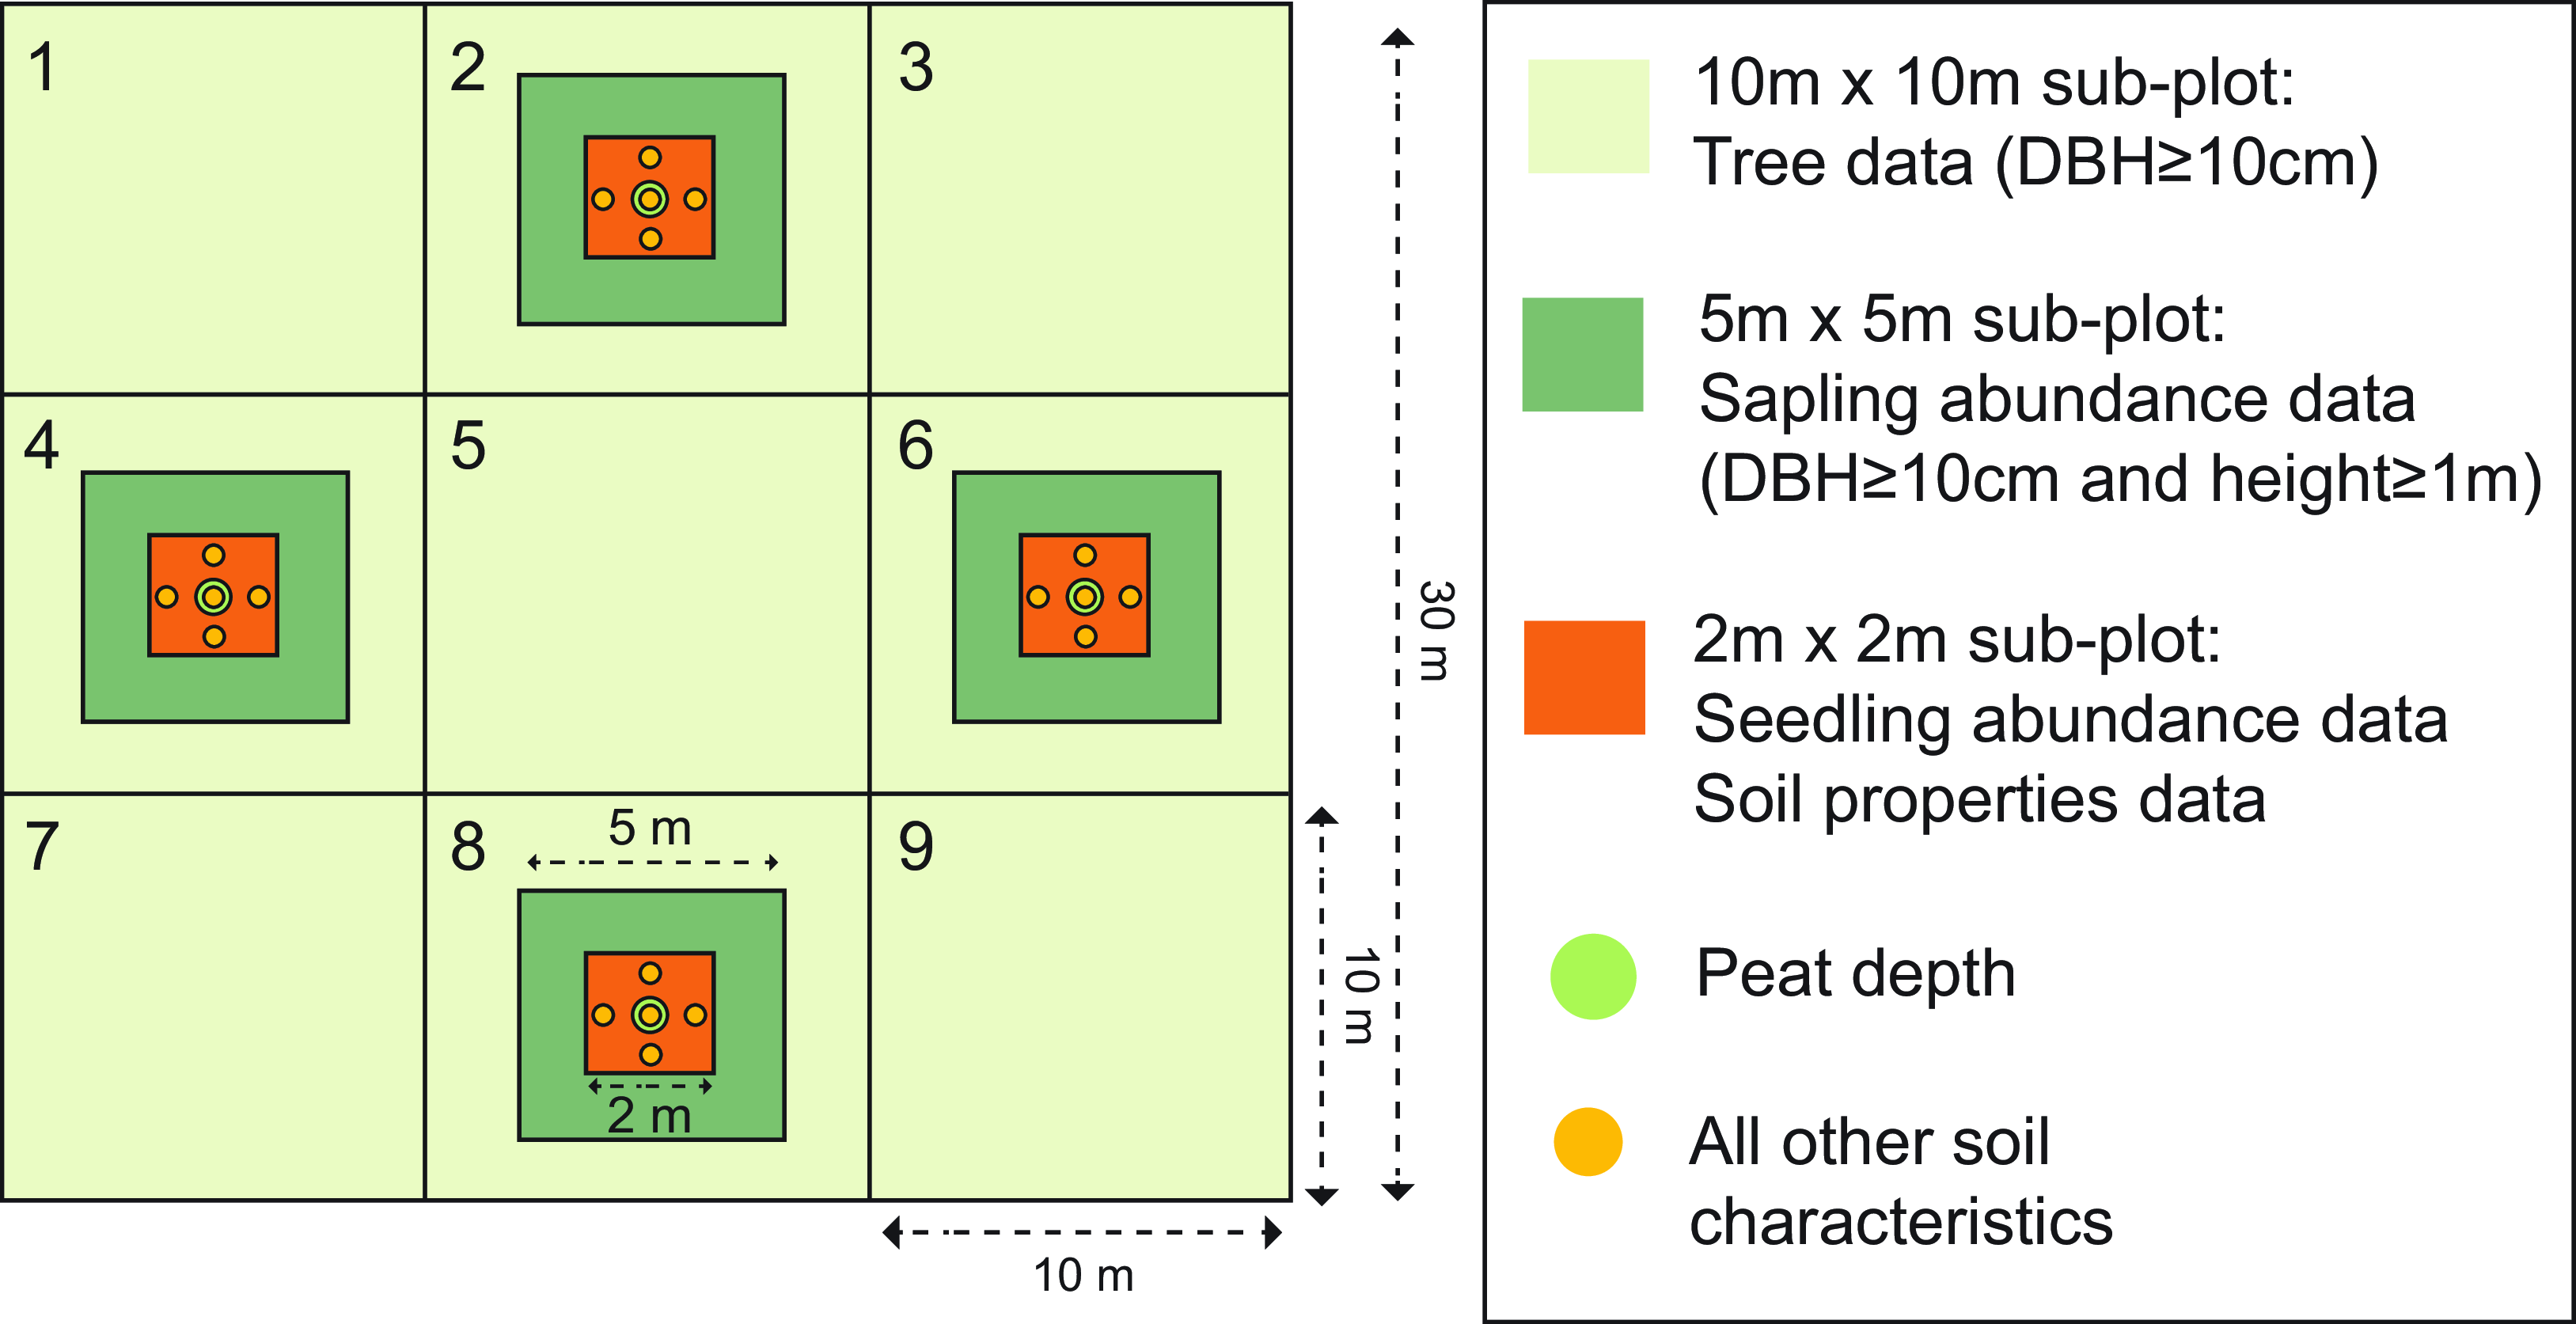
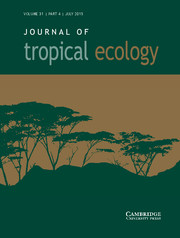
Figure 1. Vegetation plot structure and sampling methodology to record biotic and abiotic data.
Methods
Mapping kerangas across Indonesian Borneo
Previous estimates of the heath forest extent on Borneo are > 20 years old, and significant land-cover changes have occurred since (Sari et al. Reference Sari, Weston, Newnham and Volkova2023; Stibig et al. Reference Stibig, Achard, Carboni, Raši and Miettinen2014). Hence, we conducted spatial analysis using current and available forest cover and soil layers to provide an updated representation of the heath forest distribution across Indonesian Borneo. Additionally, we examined the representation of kerangas in protected areas by overlaying maps from the World Conservation Monitoring Centre with the forest cover data from Indonesia’s Ministry of Environment and Forestry (see Supplementary Table 1).
Mapping habitat types in the Rungan-Kahayan landscape
To create Land Cover and Habitat Classification maps for the Rungan-Kahayan landscape, we used cloud-free Landsat 8 OLI/TIRS imagery (July 2017) and ran the ‘Habitat-Types’ model via the semi-automatic classification QGIS plugin (Congedo Reference Congedo2021). A 654-band composite was produced with pre-processing atmospheric correction and pan-sharpening for the following pre-defined categories: stunted kerangas on white soil, kerangas on black soil, low pole, mixed swamp/riverine, secondary disturbed, scrub/grassland, clearing/forest gap, and bare soil/sand. To enhance thematic clarity in the post-classification process and reduce speckle noise, we applied a minimum patch threshold of 6, which was determined through iterative model testing and accuracy assessments. This helped remove isolated misclassified pixels and eliminate noise and minor features, ensuring that only ecologically relevant habitat patches were maintained, consistent with best practices for minimum mapping units (Jensen Reference Jensen2005). The threshold ensured that only habitat patches with a minimum contiguous area or pixel density above this value were retained. Additionally, a four-neighbour connectivity rule was applied to ensure accurate grouping of adjacent pixels, avoiding the merging of distinct habitat patches that are spatially adjacent but not functionally connected. This is a more conservative approach, particularly important in mapping heterogeneous landscapes (Turner et al. Reference Turner, Gardner and Golley2015).
We gathered habitat data from 1,064 ground-verification points along line transects spaced ∼ 100 m apart, covering different habitat types and transitions. At each point, we recorded habitat type (adapted for a kernagas mosaic from habitat differentiation in peatlands by Page et al. (Reference Page, Rieley, Shotyk and Weiss1999)), canopy height, canopy cover, soil type, topography, hydrology, and undergrowth within a 5-m radius (see Supplementary Table 2 for variable categorisation). Ground-truth validated habitats were rasterised to obtain pixel values. Finally, we performed a post-processing accuracy assessment by running a confusion matrix to validate the spatial layer against the ground-truth data (Rwanga and Ndambuki Reference Rwanga and Ndambuki2017).
Constructing vegetation plots
Between 2016 and 2020, we established 56 vegetation plots in MBERF using a stratified random sampling design. Plot locations were concentrated in the southwest region of MBERF due to inaccessibility to other parts and good representation of habitat types mapped in our initial habitat mapping (see Supplementary Table 5). Plots were 30 ×30 m in size and contained nested subplots (Figure 1). Trees ≥ 10 cm diameter at breast height (DBH = 1.3 m above the ground) were identified, measured, and tagged, and maximum tree height was recorded using a clinometer in all 10 × 10 m subplots. Within four 5 × 5 m subplots, we recorded the abundance of tree saplings (trees <10 cm DBH, ≥ 1 m height), orchids, lianas, pitcher plants, pandans, and palms, as well as the percentage cover of tussocks, ferns, grass, and other ground vegetation. For seedling abundance and soil properties, we created nested plots of 2 × 2 m to measure soil properties such as peat depth (cm), soil moisture (%), soil pH, and slope. For a detailed description of equipment and methods used for soil sampling, see Supplementary Table 3.
Data analysis
For all analyses below, we consider three main habitat types based on our habitat analysis. We combine black and white soil kerangas and refer to it as ‘kerangas,’ aggregate stream edge and swamp habitats as ‘mixed swamp,’ and retain low pole forest.
Tree species were identified in the local language (Bahasa Dayak Ngaju) and simultaneously assigned their corresponding Latin names by a field botanist. The compiled species list was subsequently validated by a senior botanist and cross-checked against the rWCVP package (Brown et al. Reference Brown, Walker, Black, Govaerts, Ondo, Turner and Nic Lughadha2023), ensuring accuracy of the species’ binomial names.
Stem density (richness)
To reliably compare between habitat subtypes in the broad-scale habitat classification, we standardised the number of species per square kilometre using the formula
 $$Stem\,density\,per\,species\, = \,({S_{ij}}/\Sigma \,{S_j})/{\rm{k}}{{\rm{m}}^{\rm{2}}}$$
 $$Total\,stem\,density/habitat\, = \,\Sigma \,{S_{j/}}{\rm{k}}{{\rm{m}}^{\rm{2}}}$$
where Sij is the number of stems of species i in habitat j and Sj is the total number of species in habitat j.
Cluster analysis and ordination
To evaluate the variation in tree species composition between the three habitat types, we conducted a cluster analysis. We calculated pairwise Bray-Curtis dissimilarity coefficients (ranging from 0 to 1, with higher values indicating greater dissimilarity) to capture differences in plant community composition across plots within and between habitat types. A dendrogram was constructed to visualise the dissimilarity matrix, arranging plots based on their similarity in tree species composition. To determine whether dissimilarity in tree species composition was greater between different habitats than within them, we conducted an Analysis of Similarity (ANOSIM) test (Clarke and Green Reference Clarke and Green1988) on the community data using the ‘vegan’ package in R (Oksanen et al. Reference Oksanen, Simpson, Blanchet, Kindt, Legendre, Minchin, O’Hara, Solymos, Stevens, Szoecs, Wagner, Barbour, Bedward, Bolker, Borcard, Carvalho, Chirico, De Caceres, Durand, Evangelista, FitzJohn, Friendly, Furneaux, Hannigan, Hill, Lahti, McGlinn, Ouellette, Ribeiro Cunha, Smith, Stier, Ter Braak and Weedon2024).
To test which habitat predictors best explain species composition between habitat types, we conducted nonmetric multidimensional scaling (NMDS) on tree species as a function of peat depth, elevation, soil moisture, soil pH, and biomass. Above-ground biomass was calculated using DBH and tree height for each plot in the study area using the ‘BIOMASS’ package in R (Réjou-Méchain et al. Reference Réjou-Méchain, Tanguy, Piponiot, Chave and Hérault2017).
Diversity
Tree species diversity for habitat type was calculated using the iNEXT package in R (Chao et al. Reference Chao, Gotelli, Hsieh, Sander, Ma, Colwell and Ellison2014) for all tree species ≥ 10 cm DBH. We calculated diversity using sample-based extrapolation with diversity orders q1, q2, and q3, representing Hill numbers, and 100 bootstraps. We used 84% confidence intervals (MacGregor-Fors and Payton Reference MacGregor-Fors and Payton2013), as they offer practical advantages for ecological inference. Specifically, when comparing group means, non-overlapping 84% CIs approximate a statistical significance level of p < 0.05, making them more intuitive for visual assessment of meaningful differences. Data were extrapolated to a common sample size of 100 plots in each comparison.
Structural differences
Multinomial logistic regression was performed using the ‘multinom’ function from the ‘nnet’ package in R (Venables and Ripley Reference Venables and Ripley2002) to analyse the relationship between tree height and DBH (independent variable) with the three main habitat types (dependent variables). Basal area was excluded from the model after testing for collinearity.
All spatial analyses were performed using QGIS v3.6, and quantitative analyses were conducted in Rv3.3.
Results
Mapping kerangas across Indonesian Borneo
We identified that kerangas forests cover approximately 16,586 km2 across Indonesian Borneo. Kalimantan has 35,849 km2 of strictly protected forests in national parks and wildlife reserves (IUCN categories Ia, Ib, and II) and 82,396 km2 of other protected areas (IUCN categories III–VI), of which heath forests constitute only 2.4% and 21.9%, respectively. Overall, only 3.7% of kerangas across Kalimantan are within strict protection zones (Figure 2). The largest extent is in the Central Kalimantan province, comprising 76.8% of Indonesian Borneo’s heath forests, albeit fragmented amongst six protected areas (Figure 2; Supplementary Table 4).
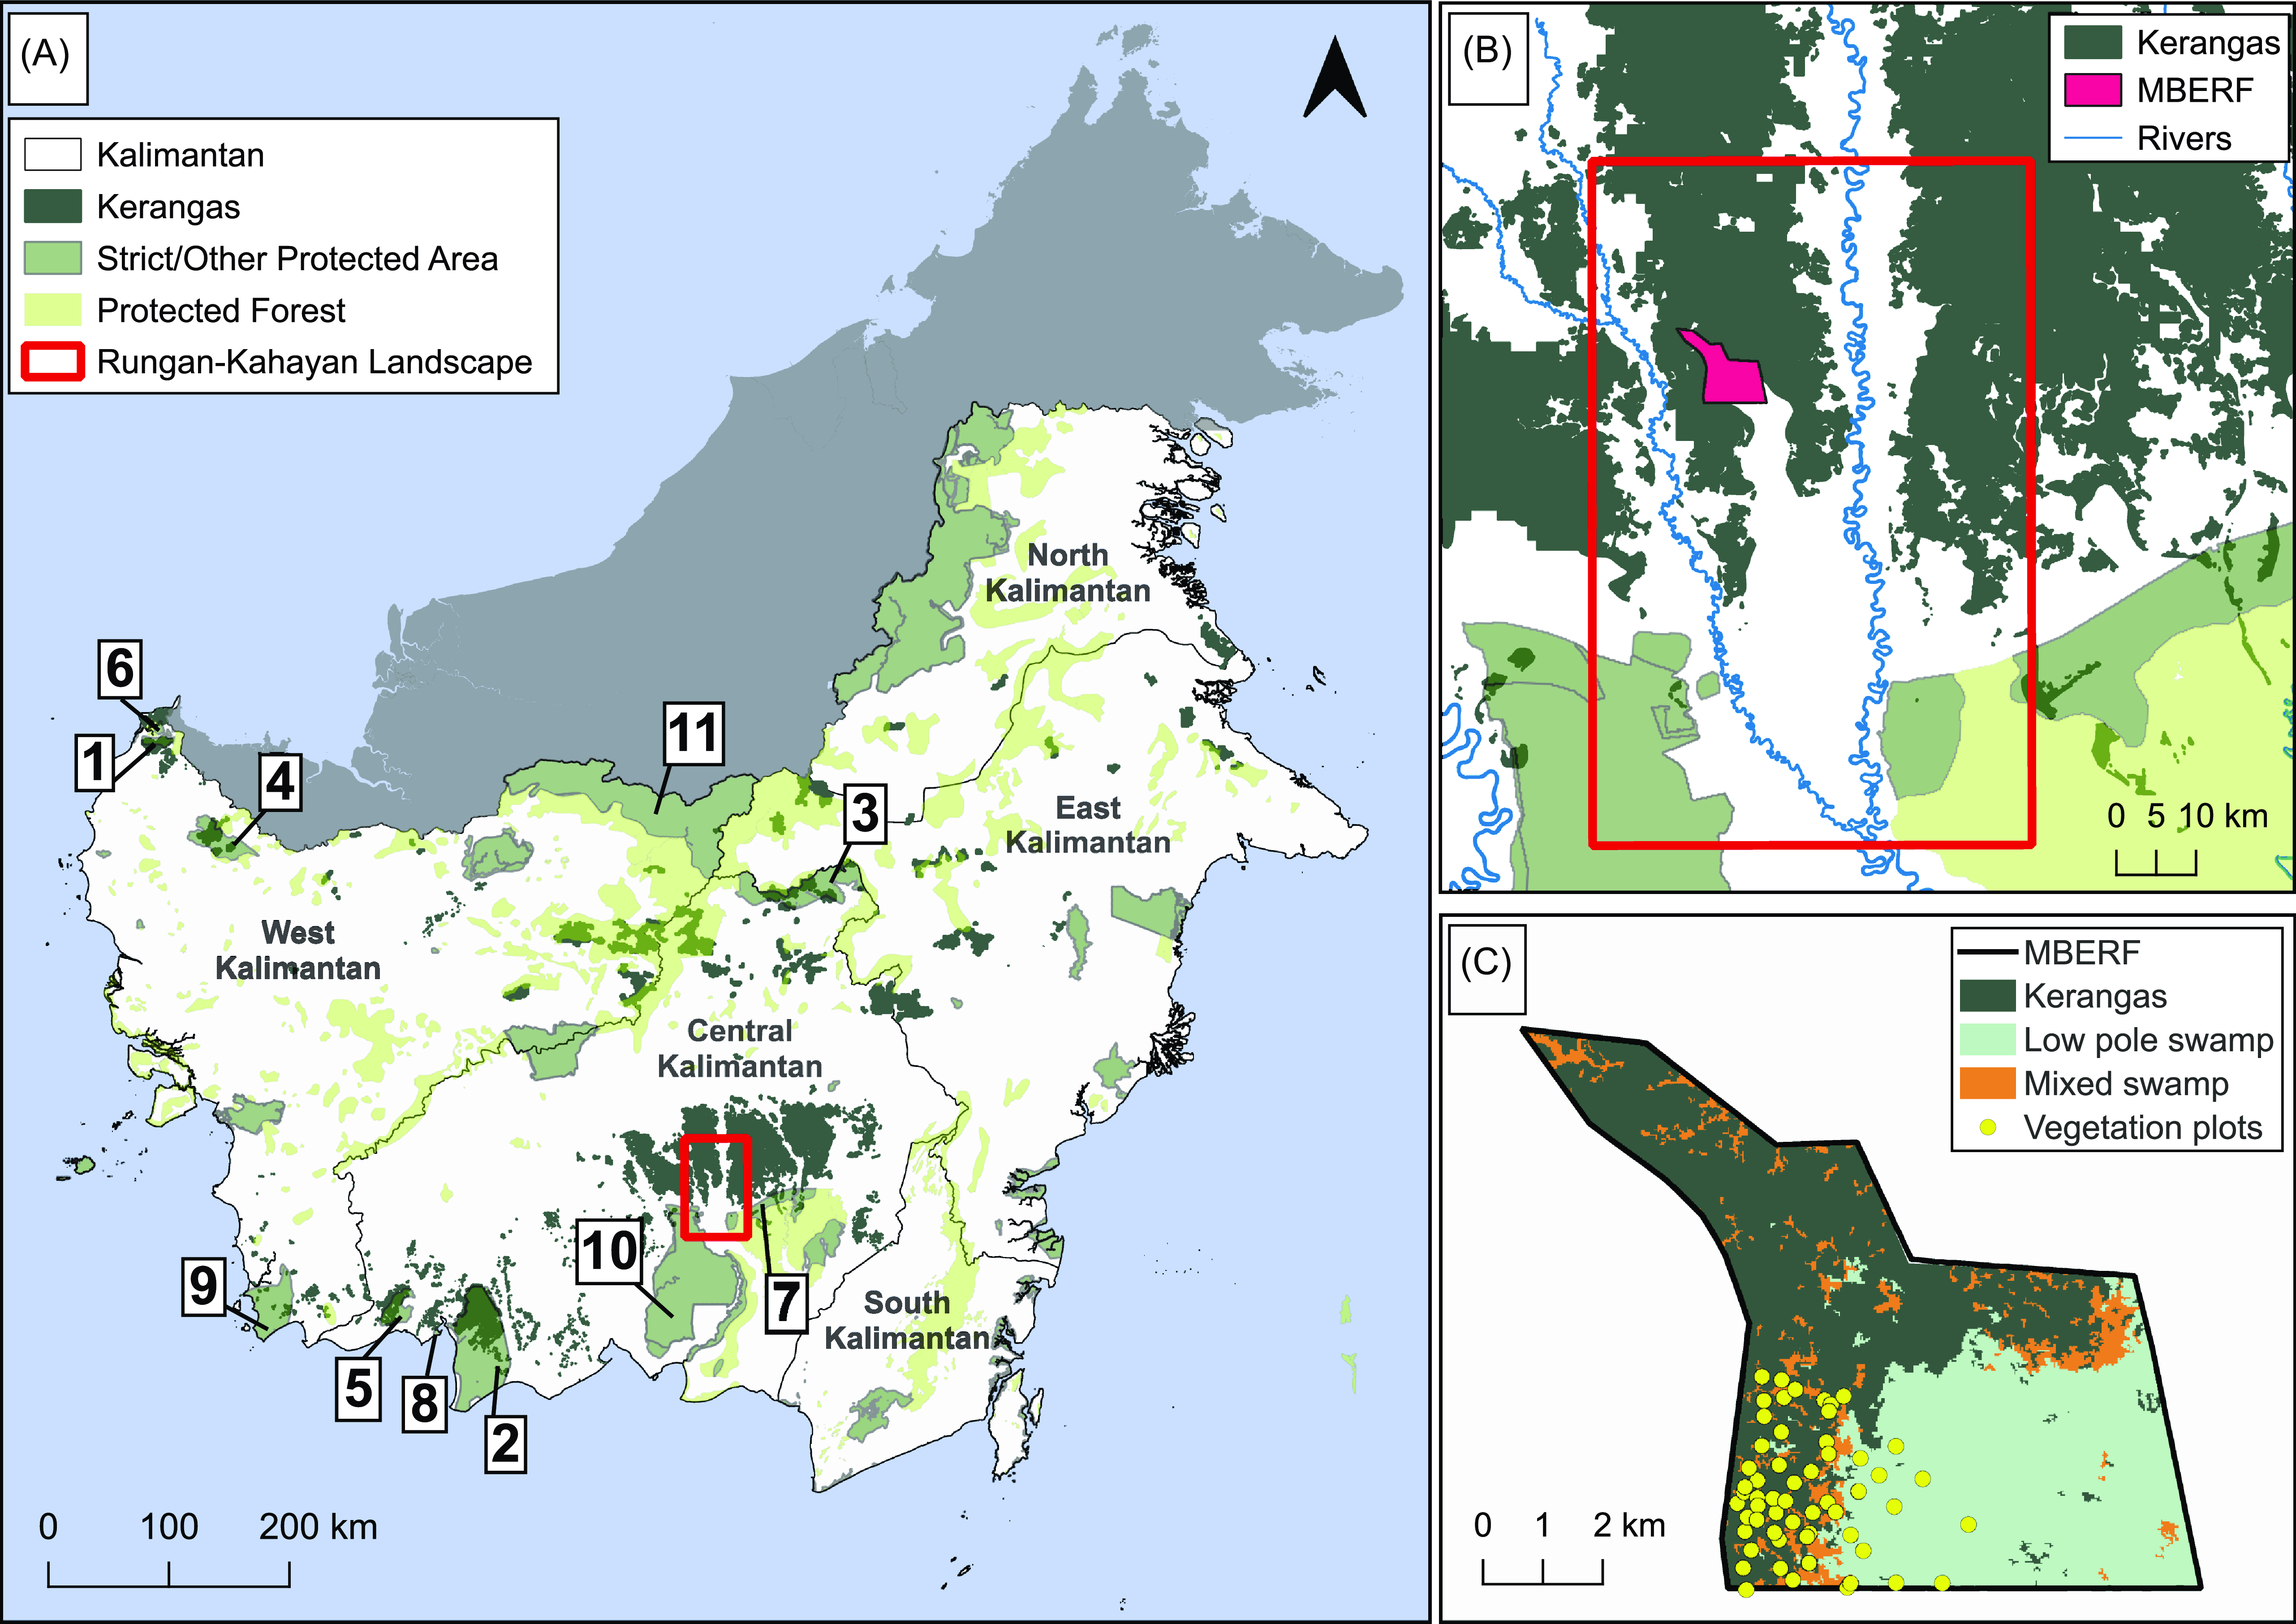
Figure 2. A. Distribution of kerangas in Kalimantan, Indonesia, based on available spatial data. Numbers 1–11 correspond to the list of protected areas in Supplementary Table 4. B. Distribution of kerangas within and surrounding the Rungan-Kahayan landscape in Central Kalimantan. C. Study site (MBERF) indicating habitat mosaic with kerangas cover.
Mapping habitat types in the Rungan-Kahayan landscape
The habitat model accuracy assessment confirmed that habitat classification from satellite imagery was moderately reliable across the landscape (Κ = 0.5). The classification performed well compared to randomly assigning values, although the low kappa value may affect confidence in spatial conclusions, especially for certain habitat types (see Supplementary Table 5 for percentage cover and accuracy achieved for each classified habitat type). The model discriminated nine habitat types with an overall classification accuracy of 82% and a producer’s accuracy for kerangas (82%), low pole swamp (73%), and mixed swamps (48%). This allowed us to assign the percentage coverage of each habitat type across the landscape and within our study area. The most dominant habitat types in both our study site and the larger landscape were kerangas (33.9% in MBERF and 25.7% in the landscape).
Vegetation plots
We recorded 3,950 trees across 56 vegetation plots, representing 176 distinct taxa (Figure 2). Only trees identified to at least the genus and/or species level were included in the analysis (N = 102); unidentified individuals were excluded. Where multiple individuals within the same genus showed clear morphological differences but could not be confidently assigned to a specific species, they were treated as distinct species-level taxa for the purposes of analysis. Based on the abiotic and biotic data obtained from the forest plots, we were able to strengthen habitat differentiation through spatial analyses and confirm distinguishable features of the main habitat types. The presence and distribution of these habitats are determined by soil characteristics, hydrological regimes, and surface topography, as reported below. They represent a forest continuum with variations, gradients, and transitional habitats. For a detailed description of each of the main dominant habitat subtypes, refer to Supplementary Text 1.
Stem density
Apart from certain genera that are exclusive to or highly dominant to certain habitat types, such as Gymnostoma, Agathis, Endospermum, and Gluta in kerangas, Combretocarups and Dactylocladus in low pole, and Cratoxylum, Tetractomia, Litsea, and Nephelium in mixed swamp habitats, most species were common taxa across all habitat types, although differing in their relative stem densities. However, the most common taxa across the study site, found in every habitat type, were Myrtaceae (Syzygium sp.), Calophyllaceae (Calophyllum hosei), and Dipterocarpus borneensis. (See Supplementary Table 6 for a list of species with stem densities per habitat.)
Cluster analysis and ordination
Cluster analysis using ANOSIM tests revealed that tree species dissimilarity was significantly greater between the three habitat classes than within them (R = 0.44, p < 0.05). This suggests that the three habitat types exhibit clear differences in tree species composition, despite constituting a mosaic of interspersed habitats (Figure 3).
Figure 3. Dendrogram showing clusters of tree species based on the Bray-Curtis dissimilarity index between three main habitat classifications.
The NMDS analysis in two dimensions yielded a stress value of 0.22, indicating a moderate fit for the data (Figure 4). The ordination revealed key environmental gradients that correlated with tree community structure in the forest mosaic. Peat depth had the most influence on community composition, followed by elevation and biomass. Specifically, average peat depth correlated with tree species in low pole and mixed swamp, indicating these two habitats have a deeper peat layer relative to kerangas. Conversely, more elevated (∼ 60 m asl) areas support species typical of kerangas habitat (see Supplementary Text 1). Soil pH influenced species composition in mixed swamps the most, where plots in this habitat type were characterised by higher pH values. This is given by a significant negative correlation between peat depth and soil pH (r = −0.33; p = 0.01). As expected, the effect of average peat depth on differentiating habitat types based on species composition was opposite to that of elevation.
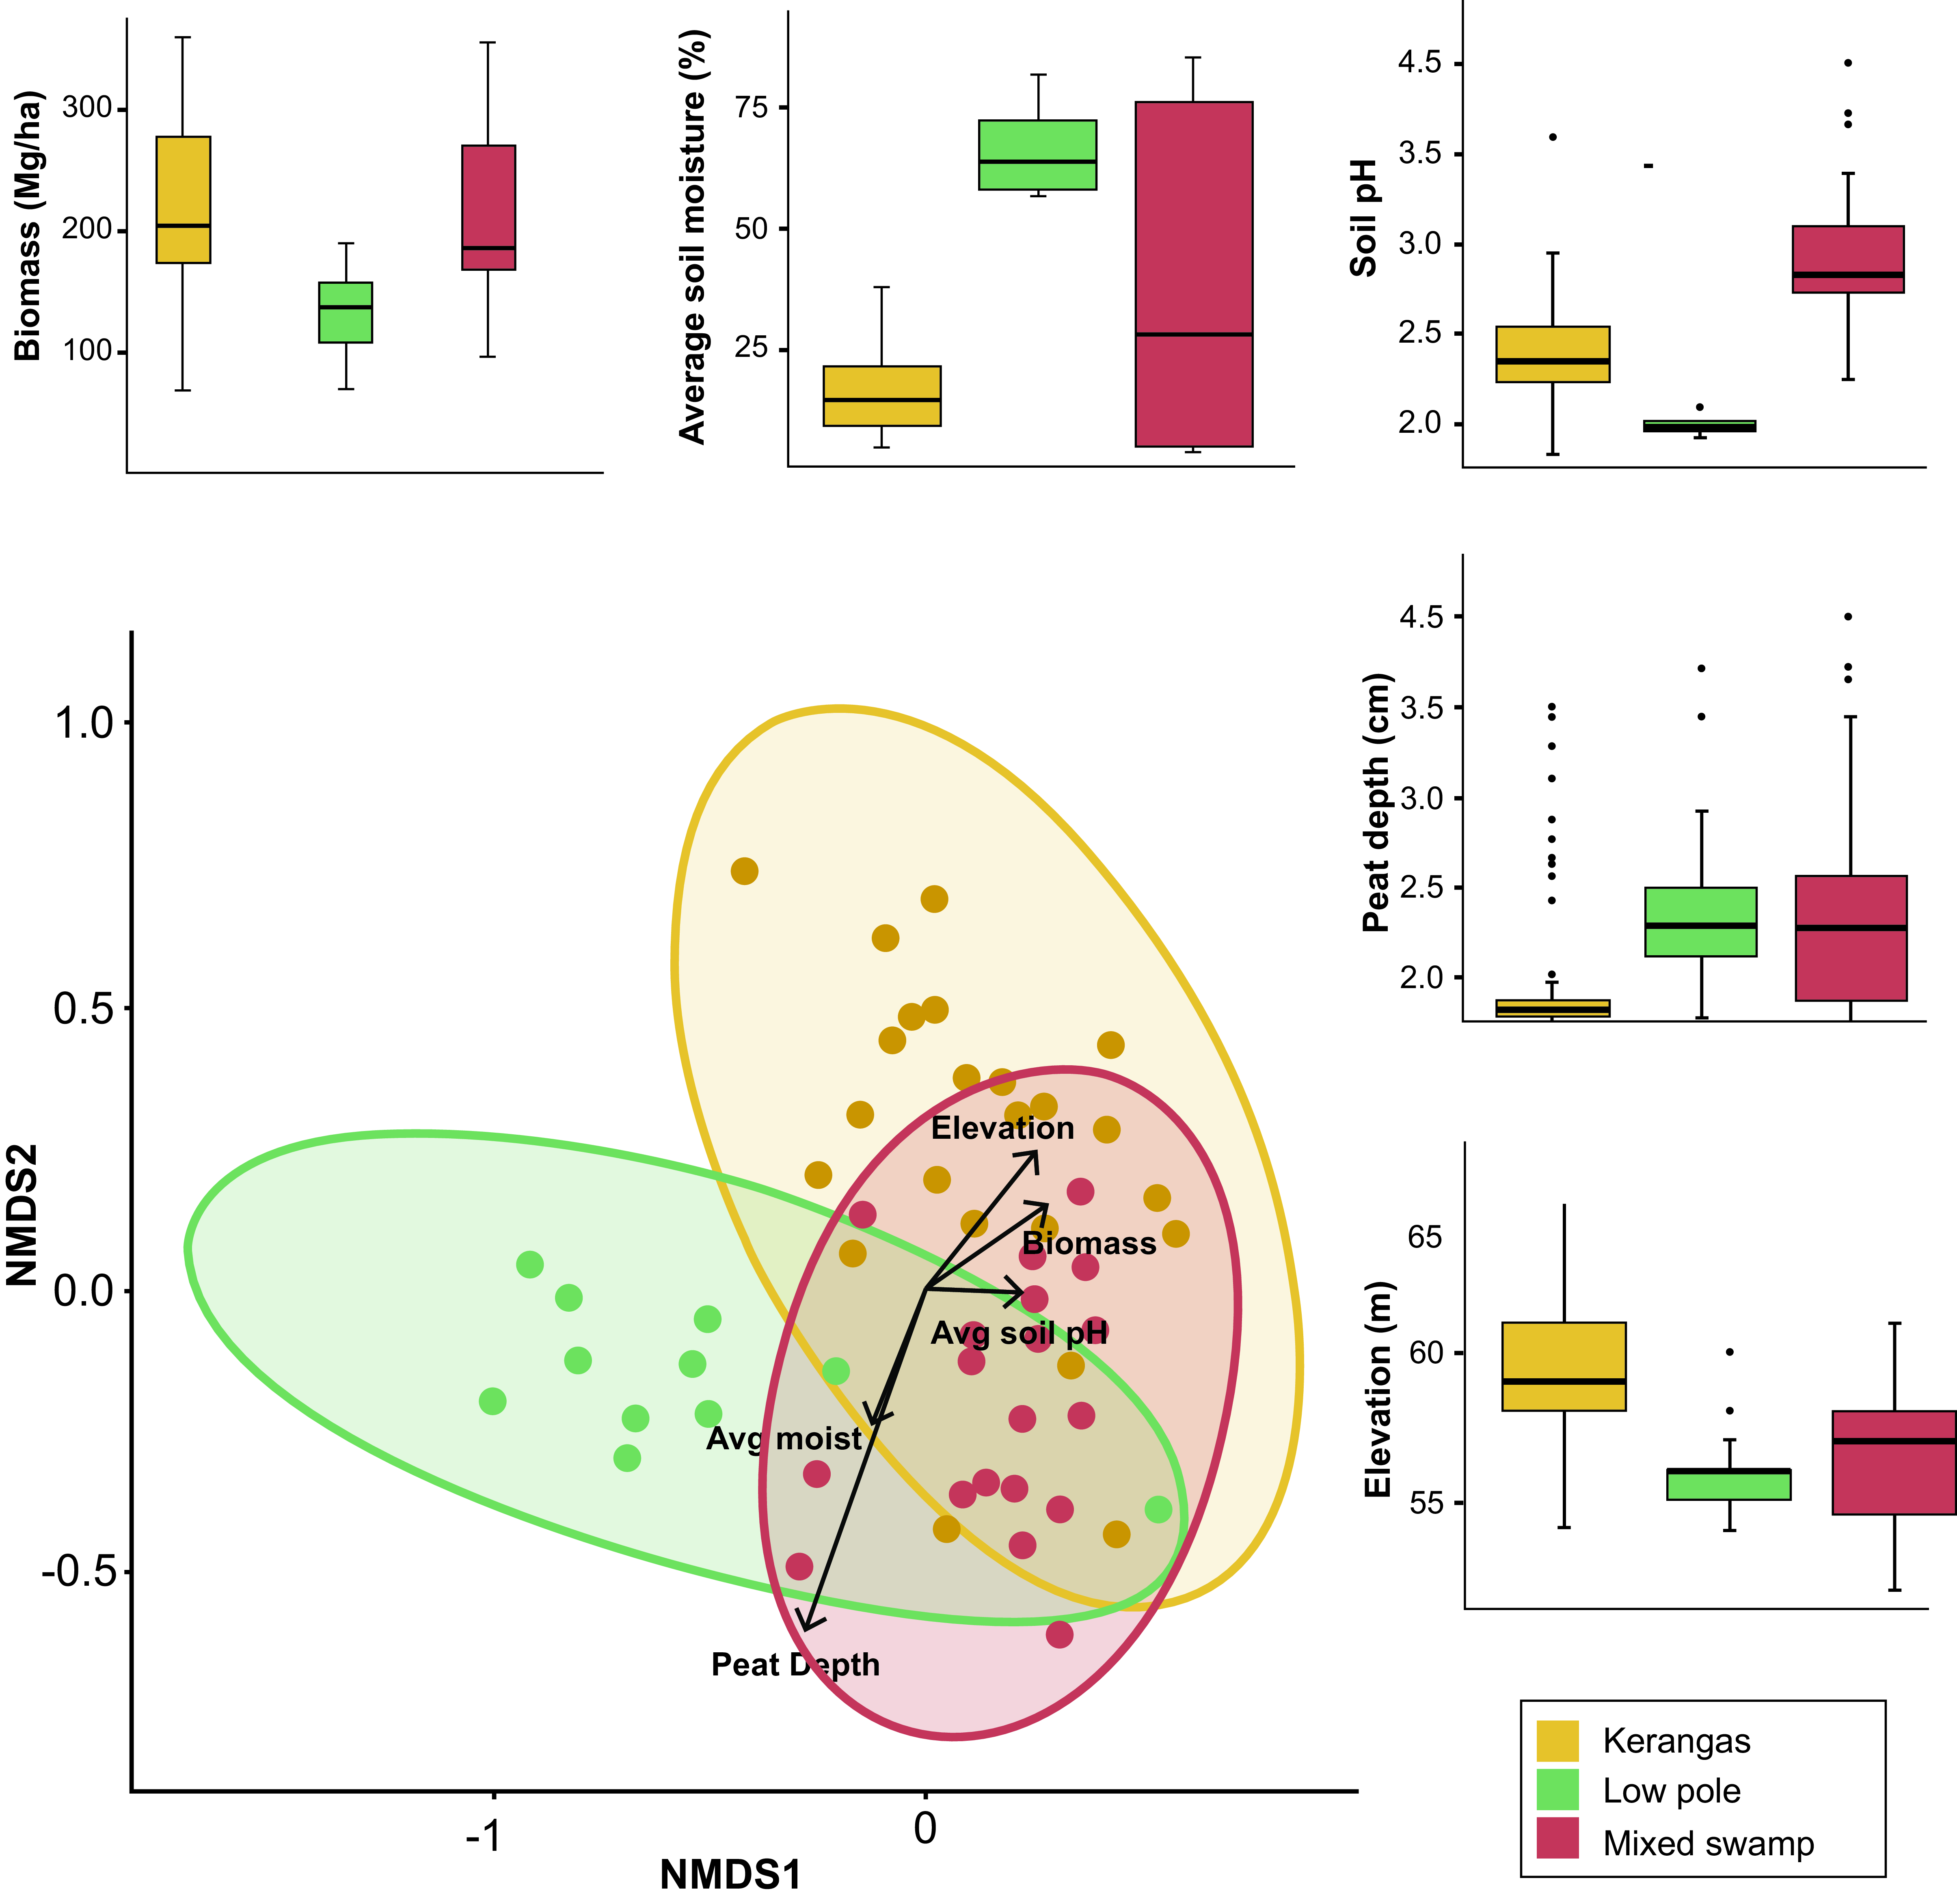
Figure 4. A. Nonmetric multidimensional scaling (NMDS) of tree species in each habitat type. The vectors (arrows) indicate the habitat predictors influencing tree species diversity. The length and angle of the vectors indicate the strength and direction of effect on the three habitat types. Box plots indicating the mean, standard deviation, and outliers for biomass, soil moisture, soil pH, peat depth, and elevation across each habitat type.
Diversity
The extrapolated asymptotic diversity profile indicates that there is distinct separation in tree species richness between habitat types, given by the absence of any overlap of the 84% confidence intervals for each habitat (Figure 5). Overall, mixed swamp has the highest diversity across all q-values, suggesting a more even distribution of species within the habitat. Low pole habitat has a remarkably lower diversity of tree species compared to the other two habitats, indicating dominance of certain species. These results strengthen our cluster analysis and categorisation of habitats into three main habitat types in the mosaic.
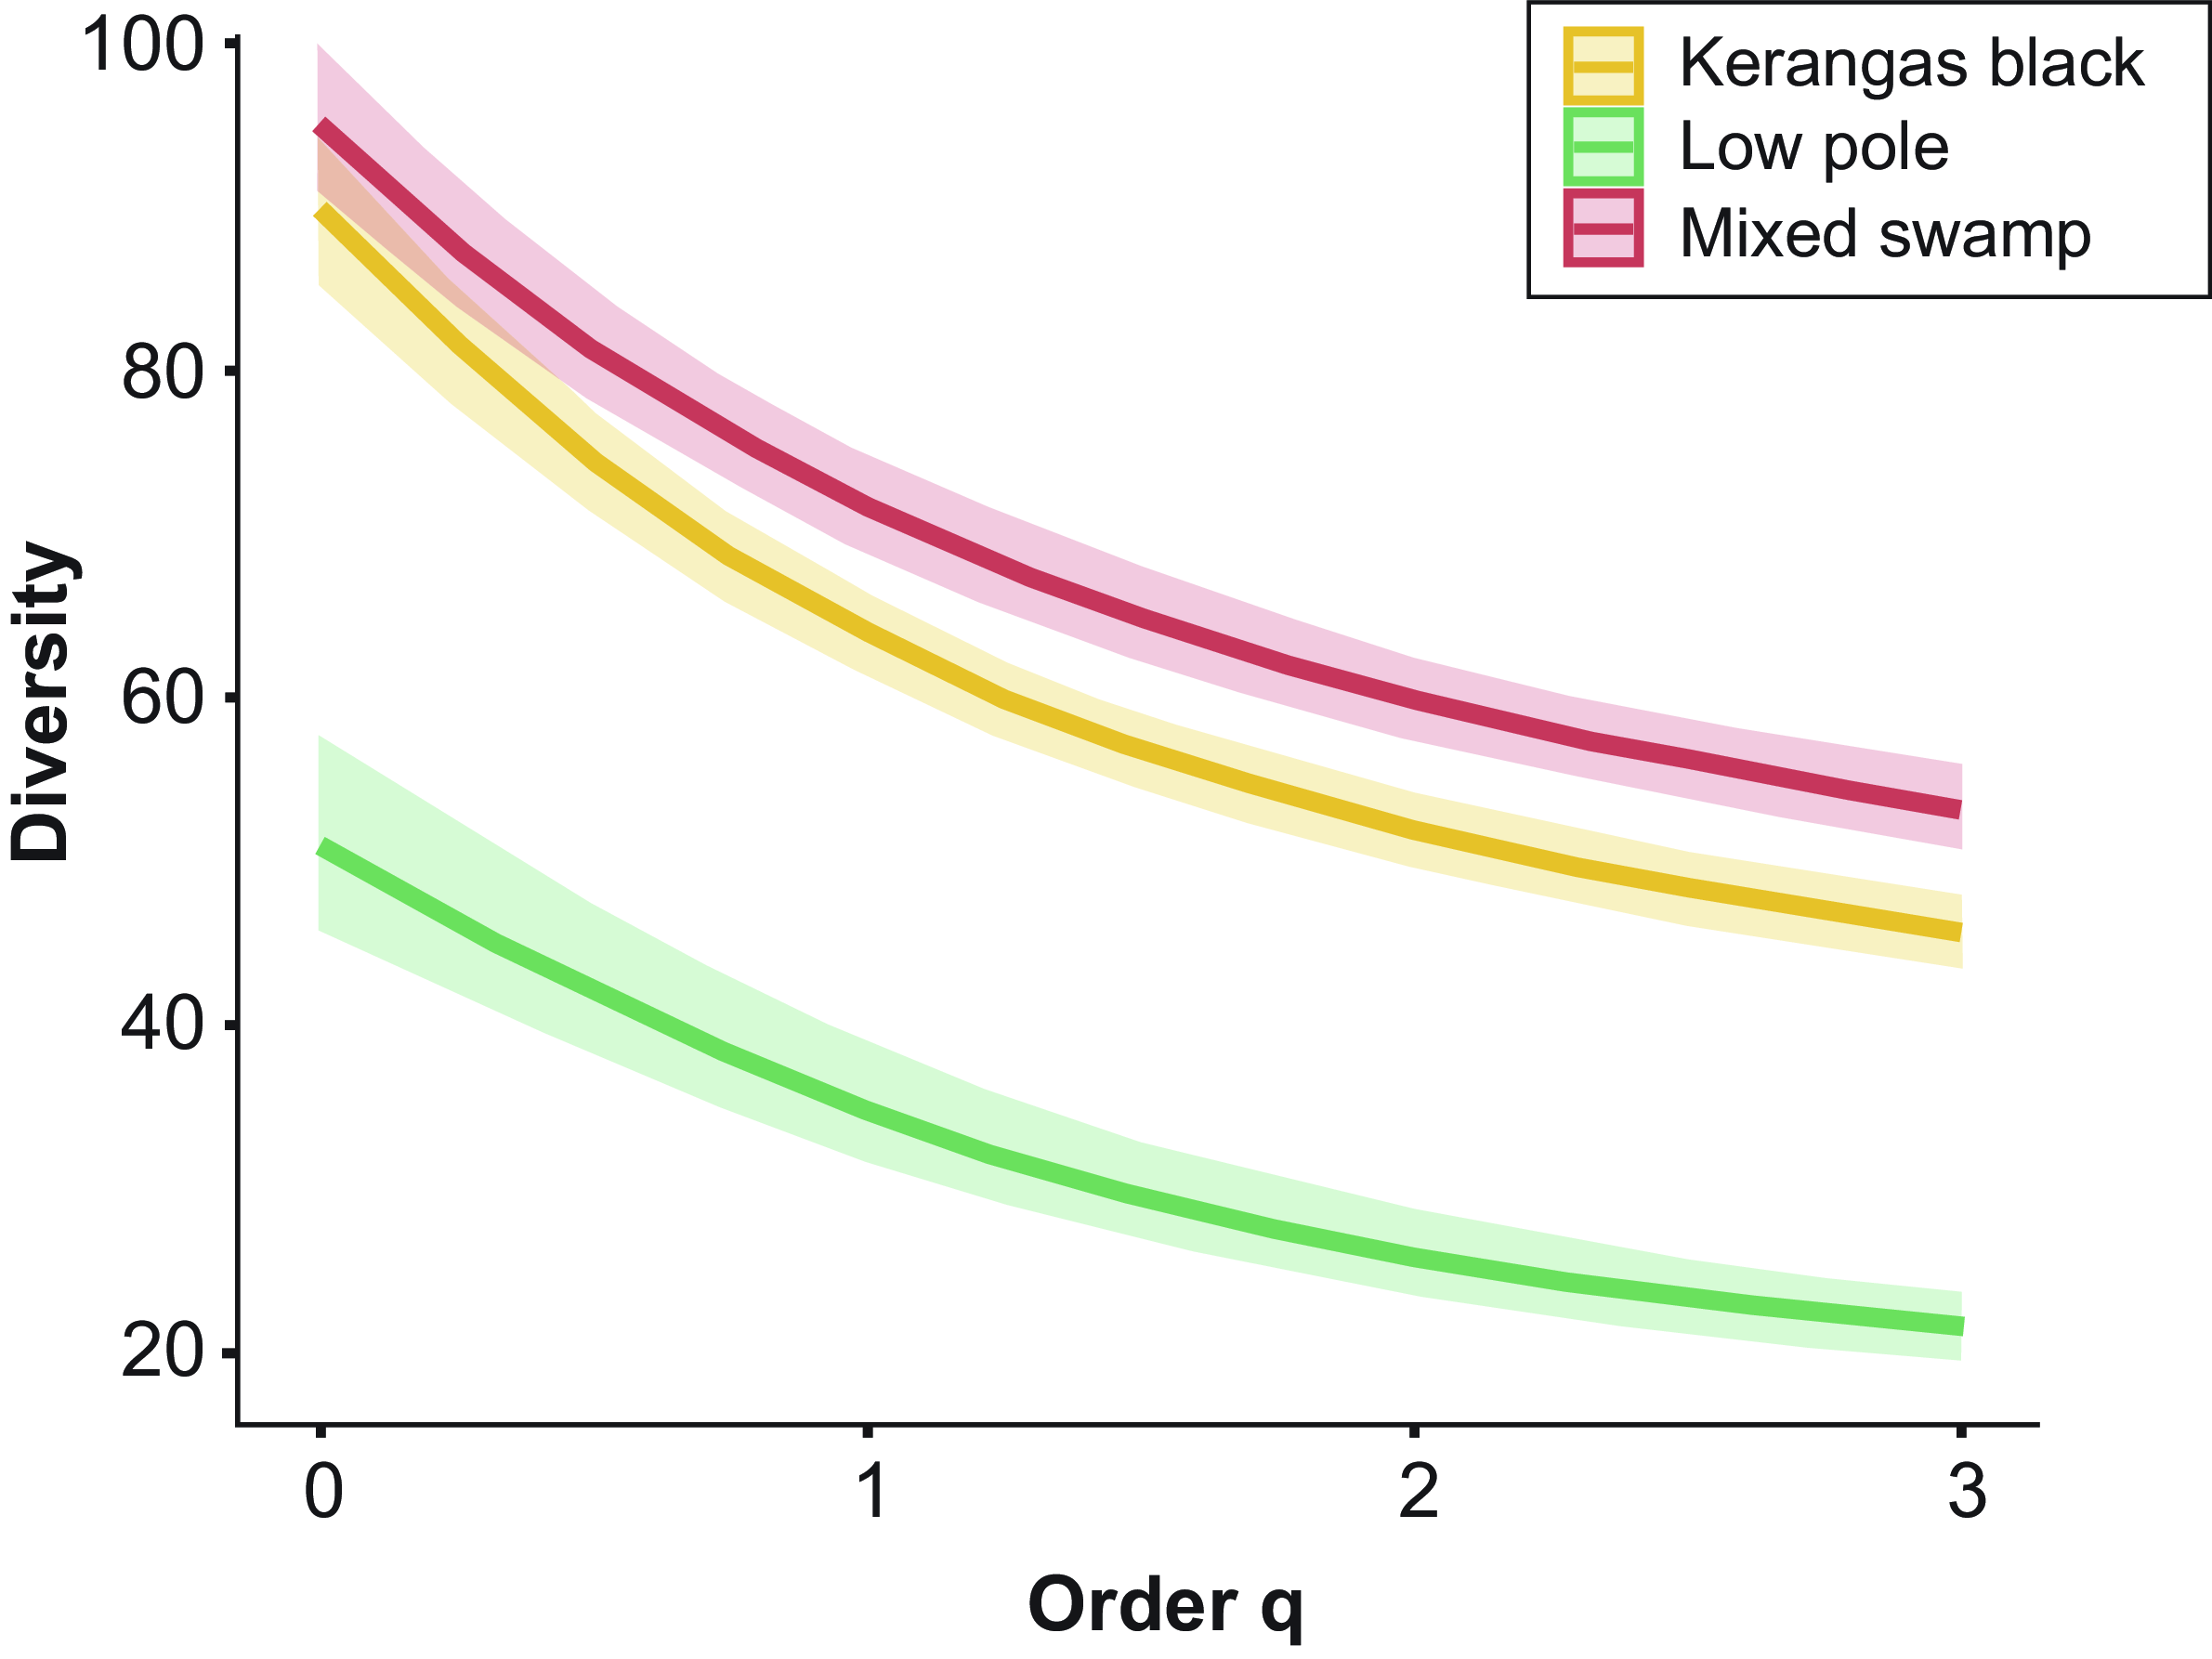
Figure 5. Diversity of three different habitat assemblages as a function of the diversity order (q), where q1, q2, and q3 represent Hill numbers, shaded areas denote 84% CI. The table presents the values of diversity and evenness of each habitat type.
Structural differences
Multinomial logistic regression indicated significant trends between the three main habitat types (Figure 6). For a one-unit increase in DBH, the odds of a tree in a low pole and mixed swamp decrease by 4.1%. That is, larger girth trees are significantly more likely to be in kerangas, followed by mixed swamp, and less likely to be in low pole habitat (DBH: Kerangas > mixed swamp > low pole).
With respect to tree height, the odds of taller trees in low pole decrease by 4.4% compared to those in kerangas. However, comparing mixed swamp to kerangas, taller trees are 2.1% more likely to be present in mixed swamp as compared to kerangas (tree height: Mixed swamp > kerangas > low pole).
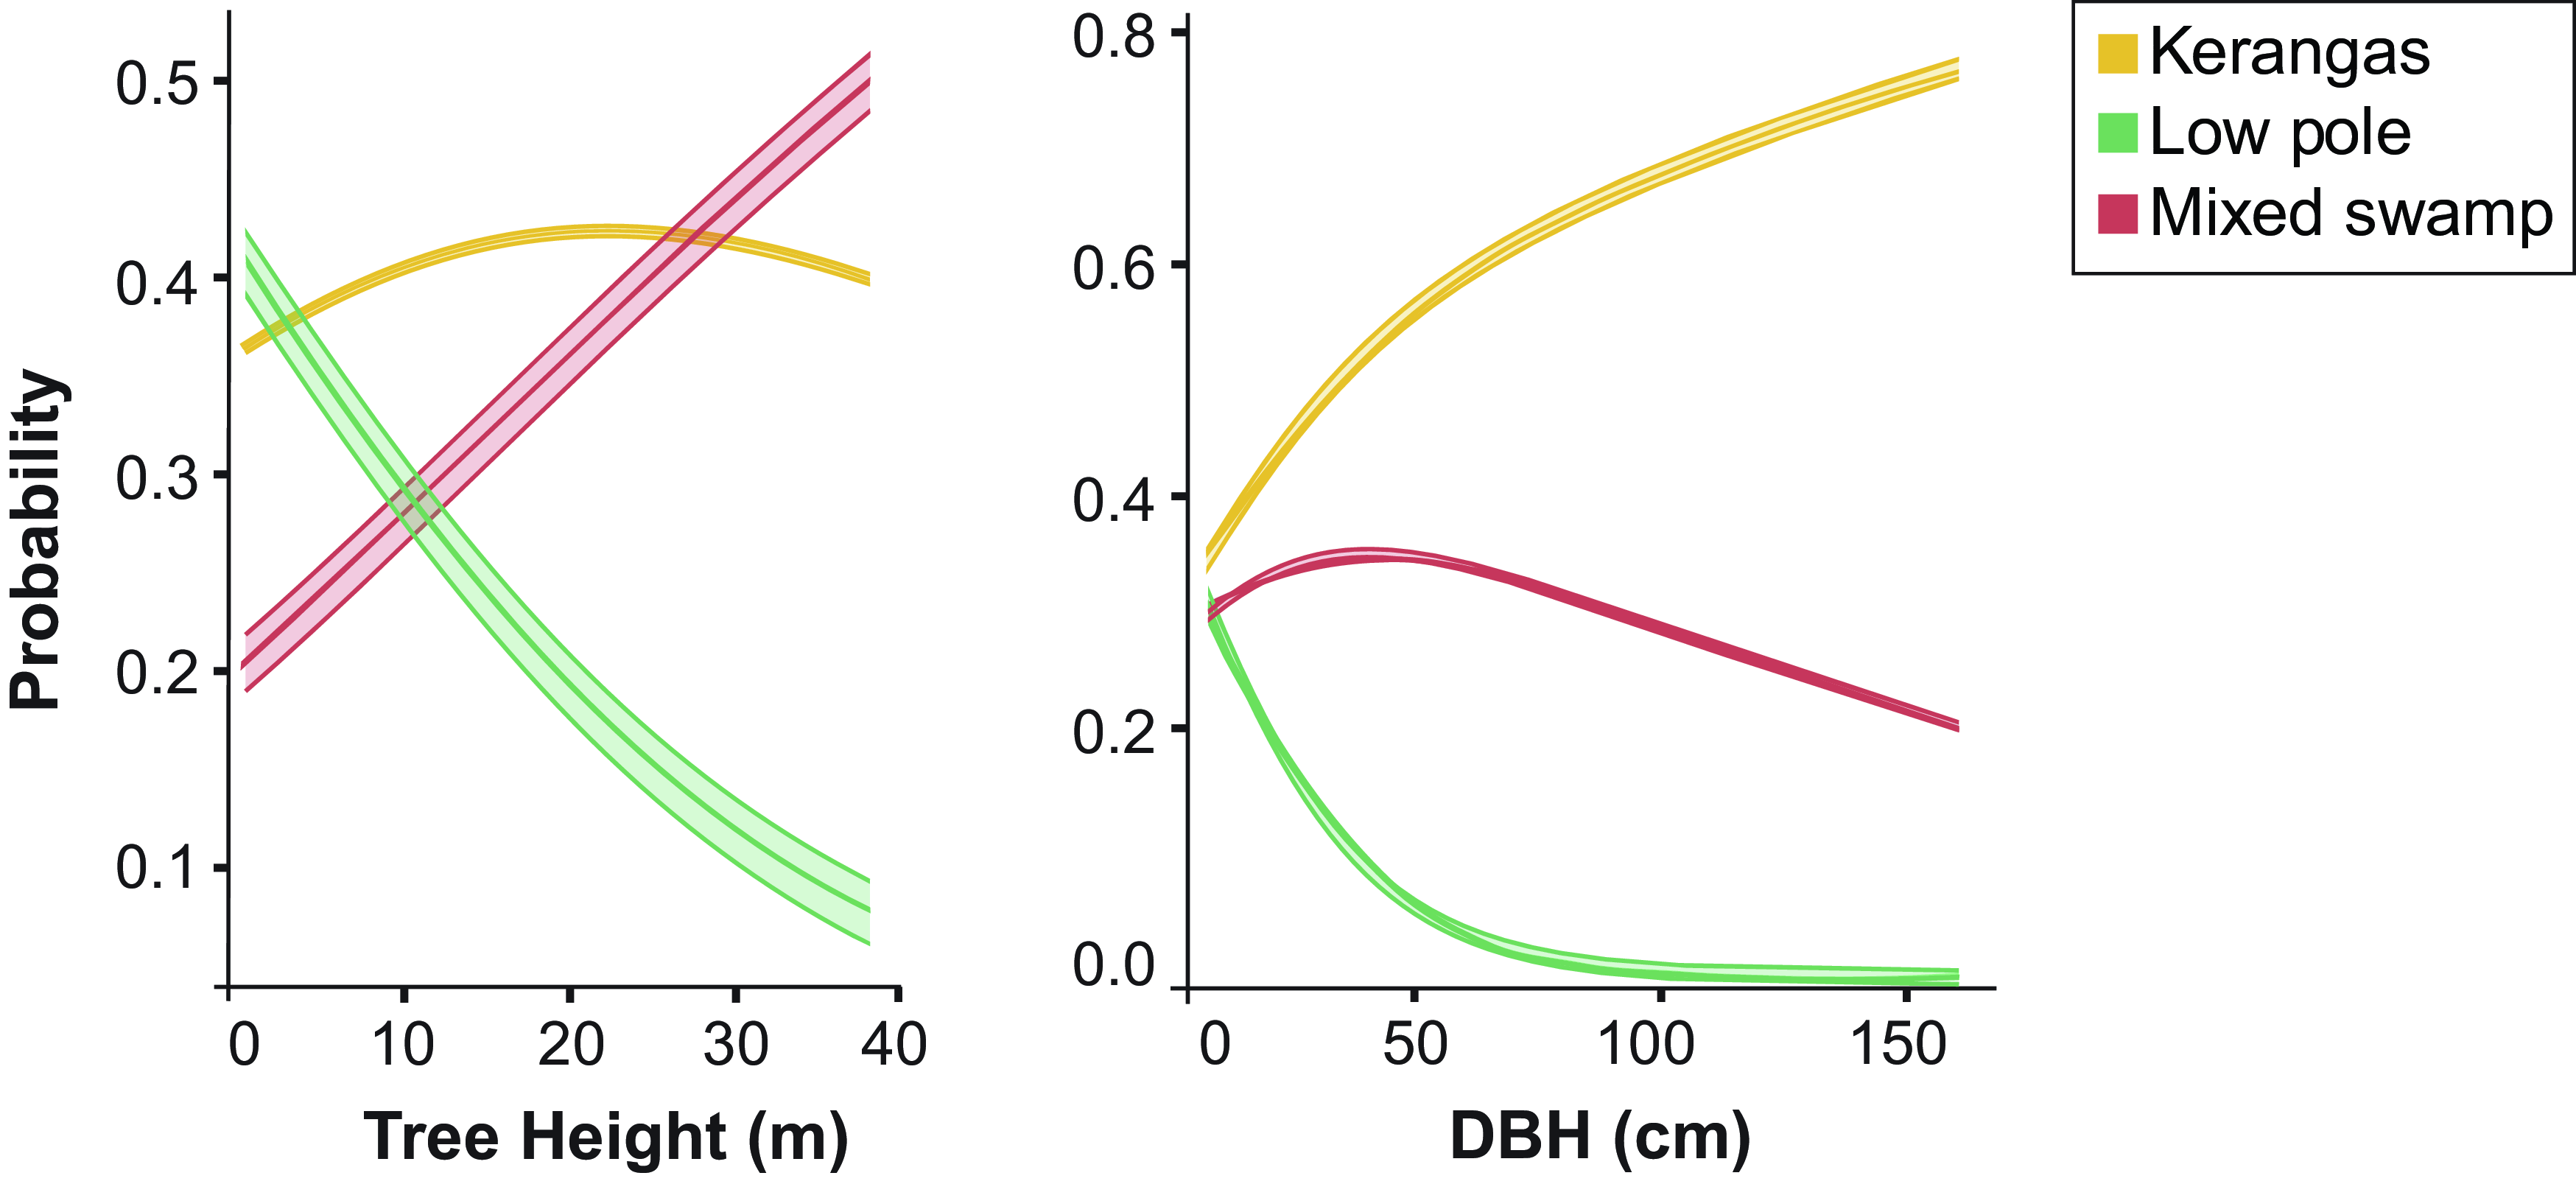
Figure 6. Predicted probabilities plotted against DBH, tree height, and peat depth for three habitat types.
Discussion
Our updated estimate of kerangas forest coverage in Kalimantan, of ∼ 16,586 km2, is significantly lower than previous estimates of 24,750 km2 (MacKinnon Reference MacKinnon1996). This suggests a reduction in kerangas forest cover over the past two decades, though historical inconsistencies in differentiating kerangas from other forest types—such as lowland dipterocarp or peat-swamp forests—may explain the higher estimates in the past. Nevertheless, the extensive distribution of kerangas forests within Kalimantan highlights their potential importance for biodiversity conservation.
Through our analysis of remote sensing and tree plot data, we identified a complex and extensive habitat mosaic within Central Kalimantan’s lowland heath forests, whereby flooding is mediated by major rivers and topography, resulting in a mosaic of low pole swamp and kerangas forests, interspersed with mixed swamps. Rather than being seen as a homogeneous forest ecosystem, these heath forests are in fact highly transitional, comprising a mix of plant communities on peat and sandy soils.
Our findings suggest that the kerangas-dominated landscape consists of multiple habitats influenced by variations in soil, water, and topography. The mixed swamp habitats share species with habitats in proximity, reflecting a pattern similar to Amazonian freshwater swamps, where many species inhabit neighbouring well-drained areas (Draper et al. Reference Draper, Honorio Coronado, Roucoux, Lawson, A. Pitman, A. Fine, Phillips, Torres Montenegro, Valderrama Sandoval, Mesones, García-Villacorta, Arévalo and Baker2018, Reference Draper, Asner, Honorio Coronado, Baker, García-Villacorta, Pitman, Fine, Phillips, Zárate Gómez, Amasifuén Guerra, Flores Arévalo, Vásquez Martínez, Brienen, Monteagudo-Mendoza, Torres Montenegro, Valderrama Sandoval, Roucoux, Ramírez Arévalo, Mesones Acuy, Del Aguila Pasquel, Tagle Casapia, Flores Llampazo, Corrales Medina, Reyna Huaymacari and Baraloto2019; Pitman et al. Reference Pitman, Andino, Aulestia, Cerón, Neill, Palacios, Rivas-Torres, Silman and Terborgh2014). The observed habitat infidelity suggests a neutrality in species distribution, with minimal dispersal limitations and relatively uniform conditions across adjacent habitats (Cannon and Leighton Reference Cannon and Leighton2004).
In Borneo’s heath forests, large-scale variations in floral composition are often determined by topography, particularly in relation to hill leaching gradients (Austin et al. Reference Austin, Ashton and Greig-Smith1972). Topographic variables such as elevation and slope affect tree species diversity (Miyamoto et al. Reference Miyamoto, Suzuki, Kohyama, Seino, Mirmanto and Simbolon2003; Sellan et al. Reference Sellan, Thompson, Majalap and Brearley2019). This is particularly important for kerangas forests in the lowlands, where sandy soils exacerbate moisture variability due to poor water retention (O’Brien and Escudero Reference O’Brien and Escudero2022). In Rungan-Kahayan, kerangas forests dominate the higher elevations, implying drier soils due to low water retention and increased runoff. However, contrary to findings in heath forests in Malaysian Borneo (Jucker et al. Reference Jucker, Bongalov, Burslem, Nilus, Dalponte, Lewis, Phillips, Qie and Coomes2018), peat depth was found to be more influential than topography in lowland Central Kalimantan. This difference may be attributed to the higher elevations typical of heath forest formation in Malaysian Borneo, where elevations may range from 50 to 150 m.a.s.l. (Jucker et al. Reference Jucker, Bongalov, Burslem, Nilus, Dalponte, Lewis, Phillips, Qie and Coomes2018), which are more representative of hill kerangas
Tree densities in the Rungan-Kahayan kerangas forests were slightly higher than other Bornean heath forests, with 746 stems/ha compared to 602 stems/ha in East Kalimantan (Riswan Reference Riswan1982) and 708 stems/ha in Sarawak (Proctor et al. Reference Proctor, Anderson, Chai and Vallack1983). While the floristic composition varies across different heath forests, families like Myrtaceae, Clusiaceae, and Rubiaceae are common (Davies and Becker Reference Davies and Becker1996; Ikbal et al. Reference Ikbal, Din, Tuah, Md Jaafar, Ahmad and Sukmaria Sukri2023), with Myrtaceae present across all Rungan-Kahayan habitat types. Dipterocarps, though less prevalent in heath forests generally, dominate the canopy in Rungan-Kahayan alongside species from Calophyllaceae. Other species typical of waterlogged peat forests, like Gonystylus bancanus and Xanthophyllum falvescens, were largely absent, while species from hill kerangas and dipterocarp forests, such as Santiria laevigata and Garcinia beccarii, are present. Certain species adapted to low-pH soils, like Dryobalanops rappa and Kayea calophylloides, were restricted to kerangas habitats (Newbery and Proctor Reference Newbery and Proctor1984).
Although the elevation gradient in our study site was minimal compared to hill kerangas sites in Borneo (Ikbal et al. Reference Ikbal, Din, Tuah, Md Jaafar, Ahmad and Sukmaria Sukri2023), the variation in canopy height and biomass between kerangas and mixed swamp habitats reflects different strategies for biomass accumulation. Kerangas forests, with their variable height profiles and larger tree girths, contrast with the taller but smaller-girthed trees in mixed swamps. This is atypical and is contrasting with other studies that have evaluated stand structure (Nishimura and Suzuki Reference Nishimura and Suzuki2001). This difference could potentially be driven by adaptations to nutrient availability and water conditions, where trees in kerangas are slow growing, heavy wood trees (Ashton, Reference Ashton2014), which invest in larger girths to store energy and enhance nutrient uptake, while swamp species grow taller due to abundant nutrients and hydrological stability (Zhang et al. Reference Zhang, Li, Chen, Xie, Liu and Pei2016) relative to kerangas. Additional factors, such as the need for structural support in drier habitats (Peguero-Pina et al. Reference Peguero-Pina, Vilagrosa, Alonso-Forn, Ferrio, Sancho-Knapik and Gil-Pelegrín2020) and competition for light in dense swamps (Nishimura and Suzuki Reference Nishimura and Suzuki2001), also influence these morphological differences.
Soil acidity is a key factor in shaping the structure of heath forests (De Graaf et al. Reference De Graaf, Bobbink, Smits, Van Diggelen and Roelofs2009; Proctor Reference Proctor1999). The kerangas in our study area had lower pH values compared to other sites, which range from 3.8 to 4.1 (Jaafar et al. Reference Jaafar, Sukri and ProcheÅŸ2016; Sellan et al. Reference Sellan, Thompson, Majalap and Brearley2019; Vernimmen et al. Reference Vernimmen, Bruijnzeel, Proctor, Verhoef and Klomp2013). Acidic, well-drained soils with low organic content support distinct tree families, for example, drought-tolerant Dipterocarpaceae species dominant in hill kerangas (Wong and Kamariah, Reference Wong and Kamariah1999). This is consistent with our findings of abundant dipterocarps in Rungan-Kahayan kerangas habitats.
In contrast, the higher peat depth and lower pH in the low pole explain the similarities in tree species composition to kerangas habitats. Genera like Calophyllum, Shorea, and Syzygium had lower canopy heights and girths in low pole, with DBH not significantly different across habitats for trees ≥ 10 cm DBH, in line with other studies in Borneo (Paoli Reference Paoli2004; Sukri et al. Reference Sukri, Wahab, Salim and Burslem2012). Furthermore, the abundance of tropical conifers such as Agathis borneensis and Gymnostoma nobile, particularly in kerangas and low pole habitats, has nitrogen-fixing actinomycetes in their root nodules, and the presence of carnivorous plants (Nepenthes spp.) indicates adaptations to low-nitrogen and nutrient-deficient soils (Wong et al. Reference Wong, Low, Muhammad Ariffin and Joffre2015).
Hydrology plays a major role in forest composition especially in wet habitats (Rodríguez-González et al. Reference Rodríguez-González, Stella, Campelo, Ferreira and Albuquerque2010). Waterlogged forests, forming on shallow organic soils, are rare in Borneo and resemble heath forests in their acidity but have lower nutrients and organic matter (Jaafar et al. Reference Jaafar, Sukri and ProcheÅŸ2016). The low pole habitat in our study site aligns with descriptions of ‘kerapahs’, a type of heath forest found in Borneo (Din et al. Reference Din, Metali and Sukri2015; Nafiah et al. Reference Nafiah, Sukri, Ya’akub, Jaafar and Metali2022); though our site lacked an abundance of typical kerapah species like Dacrydium, these species have been reported in adjacent forest areas in the region (Maimunah et al. Reference Maimunah, Kessler, Indrioko, Naiem and Samek2021, Reference Maimunah, Kessler, Indrioko and Naiem2022). Instead, genera like Calophyllum and Combretocarpus dominated, suggesting that these low pole forests may be younger peat formations (Anderson Reference Anderson1981). The peat depth observed in our study supports this, as young peat formations, like those in the Kutai lakes (Hope et al. Reference Hope, Chokkalingam and Anwar2005), often feature Pandanus species and carnivorous plants, which were common in the low pole habitat in our study. Based on these observations, we hypothesise that the low-canopy pole swamp forests in our study may represent a variant of kerapahs, a wet heath forest type in Borneo, rather than it being a variation of peat swamp forests. Further studies are necessary to confirm this hypothesis.
Conservation of lowland kerangas
Heath forests are of considerable ecological interest, characterised by strong biotic and abiotic interactions despite appearing homogeneous and stable (Fagúndez Reference Fagúndez2013). High spatial heterogeneity is a major feature of kerangas, making these forests challenging to define, map, study, and manage. Kerangas cover about 3% of Kalimantan’s total forest area, with most (∼ 73%) outside formally protected areas, leaving them highly susceptible to conversion, primarily for oil palm and artisanal small-scale gold mining in Central Kalimantan. The protected areas with the greatest extent of kerangas are Tanjung Puting National Park (5.26%) and Bukit Sapat Hawung Nature Reserve (2.24% of the total Kerangas cover in Kalimantan).
In the Rungan-Kahayan landscape, ∼ 70% of the forests lack formal protection. However, since 2016, the social forestry schemes introduced by the Ministry of Environment and Forestry of Indonesia have granted several villages management rights over fragmented forest blocks, providing short-term protection to many kerangas-dominated areas. The establishment of MBERF, forests, further aids in conservation for a relatively large kerangas-dominated forest block in the landscape. Social forestry schemes in the region offer a promising approach to conserving kerangas forests by supporting community-managed non-timber forest products (NTFPs), while preventing other extractive activities. However, ensuring long-term sustainability requires further research and detailed assessment into the socio-economic benefits from NTFPs, community dependence, and access to forest resources. Despite these efforts, only ∼ 3% of the kerangas habitat is currently protected under these schemes in the Rungan-Kahayan landscape, leaving the majority at risk of rapid degradation.
These protected areas are fragmented and surrounded by extractive activities driven by limited livelihood alternatives and market access (Anirudh Reference Anirudh2025). Such activities, though restricted outside community-managed forest areas, increase edge effects (Piessens et al. Reference Piessens, Honnay, Devlaeminck and Hermy2006) and vulnerability to fires (Tuah et al. Reference Tuah, Tennakoon, Jaafar and Sukri2020) and invasive species (Loke et al. Reference Loke, Margrove, Ahmad, Jikim, Endawie, Hatta, Andrew and Maycock2023). Additionally, pollutants from gold mining, like mercury, pose further risks to the region’s sensitive biodiversity by increasing water acidity and affecting connected ecosystems (Elvince et al. Reference Elvince, Inoue, Tsushima, Takayanagi, Darung, Gumiri, Dohong, Nagafuchi, Kawakami and Yamada2008).
Heath forests are particularly vulnerable to fire and drought. Their sandy, porous soils and relatively more open canopy allow light penetration, thereby increasing the likelihood of ignition (Ikbal et al. Reference Ikbal, Din, Tuah, Md Jaafar, Ahmad and Sukmaria Sukri2023; Tuah et al. Reference Tuah, Tennakoon, Jaafar and Sukri2020). In northern Borneo, burning of kerangas has facilitated the invasion of fire-adapted Acacia species, further enhancing fire susceptibility (Jambul et al. Reference Jambul, Limin, Ali and Slik2020). Re-establishing kerangas forests requires eradicating invasive Acacia and restoring canopy cover to promote the growth of typical heath-tolerant species (Ibrahim et al. Reference Ibrahim, Sukri, Tennakoon, Rosli and Metali2023). The kerangas-dominated forest mosaic in our study landscape has begun to show evidence of Acacia invasion especially in ex-gold mining sites and areas affected by widespread fires in the region. Restoration plays a crucial role in the conservation of kerangas forests. However, the recovery of Borneo’s kerangas forests can be a slow process, especially in areas where surface peat layers have been lost (Jambul et al. Reference Jambul, Limin, Ali and Slik2020; Suhaili et al. Reference Suhaili, Tennakoon and Sukri2015). This loss significantly affects the feasibility and effectiveness of restoration efforts, requiring dedicated, long-term research to develop sustainable restoration strategies.
In addition to harbouring unique species characteristic to the heath forest habitat (Maimunah et al. Reference Maimunah, CapillaArmadiyanto and Harrison2019), our study area supports two critically endangered, four endangered, seven near-threatened, and ten vulnerable tree species as listed under the IUCN Red List and nine Bornean endemics (see Supplementary Material Table 6). While many of these species are not exclusively associated with heath forests, the mosaic nature of such landscapes in Kalimantan facilitates their occurrence through transition zones between distinct habitat types, leading to species overlaps, as demonstrated by our ordination analysis. Our observations emphasise kerangas forests as priority areas for conservation, considering their important role in sustaining high biodiversity across diverse, interconnected habitats.
From a bioprospecting perspective, kerangas provide valuable timber resources, including species of Shorea that are abundant. They are also rich in lianas, plants, and trees species with medicinal value, providing traditional cures for illnesses ranging from common colds to cancer (Oktavia et al. Reference Oktavia, Pratiwi, Munawaroh, Hikmat and Hilwan2022). These forests also contribute to local food security through edible ferns, wild fruits, honey, fungi, heart of palm, and tubers (Weihreter Reference Weihreter2014). Hence, the lack of formal protection of these habitats may further have implications on human well-being due to compromised ecosystem services.
Considering the paucity of research in lowland kerangas and consequently limited knowledge regarding the impacts of both anthropogenic threats and conservation interventions, our findings provide a baseline by attempting to disentangle the mosaic structure of the lowland kerangas and demonstrating that it is indeed a unique habitat type in the landscape. We suggest that more research targeted towards lowland kerangas is required by building on this baseline. This is important for the development of more scientifically informed lowland heath forest conservation strategies and for increased recognition of such forest types within policy for the protection of heath forests in Indonesia and beyond.
Supplementary material
The supplementary material for this article can be found at https://doi.org/10.1017/S0266467425100084.
Data availability statement
Plot data from our study has been previously submitted to the collaboration network coordinated by Prof. Ferry Slik and was used to produce a published article (DOI: 10.1111/geb.13878).
Data supporting our findings will be made available on global databases (GBIF and forestplots.net) and will be available on request to the corresponding authors.
Acknowledgements
We thank the National Research and Innovation Agency of Indonesia for permits and Universitas Muhammadiyah Palangkaraya for permitting research. We appreciate the support from the provincial and regional government departments in Central Kalimantan. Our gratitude extends to the local community and students for their involvement in data collection.
Author contributions
Study design: MEH, BJWB, BRC, FJvV, SMC, WME, SM, NSB, AF, SJH
Data collection and compilation: BJWB, BRC, SM, KPM, A, EE, NSB, S, NN, SMC, MEH, WME, NBA
Data analysis: NBA, BRC, FJvV, DJIS, NJD
Writing: NBA
Review: NBA, MJS, NJD, FJvV, WME, AR, MEH
Financial support
NBA’s work was supported by the Leverhulme Trust UK under the Tropical Defaunation Hub, DICE, University of Kent, and Borneo Nature Foundation International, UK. FJvV and MEH’s contributions were supported by UKRI through the Global Challenges Research Fund (grant number NE/T010401/1).
Competing interests
The authors declare none.
Ethical standards
This research complied with Indonesian National and local legal and ethical standards and regulations. Data collection was conducted under research permits issued by the National Research and Innovation Agency of the Republic of Indonesia to several authors of this study. For a detailed acknowledgement and list of research permits, please refer to Supplementary Text 2.
The research did not involve the transportation or analysis of any samples (e.g. soil/plant matter) and hence did not require any material transfer agreement and/or other special permits to this effect. No harm was caused to flora or fauna during data collection processes.


 Open access