


Introduction
Glyphosate is one of the main herbicides used worldwide (Duke and Powles Reference Duke and Powles2008). Its site of action is the enzyme 5-enolpyruvylshikimate 3-phosphate synthase (EPSPS; EC 2.5.1.19), which is present in the shikimic acid pathway and is responsible for the production of the aromatic amino acids phenylalanine, tyrosine, and tryptophan. In addition to being used in the production of proteins in plants, these amino acids act as precursors of a large number of secondary metabolites such as pigments, flavonoids, auxins, phytoalexins, lignin, and tannins (Velini et al. Reference Velini, Duke, Trindade, Meschede, Carbonari, Velini, Meschede, Carbonari and Trindade2009).
Sourgrass is a C4 plant of the Poaceae family native to the tropical and subtropical regions of the Americas (Lorenzi Reference Lorenzi2008), and propagates via seeds and rhizomes (Machado et al. Reference Machado, Meira, Ferreira, Ferreira, Tuffi Santos, Fialho and Machado2008). The seeds are light and hairy, have a germination percentage greater than 90% and are produced in large quantities by the plant, allowing its dissemination over long distances by wind (Mondo et al. Reference Mondo, Carvalho, Dias and Marcos Filho2010). Rhizomes develop within 35 to 45 d after emergence (Machado et al. Reference Machado, Ferreira, Ferreira, Fialho, Tuffi Santos and Machado2006). The formation of clumps (bunches) and the perennial habit of the plant makes its control more difficult due to the high rates of regrowth from perennial plants and increases its capability to produce and disseminate seeds, which occurs year round (Kissmann and Groth Reference Kissmann and Groth1997; Lorenzi Reference Lorenzi2008).
The first worldwide report of sourgrass resistance to glyphosate was reported in southern Paraguay (25.41°S, 56.45°W) in 2005 (Heap Reference Heap2019). In 2008, the first case of resistance was reported in Brazil in Guaíra, Paraná (24.07°S, 54.25°W; Heap Reference Heap2019). There are currently several recorded cases of resistant populations scattered throughout the country as described by Carvalho et al. (Reference Carvalho, Cruz-Hipolito, González-Torralva, Alves, Christoffoleti and De Prado2011, Reference Carvalho, Alves, González-Torralva, Cruz-Hipolito, Rojano-Delgado, De Prado, Gil-Humanes, Barro and De Castro2012), Lopez Ovejero et al. (Reference Lopez Ovejero, Takano, Nicolai, Ferreira, Melo, Cavenaghi, Christoffoleti and Oliveira2017), and Takano et al. (Reference Takano, Oliveira, Constantin, Mangolim, Machado and Bevilaqua2018). According to Adegas et al. (Reference Adegas, Vargas, Gazziero, Karam, Silva and Agostinetto2017), sourgrass that is resistant to glyphosate is present in more than 5.5 million hectares of soybeans in Brazil. This represents an increase in crop production costs of more than R$2 billion annually, and it also leads to yield reductions of up to 40% because of competition with crops.
The difficulty in the elucidation of resistance mechanisms is probably related to the high genetic variability of the species, which was verified by Martins et al. (Reference Martins, Barroso, Carvalho, Cesarin, Amaral, Nepomuceno, Desidério and Alves2016) in their studies with random primers, as they verified general rate of polymorphism in 56.6%, featuring a high dissimilarity between biotypes, as explained by the fact that sourgrass is a species of outcrossing fecundity, offering varied genetic load in reproduction. In addition, all the studies on the mechanisms of resistance of this species to glyphosate have been conducted with young plants obtained from seed, which therefore represents another source of genetic variation, since one seed is not genetically identical to another. Thus, information concerning resistance in perennial sourgrass, which is commonly found in agriculture and is more problematic than annual grasses in terms of management, is lacking.
Furthermore, although accumulation of shikimic acid is known to occur in glyphosate-susceptible populations, differences in accumulation of quinic acid, salicylic acid, and aminomethylphosphonic acid (AMPA) in resistant (R) and susceptible (S) biotypes have been studied to a lesser extent. Our objective was to confirm glyphosate resistance in sourgrass and to understand the metabolic profile of these plants in response to the herbicide.
Materials and Methods
The experiments were conducted in duplicate in a greenhouse between January 2016 and June 2018, all repeated in time. Eleven sourgrass biotypes were used; the clumps (bunches) were collected in rural areas of the State of São Paulo, Brazil (Table 1).
Table 1. Location of the collected sourgrass biotypes used in the experiments.

After the clumps were collected they were washed in running water to remove soil and other debris and manually separated, after which their propagules were transplanted into pots (25 L) and used as the source of propagules in all experiments. The pots were filled with soil with a clayey texture, and the soils were fertilized such that the following physical/chemical characteristics were obtained: 552, 199, and 245 g dm−3 clay, silt, and sand, respectively; pH (CaCl2) 4.9; 22.5 g dm−3 organic matter; 15.5 mg dm−3 P (resin); 1.8 mmolc dm−3 Al3+; 47.5 mmolc dm−3 H+Al=; 1.4 mmolc dm−3 K+; 22.5 mmolc dm−3 Ca2+; 10.5 mmolc dm−3 Mg2+; 35 mmolc d−3 BS; 82.5 mmolc dm−3 CTC (T); 55 mg dm−3 S; 40.5 V%.
Propagules of the biotypes were transplanted on February 11, 2016 (Test 1), and January 11, 2018 (duplicate test), into pots (2 L) filled with Carolina II substrate®, which consisted of sphagnum peat, expanded vermiculite, roasted rice husks, dolomitic limestone, and agricultural gypsum with the following physical/chemical characteristics: traces of NPK; 0.7 ± 0.3 mS cm−1 electrical conductivity; pH 5.5; 155 kg m− 3 density; and 55% water-holding capacity. Each experimental unit consisted of one propagule (one fragmented rhizome + root system + pruned tillers above the first internode) contained in an individual pot.
At the time of application, the plants were between 40 and 60 cm high and were divided into two parts: those with three tillers protected with a transparent plastic bag and those with unprotected tillers. The climatic conditions at the time of application included a temperature of 32 C and an average relative humidity of 51% (Experiment 1), and a temperature of 31 C and an average relative humidity of 62% (duplicate).
The commercial product we used was Roundup Original® (Monsanto Company, St. Louis, Missouri, USA) isopropylamine salt formulation at 360 g ae L−1 at a dose of 1,440 g ae ha−1. To apply the herbicide a stationary compressed air sprayer was used with a spray boom that was 2 m in length; the boom travels a distance of 6 m with the aid of an electric motor and a frequency modulator that controls the speed (3.6 km h−1). Four XR 11002 VS tip nozzles were located on the boom at a spacing of 0.5 m and were positioned at a height of 0.5 m above the plants. The pressure used was 196.13 kPa, which delivered 200 L ha−1.
After application, the plants remained in the open for a few minutes until the spray solution was completely dry. The plastic bags protecting the tillers were then carefully replaced with paper cones at a density of 80 g m−2 so that the protected tillers did not wither and had no physical contact with the rest of the plant that had received the glyphosate application. The plants remained under this protection until 72 h after application (HAA) because, according to Carvalho et al. (Reference Carvalho, Alves, González-Torralva, Cruz-Hipolito, Rojano-Delgado, De Prado, Gil-Humanes, Barro and De Castro2012), the absorption of glyphosate in sourgrass has two moments of rapid absorption: the most intense being in the first 12 h, followed by a second phase that occurs with 48 to 72 HAA; when analyzing the genotypes in isolation, 72 HAA showed relatively high absorption on average.
After 72 HAA, all the leaves of the three protected tillers, three randomly selected tillers receiving the glyphosate application, and three randomly selected tillers from the plants that did not receive the application of the herbicide (untreated controls) were collected separately from each pot. Visual control evaluations of the foliage were performed at 28 d after application (DAA) of glyphosate in accordance with a percentage scale where “0” corresponds to no control and “100” corresponds to the death of the plant (Sociedade Brasileira da Ciência das Plantas Daninhas 1995).
The leaves collected from the tillers that received the herbicide application were immediately subjected to two procedures for extraction and quantification of compounds. First, they were packed in plastic bags and washed three times with 100 ml of deionized water to remove the glyphosate that had deposited externally on the leaves of the plants. For this, the contents of the plastic bag were carefully mixed for a period of 30 s, and the water from the triple wash was subsequently discarded.
The triple-washed leaves, the leaves of the three tillers protected at application, and the leaves of three tillers of the controls were then placed separately in paper bags for drying in a circulating forced-air oven at 40 C for 5 d until the plant material was completely dry.
The extraction methodology proposed by Gomes et al. (Reference Gomes, Velini and Carbonari2015) was used to determine the total internal concentration of glyphosate, glyphosate translocation, AMPA content; and accumulation of shikimic acid, quinic acid, and salicylic acid. The following adaptations were made: the samples (0.1 g) were macerated in a mortar containing liquid nitrogen, packed in centrifuge tubes with a capacity of 15 ml, and stored in an ultrafreezer at −80 C until analysis. For extraction of the compounds, 10 ml of water acidified to a pH of 2.5 with an automatic pipette (Gilson, Middleton, Wisconsin, USA) was subsequently added to each tube. The tubes were lightly stirred and then subjected to an ultrasonic bath (Elma-Elmasonic P 180 H, Gottlieb-Daimler-Stra♯e, Singen, Germany) at 37 kHz for 30 min at a temperature of 55 C.
After extraction, all samples were centrifuged at 2,755 × g for 10 min at 20 C (Hettich - Rotina 38R, Föhrenstr, Tuttlingen, Germany) for phase separation. The supernatants were then collected and filtered on a Millex HV (Merck – Millipore, Darmstadt, Germany) 0.45-μm filter equipped with a 13-mm Durapore membrane and packed in a 9-mm amber (flow supply) vial with a 2-ml capacity. The quantification was performed using a Shimadzu Prominence ultrahigh-performance liquid chromatographic–tandem mass spectrometry instrument (Shimadzu, Columbia, Maryland, USA) and a Triple Quad 4500 triple quadrupole hybrid mass spectrometer (AB SCIEX, Framingham, Massachusetts, USA).
The method used for the analysis was proposed by Araújo (Reference Araújo2008), where Q3 is used to detect only the mass of a known fragment (son) of the intact molecule (parent) that has a known mass that was filtered by Q1. To optimize the conditions of the mass spectrometer, direct injections with a 1 mg L−1 standard analytical solution of each compound were performed individually (Gomes et al. Reference Gomes, Velini and Carbonari2015). From the infusions of the test substances, the source ionization mode (electrospray ionization) was chosen, which produces analyte ions in the liquid phase before entering the mass spectrometer. Negative ionization mode was used for glyphosate, AMPA, shikimic acid, quinic acid, and salicylic acid.
A Gemini NX- C18 (150 mm × 4.6 mm, 110 Å, 5 µm – Phenomenex, Torrance, California, USA) analytical column with two mobile phases was used: Phase A (PA) consisted of 5 mM ammonium acetate in water, and phase B (PB) consisted of 5 mM ammonium acetate in methanol. The chromatographic conditions used to quantify the compounds in the positive and negative ionization mode were as follows: The gradient from 0 to 1 min consisted of 10% PB and 90% PA; 1–4 minutes, 95% PB and 5% PA; 4–8 minutes, 95% PB and 5% PA; 8–10 minutes, 10% PB and 90% PA; and 10–12 minutes, 10% PB and 90% PA. The flow was 0.6 ml min−1.
Detection and separation of the compounds were performed in one run, with ionization of the compounds in positive and negative mode with a total time of 12 min. The retention time in the chromatographic column of each compound was as follows: glyphosate, 2.89 min; AMPA, 2.89 min; shikimic acid, 2.95 min; quinic acid, 3.25 min; and salicylic acid, 5.33 min. The ion used for quantification of the compounds was always the first fragment generated from each molecule, and the data are shown in Table 2. The analytical curves for the compounds were constructed as concentration bands as described in Table 3. The internal concentration of glyphosate was determined by the total glyphosate + AMPA content (µg g−1 dw) found within the leaves of the three tillers that received application of the herbicide plus that found in the leaves of the three tillers protected at application. The amount of translocation was determined by the total concentration of glyphosate (µg g−1 dw) found in the leaves of the three tillers protected at application.
Table 2. Molecular mass of the compounds and fragments generated by HPLC-MS/MS in Experiment 1 and its duplicate. a
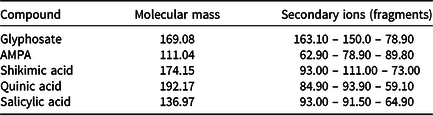
a Abbreviations: AMPA, aminomethylphosphonic acid; HPLC-MS/MS, high-performance liquid chromatography–tandem mass spectrometry.
Table 3. Analytical curves of the compounds generated by HPLC-MS/MS.a
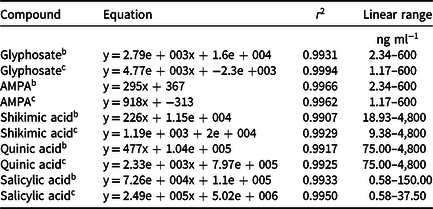
a Abbreviations: AMPA, aminomethylphosphonic acid; HPLC-MS/MS, high-performance liquid chromatography–tandem mass spectrometry.
b Experiment 1.
c Experiment 2 (duplicate).
The levels of AMPA, shikimic acid, quinic acid, and salicylic acid were determined by the concentration of each compound (μg g−1 dw) found in the leaves of the tillers that received the herbicide application, in the leaves of the three tillers protected at application, and in leaves of plants not treated with the herbicide (controls). For AMPA, a control was not included.
The results of the evaluated compounds (μg g−1 dw) were subjected to ANOVA and F-tests, and the means were compared using the Tukey-Kramer least significant difference test (P < 0.05). The design was completely randomized, with 11 treatments (biotypes) and four replicates.
Results and Discussion
Resistant and susceptible biotypes responded differently for both shikimic acid and quinic acid concentrations at 72 HAA of glyphosate and for control at 28 DAA. Resistant biotype control was less than 40% at 28 DAA, whereas sensitive biotype control was greater than 95% (Figure 1). The resistant biotypes (R1, R2, and R3) accumulated less than 400 μg g−1 dw glyphosate parent compound, which was statistically less than that in the S biotypes, whose concentrations varied between 675 and 893 μg g−1 dw (Figure 1). Shikimic acid concentrations in the leaves of tillers protected during glyphosate application ranged from 29 to 92 μg g−1 dw and 107 to 220 μg g−1 dw for the R and S biotypes, respectively (Figure 1).
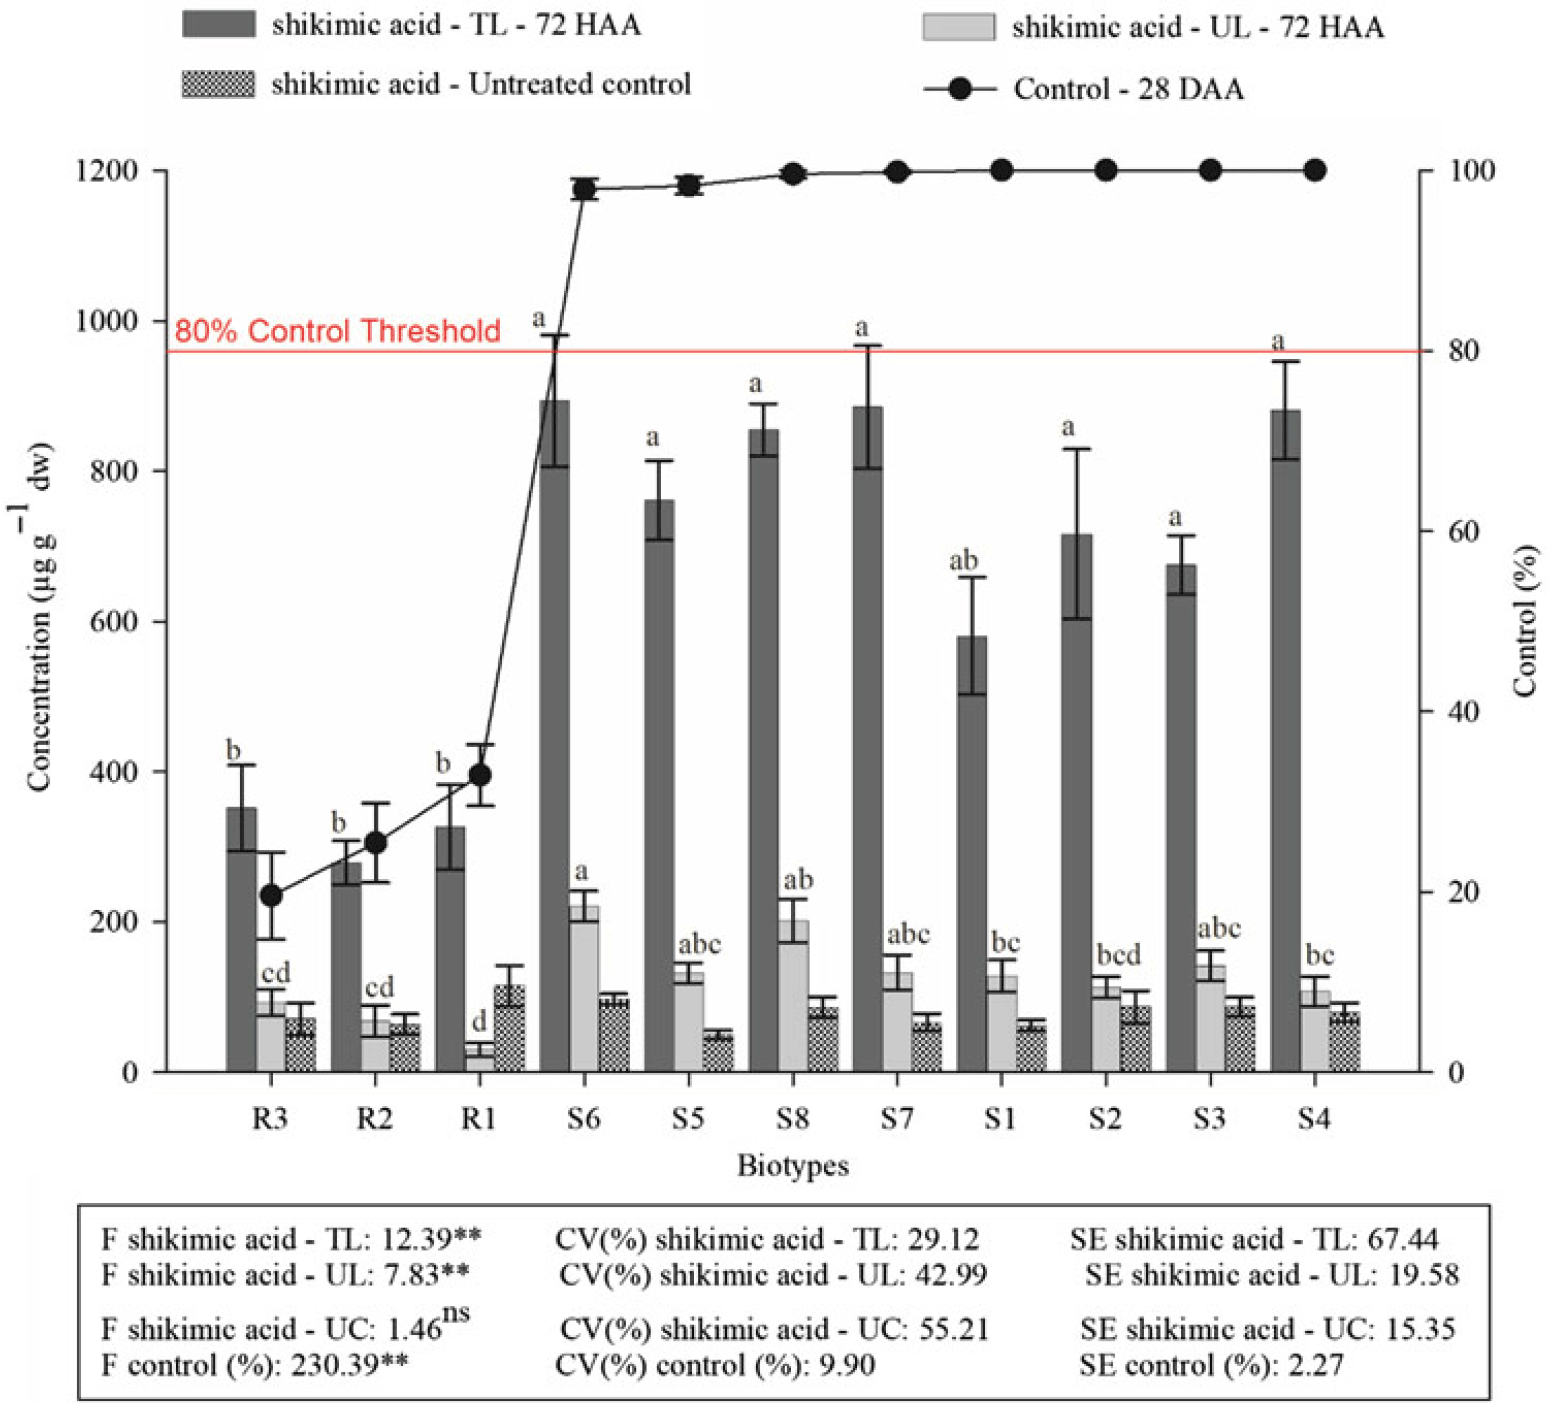
Figure 1. Percentage of the control at 28 dafter application (DAA) of glyphosate and the accumulation of shikimic acid (in the leaves of untreated controls, in the leaves of the tillers that received the herbicide application and in leaves of the tillers protected at application) at 72 h after application (HAA) in biotypes of sourgrass. The values are the averages of two assays. CV (%), coefficient of variation; TL, treated leaves; UL, untreated (protected) leaves; UC, untreated control leaves. Error bars correspond to the averages and standard errors of the mean (n = 4). The same letters in the same group of bars do not differ according to the Tukey-Kramer least significant difference test (P < 0.05). ns, **Not significant and significant (P < 0.01), respectively, according to the F-test.
Less shikimic acid accumulation in S biotypes is widely accepted as a marker of resistance to glyphosate in plants following treatment (Harring et al. Reference Harring, Streibig and Huested1998; Nandula et al. Reference Nandula, Reddy, Rimando, Duke and Poston2007; Orcaray et al. Reference Orcaray, Zulet, Zabalza and Royuela2012; Reddy et al. Reference Reddy, Rimando and Duke2004). When glyphosate is applied to a susceptible plant, shikimic acid accumulates due to the regulation of its pathway, indicating that EPSPS is inhibited (Powles and Preston, Reference Powles and Preston2006). When glyphosate is applied to a resistant plant, the lack of EPSPS inhibition prevents the accumulation of shikimic acid.
The concentration of quinic acid showed a pattern similar to that of shikimic acid (Figure 2). At 72 HAA, the contents of the compound in the R biotypes were between 718 and 747 μg g−1 dw in the leaves of the tillers that received glyphosate applications and were statistically lower than concentrations in the S plants, whose concentrations varied between 1,122 and 1,389 μg g−1 dw in the leaves of tillers protected during application (Figure 2).
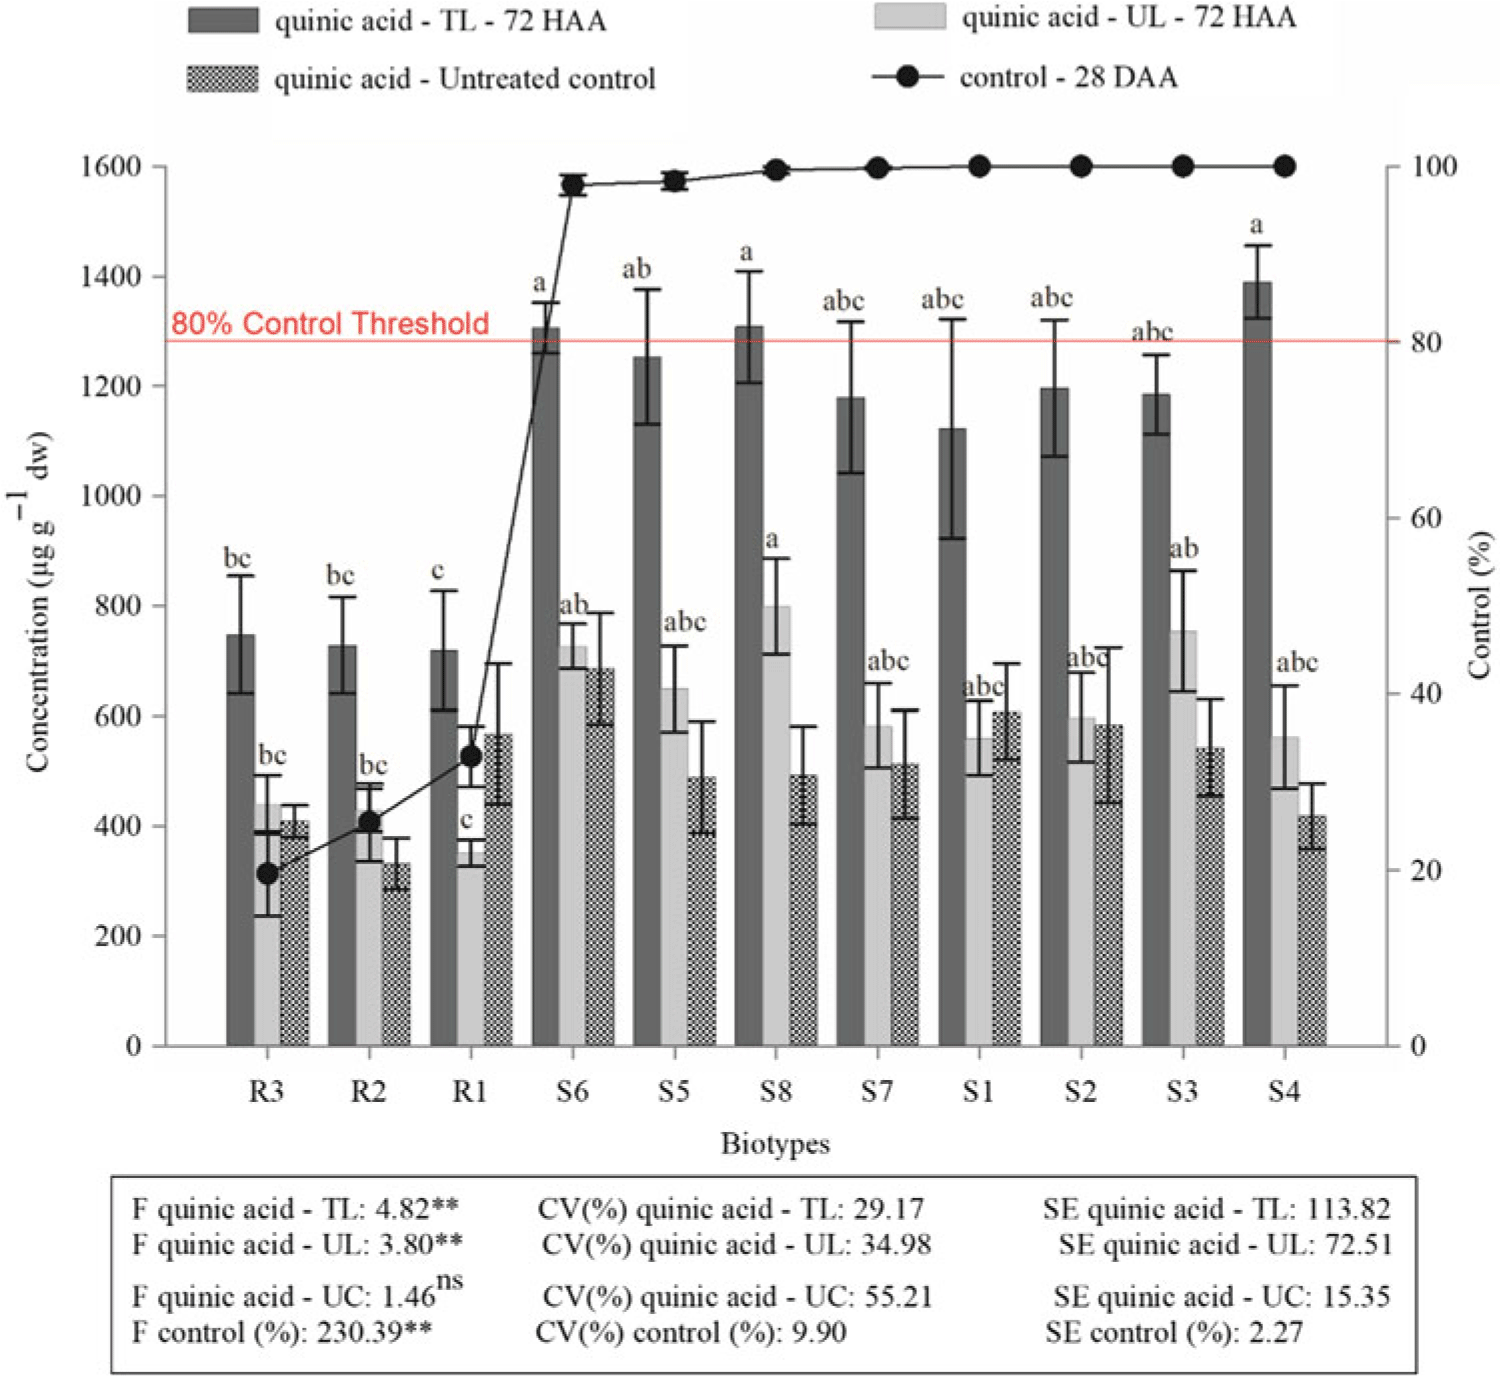
Figure 2. Percentage of the control at 28 d after application of glyphosate (DAA) and the accumulation of quinic acid (in the leaves of untreated controls, in the leaves of the tillers that received the herbicide application and in the leaves of the tillers protected at application) at 72 h after application (HAA) in biotypes of sourgrass. The values are the averages of two assays. CV (%), coefficient of variation; TL, treated leaves; UL, untreated (protected) leaves; control, untreated control leaves. Error bars correspond to the averages and the standard errors (n = 4). The same letters in the same group of bars do not differ according to the Tukey test (P < 0.05). ns, ** Not significant and significant (P < 0.05), respectively, according to the F-test.
In the leaves of tillers protected during herbicide application, the concentration of quinic acid was very similar to the concentration in the control plants. In the biotypes that were resistant to the compound, quinic acid concentration ranged from 351 to 429 μg g−1 dw in the leaves of the protected tillers and from 331 to 567 μg g−1 dw in the controls. In the biotypes that were susceptible to the compound, the quinic acid concentration ranged from 559 to 799 μg g−1 dw in the leaves of the protected tillers and from 418 to 685 μg g−1 dw in the controls (Figure 2).
Quinic acid has a structure that is very similar to that of shikimic acid. Quinic acid is a precursor of hydroxybenzoic acid (Orcaray et al. Reference Orcaray, Igal, Marino, Zabalza and Royuela2010) and can be synthesized in the plant in two ways: from 3-dehydroquinate (DHQ), catalyzed by the enzyme DHQ dehydrogenase, or from shikimic acid (Bentley and Haslam Reference Bentley and Haslam1990, Leuschner et al. Reference Leuschner, Herrmann and Schultz1995). When glyphosate is applied to plants, there is also an accumulation of quinic acid due to the accumulation of compounds prior to the EPSPS step in the pathway (Carbonari et al. Reference Carbonari, Gomes, Velini, Machado, Simões and Macedo2014; Orcaray et al. Reference Orcaray, Igal, Marino, Zabalza and Royuela2010). Thus, the accumulation of quinic acid can also be used as a marker of glyphosate resistance in weeds.
The relatively low shikimic acid and quinic acid concentrations in the leaves of the protected tillers, similar to those observed in the untreated controls (Figures 1 and 2), is a sign of glyphosate resistance based on past research. However, no statistical difference was observed between R and S types with respect to glyphosate translocation. In treated leaves of R plants, 92.6% of the glyphosate was retained, and 95.0% was retained in the treated leaves of S plants, representing 7.4% and 5.0% translocation in the R and S biotypes, respectively (Table 4).
Table 4. Total internal concentration of glyphosate found inside the leaves of sourgrass, internal concentration of glyphosate translocated to the leaves of protected tillers at the time of herbicide application and the relationship between shikimic acid content and glyphosate in each part of the plant. Values are the averages of two assays.
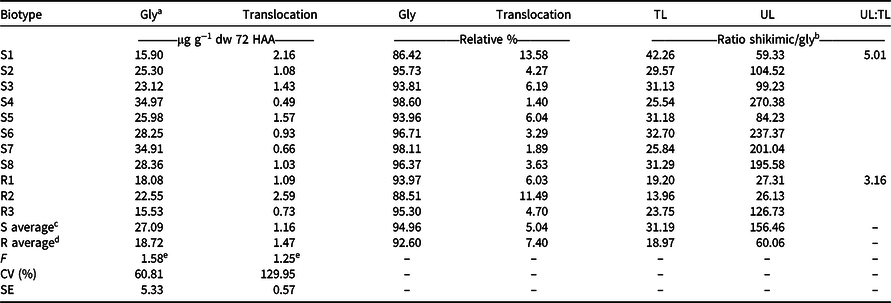
a Abbreviations: CV, coefficient of variation; Gly, glyphosate; HAA, hours after application; R, resistant; S, susceptible; SE, standard error of the mean (n = 4); TL, treated leaves; UL, untreated (protected) leaves.
b Ratio of shikimic acid to glyphosate concentration.
c Susceptible biotypes S1 through S8.
d Resistant biotypes R1 through R3.
e NS, not significant according to the F-test.
Definitive differences were observed between treated and protected tiller response to glyphosate for R and S biotypes. When analyzing the relationship between the glyphosate and shikimic acid concentrations found in the leaves of tillers that received glyphosate applications and concentrations in the leaves of protected tillers, we observed that the relative amount of shikimic acid found in the resistant and sensitive biotypes was 3.16 and 5.01 times higher, respectively, in the leaves of the protected tillers at application (Table 4). This finding demonstrates that the phytotoxic activity of glyphosate was greater in the leaves of the protected tillers, regardless of whether the plant was resistant or susceptible to the herbicide. Thus, even if the translocation was reduced and did not show a significant difference between the biotypes, it likely plays a significant role in the sensitivity of sourgrass to glyphosate and may probably be involved in the resistance of the species to this herbicide.
In addition, glyphosate was 2.61 times more active in the protected leaves of the S biotypes compared with the R biotypes, even though no more than the average amount of the herbicide was translocated (Table 4). One possible explanation is that glyphosate may have been retained and stored in other parts of the plant, such as vacuoles and cell walls, preventing it from being translocated to the protected leaves at application. This retention has been shown to occur in other species such as Conyza canadensis (Ge et al. Reference Ge, d’Avignon, Ackerman and Sammons2010) and Lolium spp. (Ge et al. Reference Ge, d’Avignon, Ackerman, Collavo, Sattin, Ostrander, Hall, Sammons and Preston2012), where resistance due to the rapid sequestration of glyphosate in the vacuole of these plant species is consequently prevented from reaching sufficient concentrations at the site of action; thus, the glyphosate cannot exert its herbicidal function.
There was no significant difference in glyphosate metabolism to AMPA at 72 HAA between the R and S biotypes (Table 5). In addition, less than 1% of the glyphosate inside the plant was converted into AMPA, indicating that the metabolism of this herbicide is not considered a resistance mechanism of sourgrass to glyphosate. However, it is noteworthy that even though there was no significant difference between the biotypes, a small amount of metabolism of glyphosate to AMPA was observed. On average, the S biotypes showed formation of 0.50% AMPA, whereas the R biotypes showed 0.65% (Table 5).
Table 5. Total concentration of glyphosate and aminomethylphosphonic acid found inside the leaves of sourgrass at 72 h after application of herbicide. The values are the averages of two assays.
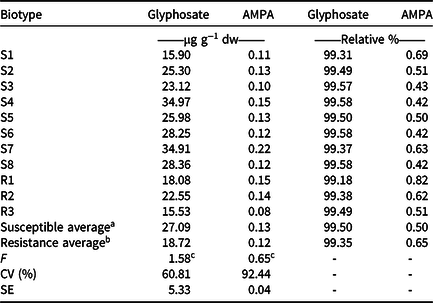
a Biotypes S1 through S8.
b Biotypes R1 through R3.
c NS, not significant according to the F-test;
d Abbreviations: CV (%), coefficient of variation; SE, mean standard error (n = 4).
These results do not corroborate those obtained by Carvalho et al. (Reference Carvalho, Alves, González-Torralva, Cruz-Hipolito, Rojano-Delgado, De Prado, Gil-Humanes, Barro and De Castro2012), who found at 96 HAA that 91.1% of the glyphosate was detected in the S biotype sourgrass, whereas in the R ones, between 10% and 23% was detected; and Costa et al. (Reference Costa, Carvalho, Cruz-Hipolito, Alves and De Prado2014) found that metabolism to AMPA, glyoxylate, and sarcosine may provide a relatively low level of resistance to glyphosate in sourgrass.
Salicylic acid may be related to the glyphosate target site and may have an impact on weed resistance to glyphosate. Salicylic acid is an important signaling compound involved in the activation of pathogen resistance genes (Gaille et al. Reference Gaille, Kast and Haas2002; Popova et al. Reference Popova, Pancheva and Uzunova1997; Ryals et al. Reference Ryals, Neuenschwander, Willits, Molina, Steiner and Hunt1996; Ward et al. Reference Ward, Uknes, Willians, Dincher, Wiederhold, Alexander, Ahl-Goy, Métraux and Ryals1991). After detection of a stressor or causal agent, several metabolic pathways are activated or inhibited in plants, and the nature of this reaction affects all subsequent synthesis and accumulation of compounds such as phenolics and terpenes (Velini et al. Reference Velini, Duke, Trindade, Meschede, Carbonari, Velini, Meschede, Carbonari and Trindade2009). In this sense, R biotypes undergoing stress caused by the activity of glyphosate may have responded with the activation of certain genes, which, in turn, induced an increase in EPSPS production or activity to protect the plants against the glyphosate.
Indeed, can be observed in Figure 3 that the concentration of salicylic acid in the R biotypes was statistically higher than that found in the S plants, regardless of whether they received the application of glyphosate. On average, the R biotypes showed concentrations of 8.17 μg g−1 dw, 9.02 μg g−1 dw, and 8.50 μg g−1 dw in untreated control leaves, leaves of treated tillers, and leaves of protected tillers, respectively. In the S biotypes, the mean concentration of the compound was 3.87 μg g−1 dw, 4.96 μg g−1 dw, and 5.03 μg g−1 dw in untreated control leaves, leaves of treated tillers, and leaves of protected tillers, respectively.

Figure 3. Salicylic acid content at 72 HAA for resistant (above) and susceptible (below) biotypes of sourgrass. The values are the averages of two assays. CV (%), coefficient of variation; HAA, hours after application. **Significant (P < 0.01) according to the F-test.
These data represent, on average, an increase of 47.36% in salicylic acid in R biotypes compared to S biotypes and a 57.08% increase in salicylic acid in R biotypes compared to S biotypes at 72 HAA of glyphosate. Therefore, it is likely that R biotypes show increased EPSPS activity due to the higher concentration of salicylic acid compared with that in S biotypes. According to Galeano et al. (Reference Galeano, Barroso, Vasconcelos, López-Rubio, Albrecht, Victoria Filho and Carrer2016), a 5.1-fold increase in EPSPS activity in glyphosate-resistant sourgrass plants compared with susceptible plants occurred. It was therefore suggested that the resistance mechanism of sourgrass to glyphosate may also be linked to the site of action. However, additional in-depth molecular studies need to be conducted for such verification, because even with all the results of this experiment showing a strong indication that the mechanism of sourgrass resistance to glyphosate may be linked to the target site resistance (TSR), the target biotypes of these experiments were not sequenced, and therefore it is not possible to infer that this greater accumulation of salicylic acid is related to nontarget site resistance or to TSR.
Furthermore, the fact that salicylic acid was found at higher concentrations in the R biotypes compared with S biotypes, even in plants that did not receive an application of glyphosate, is a strong indication that this compound has the potential to be used as a marker of weed resistance to this herbicide. However, additional studies need to be conducted with other resistant populations of other species to validate this finding.
Research Implications
In view of the information outlined above, it was observed that the levels of shikimic acid and quinic acid after application of glyphosate correlated very strongly and indicated the susceptibility or resistance of sourgrass biotypes to this herbicide. In addition, salicylic acid has the potential to be used as a constitutive marker of resistant weeds, but this idea needs further work with additional biotypes originating from a wider geographical area.
The translocation of glyphosate, although at low levels and without significant differences between the R and S biotypes, potentially plays an important role in the sensitivity of sourgrass to this herbicide because the shikimic acid concentrations were proportionally higher in the leaves of the protected tillers that received the application and resulted in increased activity of the herbicide in these leaves. However, this information indicates that other mechanisms may work together to provide sourgrass resistance to glyphosate because the translocation of glyphosate was reduced in all plants studied.
The metabolism of glyphosate to AMPA was not considered a mechanism of resistance of sourgrass to glyphosate in these biotypes because less than 1% of the parent herbicide was found in plants as this metabolite, and there was no significant difference between the resistant and susceptible biotypes.
Acknowledgments
No conflicts of interest are declared. This publication was supported by the Coordenação de Aperfeiçoamento de Pessoal de Nível Superior (CAPES). We thank the Faculty of Agronomic Sciences campus of Botucatu (UNESP – FCA) and all staff and students of the Center for Advanced Research in Matologia (NUPAM).


