


Healthcare-associated legionellosis is a significant concern in the United States, accounting for 33% of legionellosis outbreaks, 57% of outbreak-associated cases, and 85% of outbreak-associated deaths. Reference Soda, Barskey and Shah1 These numbers are especially alarming considering that the annual number of reported cases has grown by nearly 5.5 fold since 2000. 2 Those who are particularly vulnerable to contracting Legionnaires’ disease include adults aged >50 years, former or current smokers, and those with chronic diseases or immunosuppression. Reference Soda, Barskey and Shah1 These risk factors make individuals in hospitals and nursing homes particularly vulnerable to a variety of Legionella spp. and L. pneumophila, the bacteria that cause Legionnaires’ disease and Pontiac fever.
Premise water systems are the most frequent source of exposure in healthcare-associated cases. Reference Garrison, Kunz and Cooley3 Control of legionellae in premise water systems may be a complex process requiring long-term assessments for adequate control. Reference Dziewulski, Ingles, Codru, Strepelis and Schoonmaker-Bopp4 Legionellosis prevention in inpatient and residential healthcare settings typically involves regular sampling of the premise water system and some form of water treatment in cases of high culture counts of Legionella or a high frequency of positive culture samples. Current sampling recommendations are based on published guidance and on experience of working with water treatment systems, typically 10 samples per 100 beds in a healthcare facility building. Reference Freije5 The recommendation by Best et al Reference Best, Yu, Stout, Gortz, Muder and Taylor6 that intervention occur with 30% or more positives in a cycle of samples has been widely adopted. Reference Stout, Muder and Mietzner7 Some have argued that percentage distal-site positivity for Legionella in drinking water is accurate in predicting risk and that quantitative criteria (expressed in CFU/mL) have proven inaccurate and should be abandoned. Reference Lin, Stout and Yu8 In New York State, for example, the 30% positivity benchmark for instituting additional control measures has been incorporated into 10 NYCRR Part 4, Protection Against Legionella, Subpart 4-2, Health Care Facilities. 9 Although the presence of Legionella in a proportion of >30% of outlets has been shown to be predictive of disease, Reference Stout, Muder and Mietzner7,Reference Lin, Stout and Yu8 debate continues regarding whether the extent of colonization (percentage positive) or quantitative measurement as CFU/mL should be used to determine the extent of microbial control, possible risk of nosocomial transmission, and at what point culturing actually should be conducted. Reference Spagnolo, Cristina, Casini and Perdelli10 This debate continues at least partially because little quantitative evidence exists to date in the form of predictive statistical modeling to support the 30% positivity benchmark for treatment in healthcare facility water sampling for Legionella.
Using the methods of Christian and Pipes Reference Pipes and Christian11 and others that were implemented for coliform sampling, Reference Pipes and Christian11–Reference Christian and Pipes13 the goal of this work was to attempt to significantly fit a statistical distribution to the proportion of positive Legionella samples (any species) in a series of tests. A successful fit could help determine expectations for the proportion of positive samples in a series of tests. This information will help in developing practical goals for testing, in recommending interventions, and in assessing whether an outbreak has been controlled. It could also serve as the basis for further investigation into the utility of the 30% positivity benchmark.
Materials and methods
The data used for this research consisted of 1,393 culture samples taken from a hospital and an associated long-term care facility (LTCF) in New York State collected between June 2009 and August 2014. The data also included temporal and culture data from a deidentified hospital site supplied by one of the vendor laboratories collected between August 2014 and February 2016. The hospital in New York State was a complex assemblage of 7 in-house hot water systems. Data from the deidentified hospital covered a period of 1.5 years and a subsequent period of 1 additional week.
The LTCF was located in the same neighborhood and was supplied by the same water provider. Each building in the study had its own independent-premise water distribution system and, when present, its own treatment system, as presented previously. Reference Dziewulski, Ingles, Codru, Strepelis and Schoonmaker-Bopp4 The 5-building hospital facility had 6 cases of legionellosis during 2009–2015. Samples were collected after cases were reported and treatment methods were installed. Each location followed both manufacturer and their consultant’s recommendations for maintenance and monitoring (both culture and chemistry). All facilities were supplied water from a public water system.
Environmental sample collection for Legionella culture
The water in the sampled buildings was either untreated for Legionella or treated with chlorine dioxide (ClO2) or copper–silver ionization (CSI). All hot water samples were first-draw samples. Depending upon the destination laboratory, 100 mL (for New York State Department of Health [NYSDOH] Wadsworth Laboratory), 120 mL, or 1,000 mL (contract laboratories) of sample was aseptically collected after faucet aerators were removed. Sample bottles contained thiosulfate to inactivate free chlorine and other oxidants. Samples were capped and stored with synthetic ice bricks in coolers to avoid extreme temperature variations and were then transported to the appropriate laboratory.
Culture methods
A contract laboratory, the Special Pathogens Laboratory (Pittsburgh, PA), used direct and concentrated culture methodology. Direct cultures were performed by plating 100 µL water directly onto buffered charcoal yeast extract (BCYE) agar and BCYE selective media with DGVP (dye, glycine, vancomycin and polymyxin B). For concentrated cultures, 100 mL of the original water sample were filtered through a 0.2-µm polycarbonate filter (Whatman, VWR Scientific, West Chester, PA), resuspended in 10 mL of the original unfiltered water sample, and vortexed. Subsequently, 100-µL aliquots were plated onto BCYE agar and BCYE with DGVP agar. All plates were incubated at 37°C for 7 days. Colonies suspected of being Legionella spp. were tested using latex agglutination followed by direct fluorescent antibody (DFA) staining (M-TECH, Alpharetta, GA) to confirm the presence of Legionella spp.
A second vendor laboratory (EM P&K Laboratory, Marlton, NJ) also used direct plating or filtration for premise water samples (1,000 mL). Samples were concentrated using 0.2-µm polycarbonate filters and then resuspended in 5.0 mL sterile water. Samples of water or resuspended pellets (100 µL) were plated on BCYE supplemented with polmyxin B, cycloheximide and vancomycin (PCV) and GPVC, which is identical to PCV but with added glycine.
Samples processed by NYSDOH were plated directly or after concentration. Environmental samples (15 mL) were concentrated 1:30 by centrifugation (4,000 rpm Beckman CS-6 with GH-3.8 horizontal rotor for 20 minutes). All but 0.5 mL was carefully removed, and 0.05-mL aliquots of sample were plated on blood agar, BCYEα (BCYE with 0.1% α-ketoglutarate), and BMPAα (with cefamandole, polymyxin B and anisomycin) plates and were then streaked for isolation.
The concentrated pellet was tested by PCR for the presence of the 23S rRNA genus-wide gene and the L. pneumophila-specific MIP gene. The results of the PCR analysis were used to guide culture steps. Plates were placed in plastic bags to maintain moisture, were incubated in ambient air at 35–37°C, and were examined every other day for 10 days. Typical colonies that grew on BCYEα slants with L-cysteine and failed to grow (or grew poorly) on BCYEα without L-cysteine were considered presumptive Legionella positive and were confirmed using the following tests: DFA (M-Tech, Alpharetta, GA), autofluorescence, catalase, oxidase, urease, gelatinase, and browning on FG agar.
Statistical analysis
The samples were segmented into 139 test cycles with roughly 10 samples in each. A test cycle in this data was considered a collection of samples taken in the same building within 3 days (only 4 of the 139 tests cycles did not take place on the same day). There was consistency in water treatment type across all samples in a test cycle; every test cycle in the data contained only samples with 1 of the 3 treatment options (ie, the 2 aforementioned treatment types or untreated).
The proportion of positive samples for the 139 test cycles were standardized to 25 total samples per test to give a distribution of discrete values. These values were analyzed for fit with the following discrete distributions: Poisson, negative binomial, geometric, and zero-inflated Poisson. These distributions have been previously fitted to presence of coliform bacteria in water distribution systems by Christian and Pipes Reference Pipes and Christian11 and others. Reference El-Sharrawi12,Reference Christian and Pipes13 A negative binomial distribution would model the probability of a specified amount of positive and negative tests in a total number of tests; a geometric distribution is a modified version of the negative binomial distribution but with the number of positive tests fixed at one. The geometric distribution would only be a good fit if every test before the first positive sample were negative and every test after the first positive were positive, but that order is unlikely in real practice.
The Poisson distribution is like the negative binomial distribution, but it adds the restriction that the mean and the variance of the distribution of positive tests are equal. The zero-inflated Poisson distribution takes that a step further by creating a bimodal distribution that allows the Poisson distribution to model the portion of tests with at least 1 positive sample, and a second mode that measures the excess zeros that commonly occur in environmental sampling (which is also true for samples for coliform collected in water distribution systems).
The probability mass function for the zero-inflated Poisson distribution for this analysis is as follows: (1) Let θ be the proportion of test cycles with no positive sample. (2) Let λ be the mean proportion of positive samples for test cycles with at least one positive sample. (3) Let r be the number of samples:
 $$P\left( r \right) = \left\{ {\matrix{
{\left( {1 - \theta } \right){e^{ - \lambda }} + \theta ,\;when\;r = 0} \cr
{\left( {1 - \theta } \right){e^{ - \lambda }}\left( {{{{\lambda ^r}} \over {r!}}} \right),\;when\;r \ne 0} \cr
} } \right.\,$$
$$P\left( r \right) = \left\{ {\matrix{
{\left( {1 - \theta } \right){e^{ - \lambda }} + \theta ,\;when\;r = 0} \cr
{\left( {1 - \theta } \right){e^{ - \lambda }}\left( {{{{\lambda ^r}} \over {r!}}} \right),\;when\;r \ne 0} \cr
} } \right.\,$$
Results
All of the tested discrete distributions failed to significantly fit the observed proportions of all positive samples; however, the zero-inflated Poisson model significantly fit the distribution of positive samples per test cycle treated with CSI (P = .0347 using a scaled Pearson χ2 test) (Fig. 1). A Vuong closeness test confirmed that the zero-inflated Poisson distribution was a significantly better fit for the samples than a standard Poisson distribution (P < .0001).

Fig. 1. Observed proportion of tests (copper–silver ionization [CSI] treatment samples) and theoretical distributions. Plot of discrete adjusted observed proportions for CSI-treated test cycles (“sample”) with expected values from 4 tested discrete distributions. The expected values from the zero-inflated Poisson distribution were not significantly different from the adjusted observed values, suggesting that the proportion of samples positive for Legionella in a test cycle follows the zero-inflated Poisson distribution. ![]() , Sample;
, Sample; ![]() , Poisson;
, Poisson; ![]() , Zero-inflated Poisson;
, Zero-inflated Poisson; ![]() , Negative Binomial;
, Negative Binomial; ![]() , Geometric.
, Geometric.
Figure 2 displays the observed positive proportions for CSI treated samples plotted with the expected positive proportions from the zero-inflated Poisson distribution. The cumulative 95% of the expected distribution occurs between 8 and 9 positives per 25 samples, which is equivalent to a 32%–36% positivity rate. This range, close to the previously established 30% positivity target, and additional model fitting with more samples, could better refine this number. Furthermore, 93% of the zero-inflated Poisson expected distribution occurred by the 30% positivity cutoff, resulting in ~7% of the expected CSI test cycles to have a proportion of positive test samples >30%.
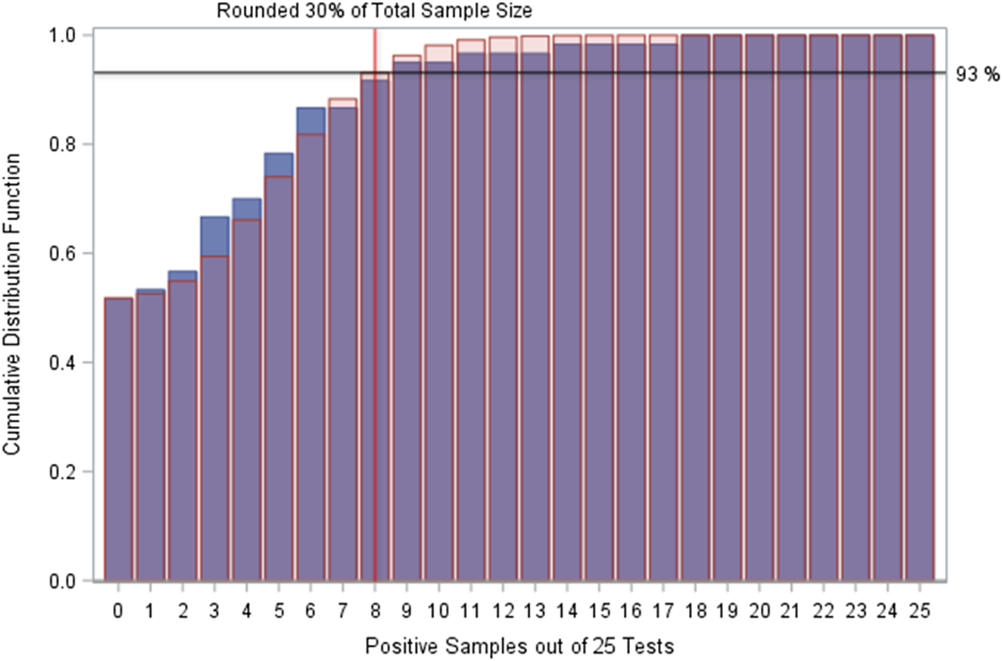
Fig. 2. Cumulative distribution functions of observed positives and expectations. Plot of cumulative distribution functions for the zero-inflated Poisson distribution fit to the copper–silver ionization (CSI)-treated test cycles and the sample CSI-treated test cycles. The zero-inflated Poisson distribution suggests that ~93% of test cycles should be expected to have a positive sample proportion of ≤30%, and that 95% of test cycles should be expected to have a positive sample proportion of ≤36%. Values to the right of the red line (located at 8 positive samples among 25 tests on this graphic) indicate samples that fit the recommendation for interventions. The expectation (red transparent bars) for these test cycles are very low (<10%), reinforcing the hypothesis that these are unlikely results that may indicate a water system that is not behaving naturally. ![]() , Sample;
, Sample; ![]() , Zero-inflated Poisson.
, Zero-inflated Poisson.
Applying the zero-inflated Poisson distribution to test cycles with CSI treatment and untreated water (removing 4 outliers that had small samples and positivity rates ≥80%) revealed a significant fit for the expected positive proportions and the observed samples (P = .0179 using a scaled Pearson χ2 test) (Fig. 3).
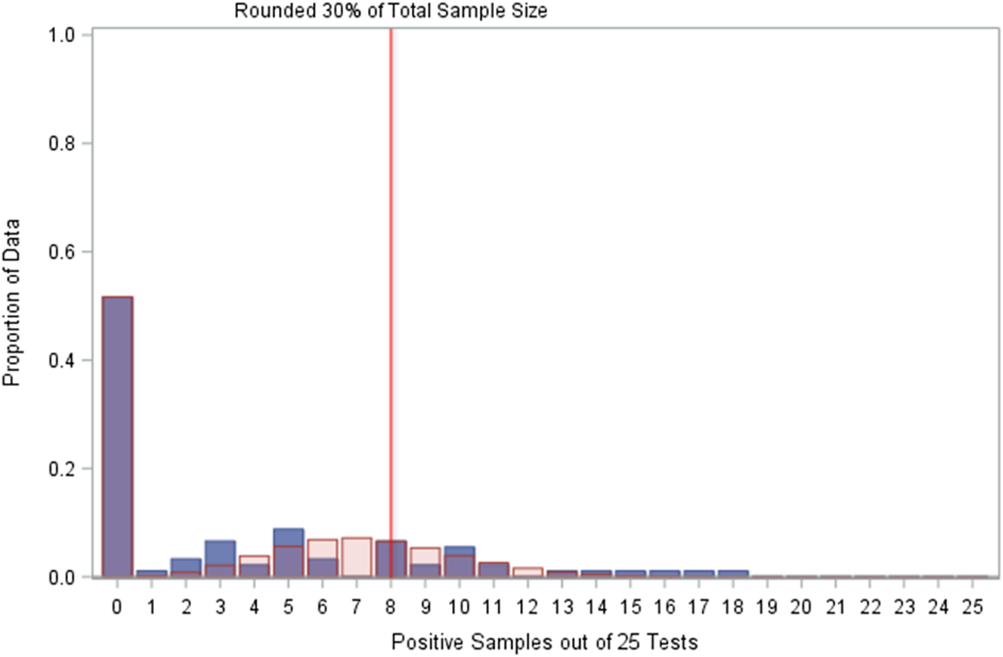
Fig. 3. Comparison of observed positives with zero Poisson expectations. Plot of distribution of sampled test cycles for copper–silver ionization (CSI)-treated water and untreated water (minus four outliers among 95 total samples) with fitted zero-inflated Poisson distribution expected values. ![]() , Sample;
, Sample; ![]() , Zero-inflated Poisson.
, Zero-inflated Poisson.
The zero-inflated Poisson distribution fitted to the CSI-treated and untreated test cycles indicated that 88% of the expected positive proportions should occur by the 30% cutoff (rounded up to 8 positive samples among 25 total samples), similar to the 93% expectation for just CSI-treated test cycles. However, the other treatment in these data (chlorine dioxide, ClO2) was not effective in treating Legionella in the sampled buildings, Reference Dziewulski, Ingles, Codru, Strepelis and Schoonmaker-Bopp4 and if there is an underlying distribution to these specific test cycles, then it is not the zero-inflated Poisson distribution (Fig. 4).
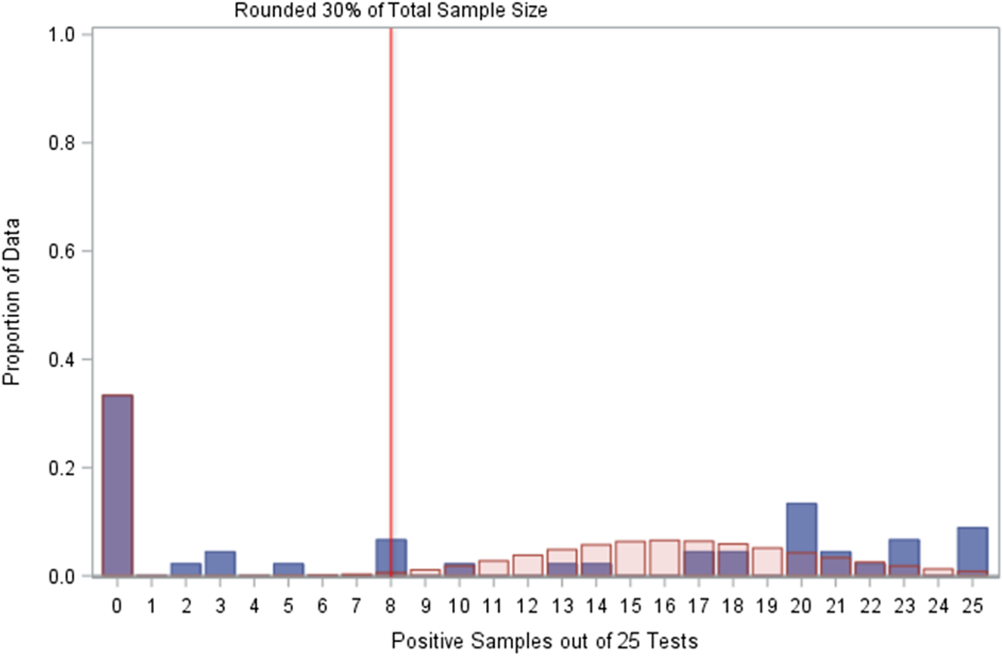
Fig. 4. Comparison of observed positives with zero Poisson expectations. The zero-inflated Poisson distribution did not fit the distribution of positive samples among 25 tests for chlorine dioxide-treated water. ![]() , Sample;
, Sample; ![]() , Zero-inflated Poisson.
, Zero-inflated Poisson.
Discussion
The values from the ClO2 test cycles and the values from CSI and untreated test cycles were very different. Using both of these proportions in a single model will be messy and unrepresentative of either of the 2 scenarios. That is, the model would predict more positive samples than CSI and untreated water tests have, while simultaneously predicting fewer positive samples than ClO2 treated water have. Possibly, the data in this analysis for ClO2 were not representative of ClO2 treatment for Legionella, which influenced the authors to lean toward excluding it from analysis.
Although the 30% metric has been criticized for low sensitivity and specificity, Reference Allen, Myatt and MacIntosh14 others argue that the 30% criterion has validity when properly applied. Reference Pierre, Stout and Yu15 The critics of the 30% positivity approach maintain their conclusion, insisting on insufficient sensitivity and specificity, and advocating the use of multiple factors in considering risk and steps to be followed to mitigate the problem. The latter included the “consideration of Legionella prevalence in the water system,” but without the use of the 30% cutoff point. Reference Christian and Pipes13
The zero-inflated Poisson distribution may be the distribution for proportion of Legionella positive water samples in a test cycle. The distribution fits for a well-treated system (CSI in this analysis) and fits most of the observations when untreated water is also considered (it did not predict test cycles with >50% positive samples). Considering that most (between 88% and 93% in this analysis) of the expected test cycles in this analysis should have 30% or a lower proportion of positive samples, these data appear to support the current cutoff recommendations.
The data analyzed for this project indicate that ~30% or a lower proportion of positive Legionella samples should occur in a well-maintained water system. Anything above that cutoff is either very unlikely or not expected at all and is therefore indicative of a problem in the water system.
In practice, using the 30% positivity cutoff for healthcare facilities should be part of a fully implemented water management plan in a well-maintained building water system. In New York State, when secondary disinfection is part of that plan, the facility must validate treatment performance by monitoring Legionella occurrence and the residuals of any treatment chemicals. In the absence of disease, if routine survey results indicate >30% of culture samples being positive, then that exceedance needs to be reported and additional sampling must be performed according to the regulations in New York State. 9 Adjustments to the treatments and/or operations need to be made and resampling must be done according to a protocol appended to the regulation (see Appendix 4B online 9 ). The goal is to have positive culture results <30% before the cycle of adjustments and sampling are completed.
When there are both disease and exceedances >30%, for example, NYSDOH requires water restrictions to be implemented for patients. This includes, among other things, the use of bottled water; restrictions on showers; bed baths; and the installation of point-of-use filters based on patient vulnerability and need. Under these circumstances, the facility must produce 3 successive months of Legionella culture data that show <30% of the culture samples being positive. If this is accomplished, then the remainder of the year requires quarterly sampling and water restrictions may be removed. The ideal target for Legionella culture-positive results is always “0%.” However, some facilities may never attain 0% Legionella positivity and still not experience disease. But maintaining water restrictions can negatively impact patient care and staff hygiene. The use of the 30% positivity benchmark allows for normal water use to be reinstituted sooner while continuing to promote the comfort and protect the health of patients or residents.
While the environment is being managed, patient surveillance is ongoing. Prospective surveillance is required for up to 6 months without disease for the investigation to be closed. Environmental and clinical evidence is required to (1) end water restrictions in the short term and (2) close the investigation in the long term.
These observations (proportions of positive Legionella samples >30%) may not be part of the natural expectations; therefore, they should be scrutinized and considered outside of expectations. The increase above expectations justifies intervention by secondary disinfection.
This study has several limitations. A limited number of test sites were examined. However, the facilities examined involved seven separate buildings and nine hot water systems. Nearly 1,400 samples were collected but larger sampling sizes may help validate the distributions. Also, 3 separate water conditions were considered for this work: untreated, treated with ClO2 and treated with CSI. Similar work should be performed examining other treatment modalities. Furthermore, the initial investigations required intervention by the State health department. Afterward, the need for ongoing bacterial monitoring or collection of additional data at different locations also involved commercial laboratories. All used similar culture methods and PCR for the L. pneumophila MIP gene complemented culture for general legionellae. It could be useful to test methods side-by-side to confirm results.
Supplementary material
To view supplementary material for this article, please visit https://doi.org/10.1017/ice.2020.384
Acknowledgments
The authors thank Dr. Janet Stout for the additional data used in this work and the staff at the Wadsworth Center for processing the Legionella culture samples. The contents are solely the responsibility of the authors and do not necessarily represent the official views of the Centers for Disease Control and Prevention.
Financial support
This work was completed within the NYSDOH BWSP and was supported by Environmental Health Specialist Network (EHS-Net cooperative agreements 1U53EH001105 and 1UE2EH001329) from the Centers for Disease Control and Prevention. D.J.N. received salary from this cooperative agreement.
Conflicts of interest
All authors report no conflicts of interest relevant to this article.


