


Introduction
A significant digitalization revolution is ongoing in the mining and manufacturing industry. Industry 4.0 refers to the integration of intelligent digital technologies, and one aim is to build a digital twins based on the physical counterpart [Reference Tao, Zhang, Liu and Nee1] and optimize mining processes, improve mine safety, and enable cost savings during mine operations [Reference Ghahramanieisalou, Sattarvand and Soni2].
The next evolutionary step is the mining industry transition toward Industry 5.0, which emphasizes stronger collaborations between humans and robots [3]. Industry 5.0 will play an important role in enabling smart mining operations with autonomous driving or automated guided vehicles within the mine [Reference Chen, Li, Silamu, Li, Ge and Wang4].
One core element of this transformation is the use of wireless networks to wirelessly transmit data from machines to the network and back. The main advantage of 5G systems compared with Wi-Fi systems is the seamless handover and communication continuity over multiple serving cells. However, Wi-Fi and 5G may complement each other in the indoor or mine coverage [5].
The 5G networks have now been deployed successfully in the underground mines [Reference Eagle6, Reference Telia7] using frequency range 1 (FR1), whose operational frequencies are below 6 GHz. Higher 5G data rates are achieved utilizing millimeter-wave (mmW) frequencies at frequency range 2 (FR2). The FR2 is divided into two segments where the lower is called FR2-1 covering frequencies between 24 and 43 GHz. The higher segment is called FR2-2 which extends the 5G frequencies coverage from 57 to 71 GHz supporting 2000 MHz signal bandwidths (BW) [8].
The unique characteristics of underground mine environments have been largely overlooked in network planning since most 5G networks have been deployed as terrestrial open-area networks. In contrast, underground networks are installed within the mining tunnels, where the radio signal propagates as if it were inside an air-filled waveguide. The radio signal reflects from the walls, the driveway, and the ceiling of a rather narrow tunnel generating more multipath propagation paths for the 5G radio network than in terrestrial counterparts.
The Wi-Fi systems operate at 2.4, 5.8, and 60 GHz frequency bands. A study of radio wave propagation on three Wi-Fi bands in an old gold mine is presented in [Reference Hakem, Delisle and Coulibaly9]. An Long Term Evolution (LTE) band 2.6 GHz radio performance parameters in the same gold mine are shown in [Reference Issa, Hakem and Kandil10].
Mining industry wireless networks have a few specific requirements that differ from their terrestrial counterparts. The remote controlled of unmanned mining equipment and vehicles relies heavily on video uplink streaming. Some performance requirements for the 5G radio network in an underground coal mine installation have been discussed by Cao in [Reference Cao, Gao, Yu and Ma11], while a 5G network installation study of radio base stations and leaky cables in an underground salt mine has been reported in [Reference Emontsbotz, Lee, Schmitt, Brochhaus, Krishnan, Sieger, Jung, Brell-Cokcan, König and Schmitt12]. It was noted that leaky cable installations are constrained by their fixed positioning, limiting their utility in dynamic mining operations.
The applicability of ray tracing in the underground mine has been studied in [Reference Ghaddar, Mabrouk, Nedil, Hettak and Talbi13], where radio channel and diffraction measurements were conducted at 60 GHz Wi-Fi frequencies within an underground mining tunnel measuring 4.2 m × 4.8 m × 70 m. Similarly, 60 GHz multiple-input multiple-output (MIMO) diversity gains in a gold mine tunnel have been studied in [Reference Taleb, Ghanem, Zaaimia, Mabrouk and Nedil14], in which the coherence BW and maximum excess delays have been evaluated from 57 to 64 GHz frequency band. Other ray tracing studies at a 60 GHz frequency band with measurement validations for an underground mine gallery with dimensions of 5 m × 4.3 m × 37 m are reported in [Reference Ghaddar, Molina-García-Pardo, Mabrouk, Lienard and Degauque15].
The underground mine has different characteristics compared with a standard tunnel. Such tunnels, sidewalls, and ceilings are typically smooth, with roughness mostly resulting from the deterioration of concrete [Reference Zhou and Jacksha16]. By contrast, the underground mine tunnels are man-made, non-uniform, and have rugged surfaces with surface roughness exceeding 10 cm which limits the accuracy of scattering modeling based on the modified Fresnel reflection coefficient [Reference Zhou17]. A survey on channel measurements and models for underground MIMO systems has been presented in [Reference Saleem, He, Zheng and Chen18, Reference Samad, Choi, Kim and Choi19].
MIMO radio channel measurements at 28 GHz (at 5G FR2) which were conducted in a mine tunnel that has a downward slope of approximately 20% over 50 m and a total length of galley 200 m. The tunnel featured an arched ceiling tunnel with a mean width of 3.8 m and a mean height of 2.8 m [Reference Hadji, Nedil, Seddiki and Mabrouk20]. In the same mine radio channel path loss exponent measurements have been performed, and the exponent values of 1.56 and 1.76, with shadow fading standard deviation of 1.34 and 2.32 dB for the line of sight (LOS) and Best-LOS have been measured at 3.5 GHz frequency [Reference Hadji, Nedil, Seddiki and Mabrouk21].
LOS measurements in 3 m × 2 m and 5 m × 2.5 m tunnels at 3.1 GHz have been conducted in [Reference Tariq, Despins, Affes and Nerguizian22]. An ultra-wideband radio channel measurement at 6.5 GHz center frequency and 7 GHz signal BW has been documented in a 3 m × 3 m tunnel in [Reference Rissafi, Talbi and Ghaddar23]. Similarly, LOS and non-line of sight (NLOS) radio channel measurements at 7 GHz center frequency in a 4 m × 5 m mine tunnel have been performed in [Reference Nkakanou, Delisle and Hakem24]. 60 GHz channel measurements in a tunnel of 5 m × 5 m and 3 m × 2.5 m in LOS conditions have been reported in [Reference Mabrouk, Hautcoeur, Talbi, Nedil and Hettak25]. The radio propagation loss studies around a 90∘ corner in mine tunnels at 400 MHz, 900 MHz, 2.5 GHz, and 5.8 GHz frequencies have been conducted in [Reference Jacksha and Zhou26, Reference Zhou, Plass, Jacksha and Waynert27]. Meanwhile, radio channel modeling in railway tunnels at 3.7 and 28 GHz has been explored in [Reference Samad and Choi28]. Previous works partly cover the 5G FR1 frequency bands, but 5G FR2 is largely unaddressed in an underground mine environment.
Radio channel measurement campaigns at 5G FR1 and FR2 frequencies were conducted in Sandvik’s Test Mine, Tampere, Finland. The measurements were performed in October 2022 on FR1 frequencies and in March 2023 for FR2. Performed measurement campaigns focused on signal attenuations in a partially obstructed narrow tunnel and signal propagation properties around the corner into the side tunnel. An earlier version of this paper was presented at EuCAP 2024 and was published in its proceedings [Reference Leinonen, Hovinen, Vuohtoniemi and Pärssinen29].
Radio channel characterizations campaigns
The measurement antennas were located in the middle of the tunnels to emulate typical operation since vehicles drive in the middle of the tunnel. Additionally, the measurement location at about the middle of the tunnel height minimizes the effect on radio signal propagation properties and maximizes the signal strength [Reference Forooshani, Bashir, Michelson and Noghanian30].
The tunnel’s waveguide kind of operation is widely discussed in [Reference Samad, Choi, Kim and Choi19]. The waveguide model considers that only the lowest order mode exists in the tunnel [Reference Sun and Akyildiz31]. The ray model is useful when the antenna is small compared to waveguide dimensions and runs at a frequency significantly higher than the cut-off for low-order modes [Reference Samad, Choi, Kim and Choi19]. Calculated cut-off frequencies for the mine tunnel-sized metallic waveguides were 53.0, 35.3, and 26.5 MHz for the 4 × 4, 6 × 6, and 8 × 8 m. The radio channel measurements were performed two to three decades at higher frequencies than the cut-off frequencies, and thus, the waveguide operation will not affect the measurements. A similar conclusion has been reported in [Reference Forooshani, Bashir, Michelson and Noghanian30].
The radio channel characterization measurements were aimed at covering the currently deployed 5G frequencies. Two measurement campaigns were conducted: The first targeted FR1 frequencies and the second focused on the FR2 frequencies. Each campaign used two measurement frequencies. In the FR1 campaign, the radio channel measurements were performed over a 500 MHz span at center frequencies of 3.5 and 5.5 GHz, while the FR2 campaign used a 3 GHz span at center frequency of 26.5 GHz. The propagation measurement scenarios in the mine environment are illustrated in Figure 1. Diffraction and multipath measurements were taken from the main tunnel toward two narrower tunnels at different crossroads with varying angles of incidence.

Figure 1. Tunnel maps of crossroad and blocking vehicle scenarios: Red rectangle represents the blocking vehicle, yellow circles represent RX, and yellow squares represent the TX trajectory. Yellow and green arrows indicate the TX and RX antenna directions (FR1), respectively. Red arrows indicate the TX antenna azimuth direction scanning range in FR2 measurements. Positive TX azimuth angles increase counter-clockwise in subplot (d). Thin yellow line indicates the baseline, i.e., the center line of the main tunnel.
Measurement setup
The properties of the radio channel have been characterized using results from sinusoidal continuous wave (CW) time complex value measurements from a vector network analyzer. The radio frequency (RF) measurement results are influenced by the digital signal processing (DSP) algorithms employed in the equipment if commercial 5G base stations and mobile user equipment are utilized for radio channel measurements. Moreover, accessing radio channel estimation information and results within the proprietary DSP algorithms of commercial RF equipment is nearly impossible. Consequently, replicating the tests and their results is impractical.
Radio channel measurements were conducted in the NLOS scenarios to investigate the characteristics of underground RF propagation. The FR1 campaign addressed a vehicle blockage scenario as presented in Figure 1(a) and the two crossroad scenarios in Figure 1(b) and (c), while the FR2 campaign concentrated on crossroad scenario 1 at selected transmission (TX) antenna azimuth angles as illustrated in Figure 1(d).
Details about the main measurement equipment and some of their properties are summarized in Table 1 and selected measurement parameters of the measurement cases are given in Table 2.
Table 1. Key equipment
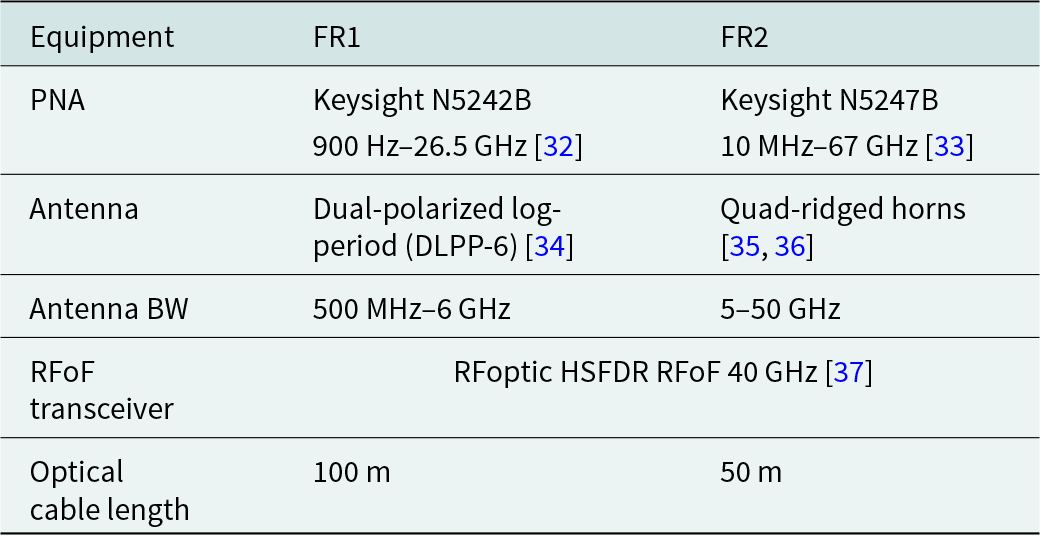
Table 2. Measurement parameters

a With respect to RX antenna.
A CW signal sweep over a frequency span has been used as the channel sounding principle in the measurements. A block diagram of the radio channel measurement system is illustrated in Figure 2. The radio channel data were recorded using a high-performance vector network analyzer (PNA) from Keysight Inc. An RF over fiber (RFoF) transceiver High-SFDR 40G from RFoptic was utilized to overcome significant cable losses in long-haul measurements. The RFoF modulator converts the RF signal to an optical signal and the RFoF reconverts it back to the RF signal at the end of the optical link.
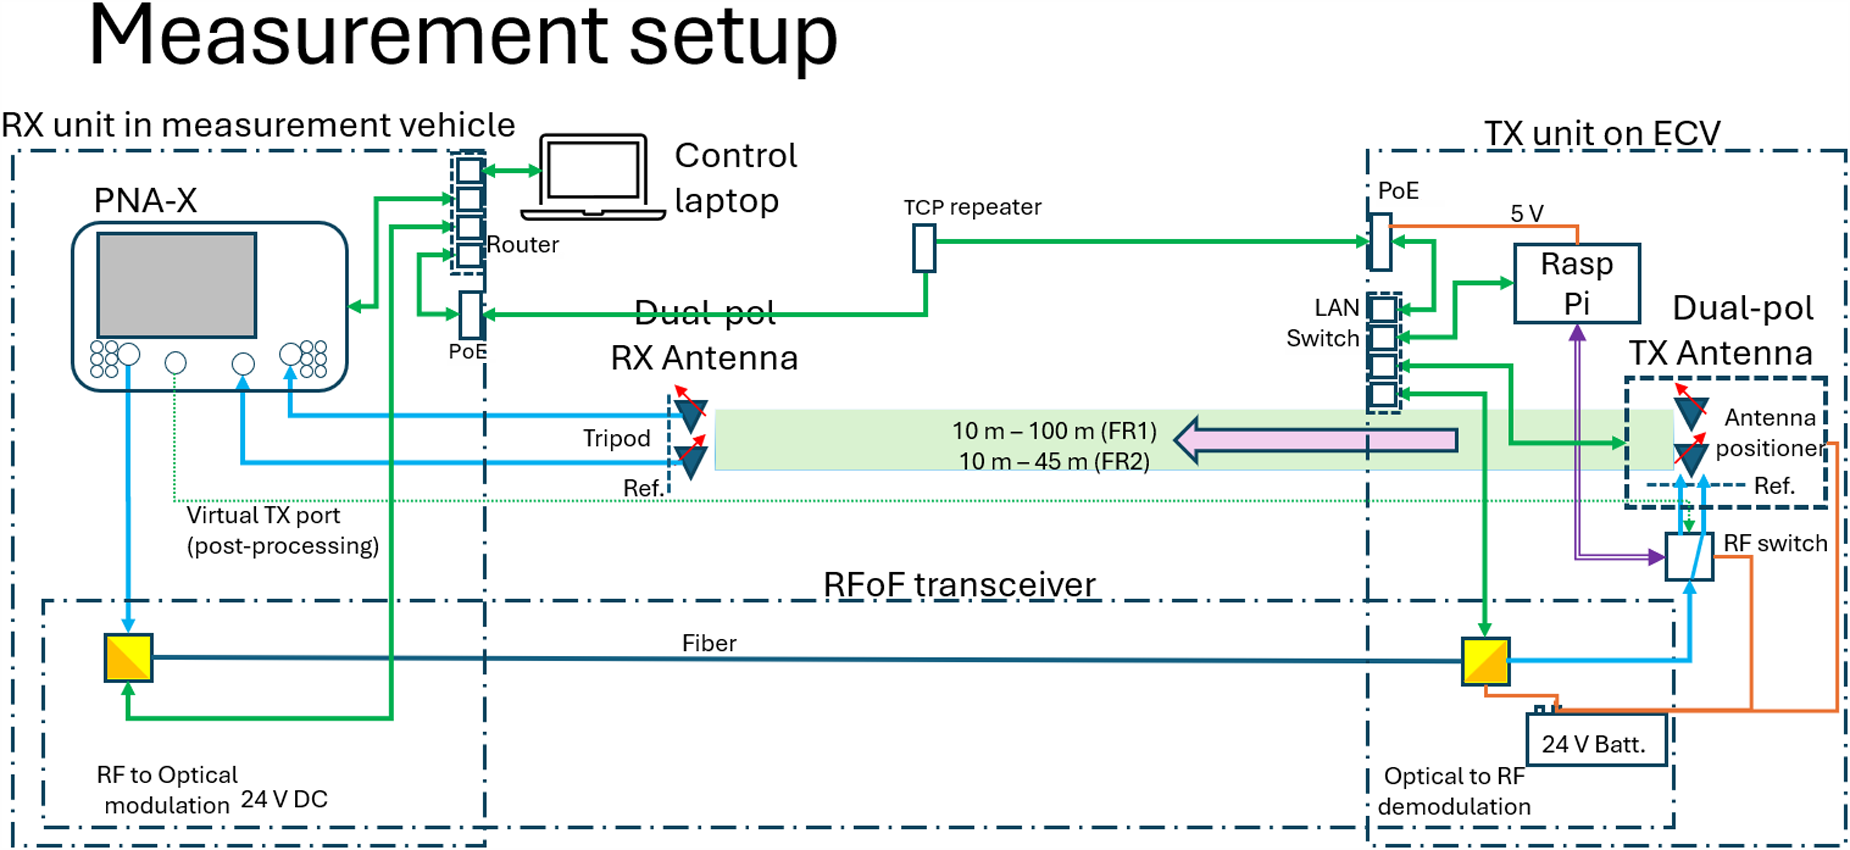
Figure 2. Radio channel measurement setup for FR1 and FR2 based on four-port PNA and RFoF link.
The four-port PNA supports dual-polarized antennas in a 2 × 2 MIMO measurement configuration. When only one RFoF link was available at the time of the measurements, an RF switch was deployed to flip-flop the signal from a single TX port of PNA to the two input ports of the TX antenna. The transmitted test signal was captured over the air (OTA) by a dual-polarized RX antenna. The received signal was saved in a set of data files along with the RF switch state information. During post-processing, this state information was used to combine the data from the 1 × 2 single-input multiple-output scenarios to a 2 × 2 MIMO scenario.
The TX antenna was mounted on a remotely steered electric cargo vehicle (ECV) in both campaigns. As an example, the installation of the FR1 transmission antenna on the ECV is shown in Figure 3(a). The TX antenna was positioned 1.5 m above the ECV to minimize any reflections from the ECV. A plastic drainpipe was used as an antenna mast pole to minimize reflections from the antenna mast. During the FR1 campaign, the TX antenna was placed at the desired measurement location by moving the ECV. The ECV was not moving when actual RF measurements were performed to minimize movement effects on the results and electromagnetic interference (EMI) from drive motors of the ECV. The ECV was driven from the middle of the main tunnel into the side tunnels 30 and 18 m in crossroads 1 and 2, respectively, in the FR1 band measurements as indicated with a black arrow in Figure 1(b) and (c).
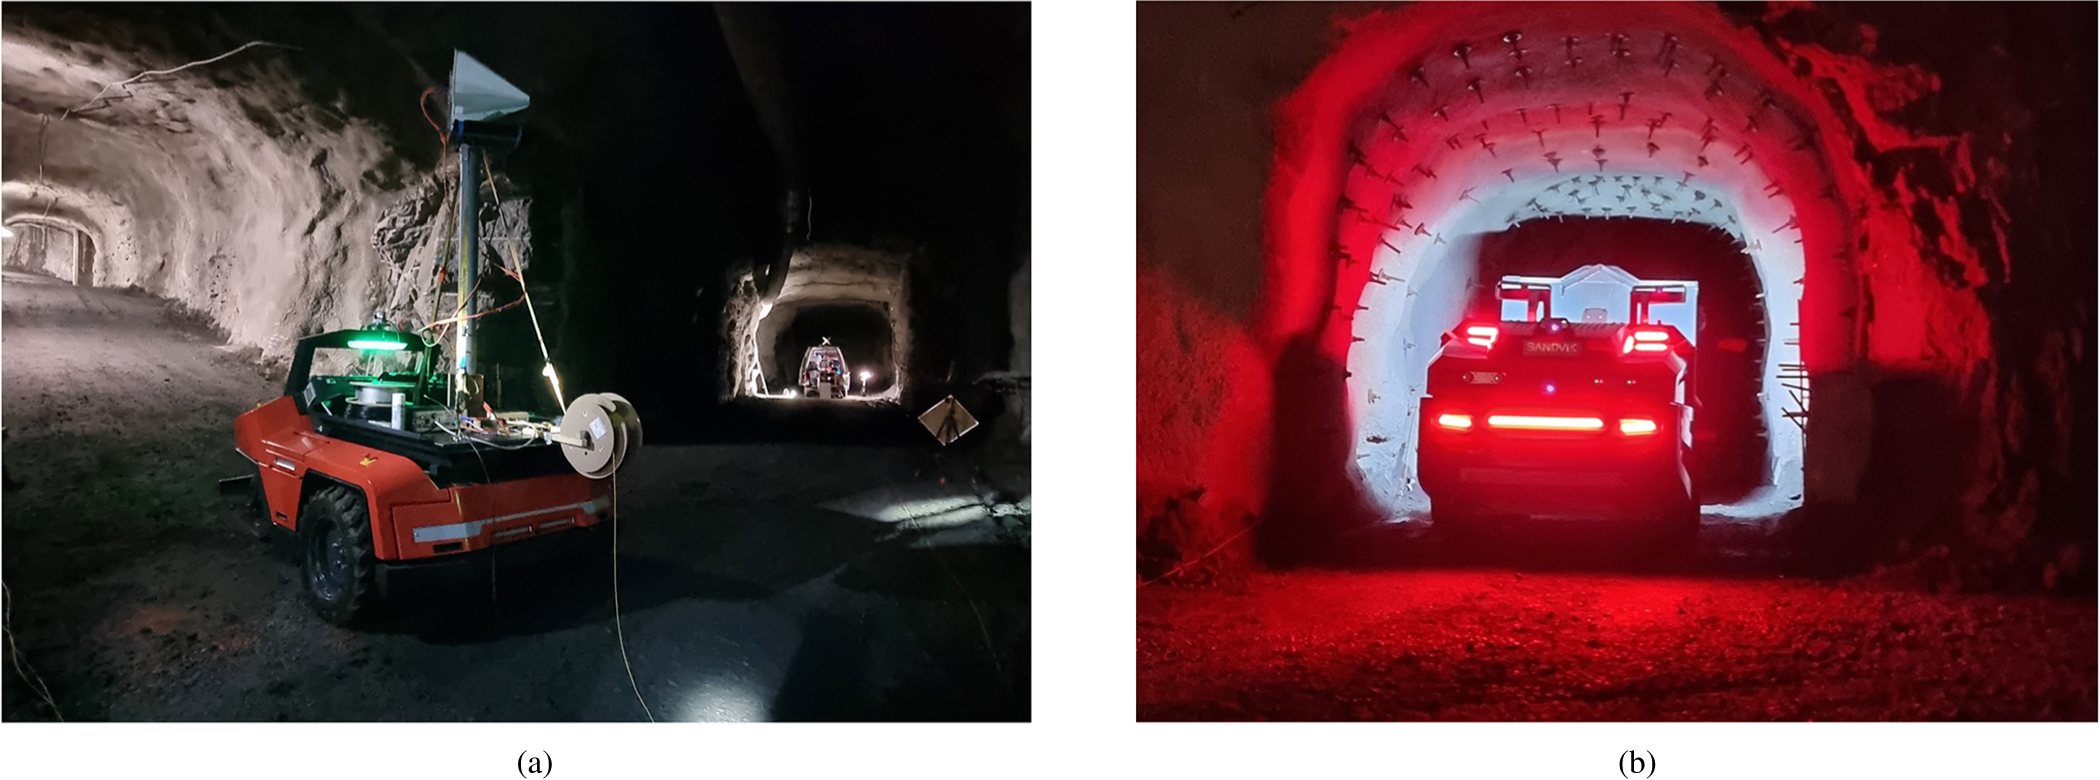
Figure 3. Vehicles utilized in the measurement campaigns. (a) FR1 NLOS measurement at crossroad 1. In middle, the TX antenna on ECV and the van with the RX antenna is at end of the main tunnel. (b) FR1 NLOS measurement: Loader blocks a narrow side tunnel.
For the FR2 campaign, the TX antenna setup was upgraded to include a linear movement of the TX antenna capability as shown in Figure 4(a). This linear movement of the TX antenna was implemented within sub-wavelength accuracy. Additionally, the TX antenna setup was equipped with a rotation antenna capability as presented in Figure 4(b). The FR2 antenna rotation motor’s EMI performance was measured in a laboratory environment prior to the tunnel measurements, and no interference signals were detected at measurement frequencies. The ECV was driven from the middle of the main tunnel 6 m inside the side tunnel in crossroad 1 or 10 m from the baseline in the FR2 measurements. The azimuth angle scanning measurements were performed at the 10-m distance point.
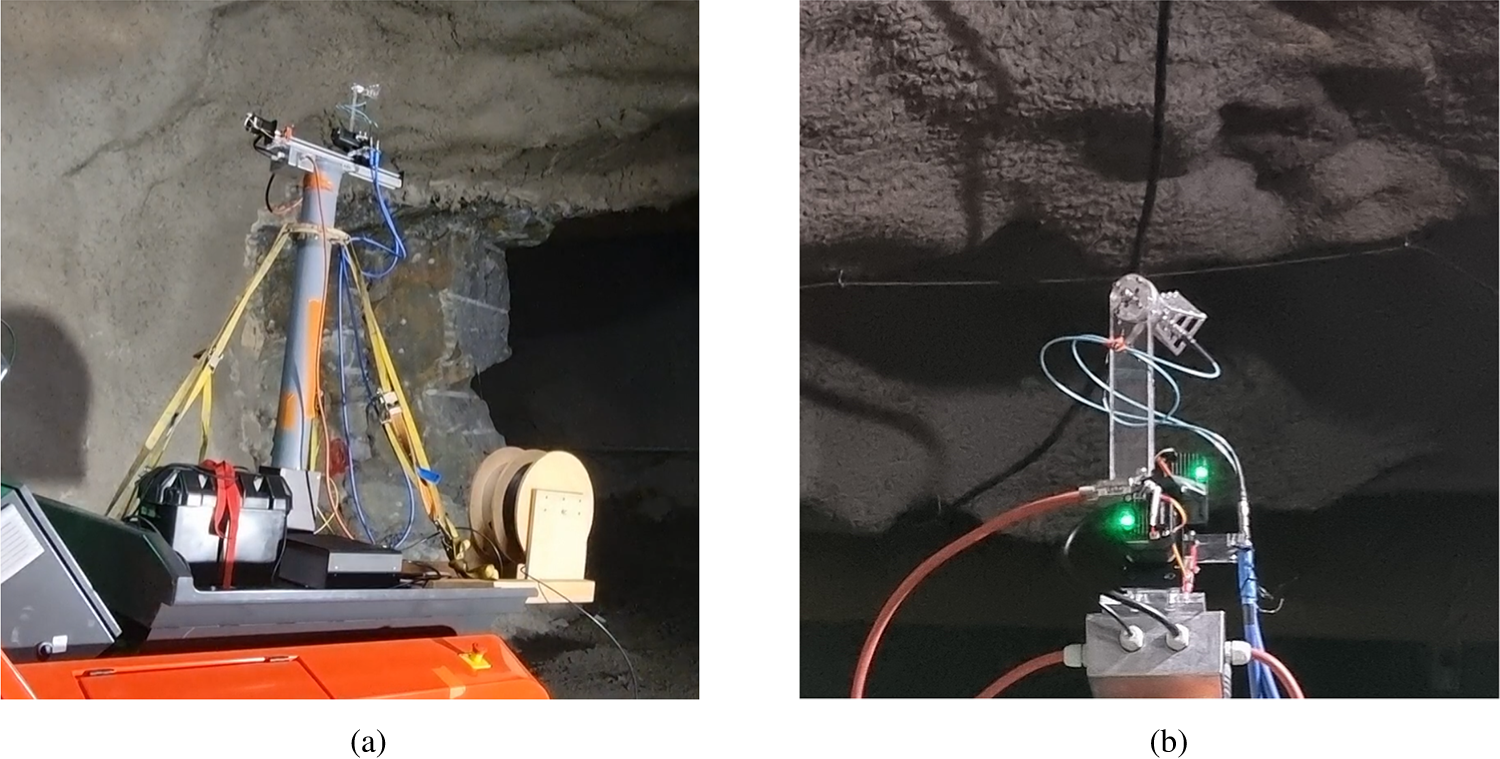
Figure 4. Remote-controlled TX unit in FR2 measurements. (a) FR2 TX antenna actuator placed on top of ECV. (b) FR2 antenna attached to rotation unit, closeup.
The reception antenna (RX) was placed in all measurements FR1 and FR2 on a tripod adjacent to a van where the PNA and the control units of the overall measurement system were located. The RX antenna was 2 m in front of the van from the incoming signal direction point of view in both FR1 and FR2 cases. Additionally, it was positioned higher than the roof of the van to minimize the effect of the van. The TX and RX antennas were located at a height of 2.5 m in all measurements to emulate the use case where the 5G antennas are mounted on top of mining vehicles.
Measurement system calibration
The most accurate approach to system calibration would be a 3D reference measurement in the air in an anechoic environment. By compensating for this reference response in the recorded channel data, the most precise representation of the radio channel can be achieved.
However, this type of system calibration is impractical when the measurement setup is designed to be mobile and the RF signal propagates through excessively long and freely moving cables that cause phase distortions. Moreover, creating a reflection-free environment for reference measurements is not feasible in underground settings.
An alternative calibration approach is a conducted measurement, where the antennas are excluded from the reference measurement, and the system response is recorded in forward and backward directions. This is a common calibration procedure in network analyzer measurements. The system response is either recorded as correction S-parameters and compensated while recording the data, or compensated for during the post-processing.
In the measurement setup depicted in Figure 2, the RFoF allows the RF signal to propagate only in the forward direction. Therefore, the most practical reference scenario is a conducted S21 measurement of the cables connected at the reference plane. The cable response was recorded once before the recording sessions, and the second time in the mine as a final step of the measurement campaign before disconnecting the cables from the measurement setup. During the post-processing phase, the immediate radio channel propagation data were normalized by the system response data, thereby correcting for cable attenuation, phase distortions, and the effects of the RFoF transceiver.
Selected measurement results from two campaigns
The following sections provide selected results of FR1 and FR2 measurement campaigns from various scenarios. The signals attenuation characteristics and propagation to the side tunnels were studied in the two frequency ranges within the main tunnel having a cross-section of 8 m × 8 m, the side tunnel width of 6 m × 6 m while the signal blockage in the FR1 NLOS scenario was studied by placing a large loader vehicle to block a narrow 4 m × 4 m tunnel as presented in a photograph (Figure 3(b)). All measurements were done with two polarizations at the two frequency bands FR1 and FR2: +45∘ slant orientation from the vertical orientation is named “A” and −45∘ slant orientation “B”. The 45∘ polarization slant antennas are used in the measurements to emulate how the 5G telecommunication systems are typically deployed in the mine tunnel.
5G signal blockage of loader at FR1
The loader was in the middle of the tunnel, and the scoop was down in the loader blocking’s reference measurement. Attenuation increases when the scoop is lifted upward, as shown in Figure 5. The photograph in Figure 3(b) is taken from the RX side (from the van) toward the TX antenna mounted on the ECV that was located in the tunnel in front of the loader.
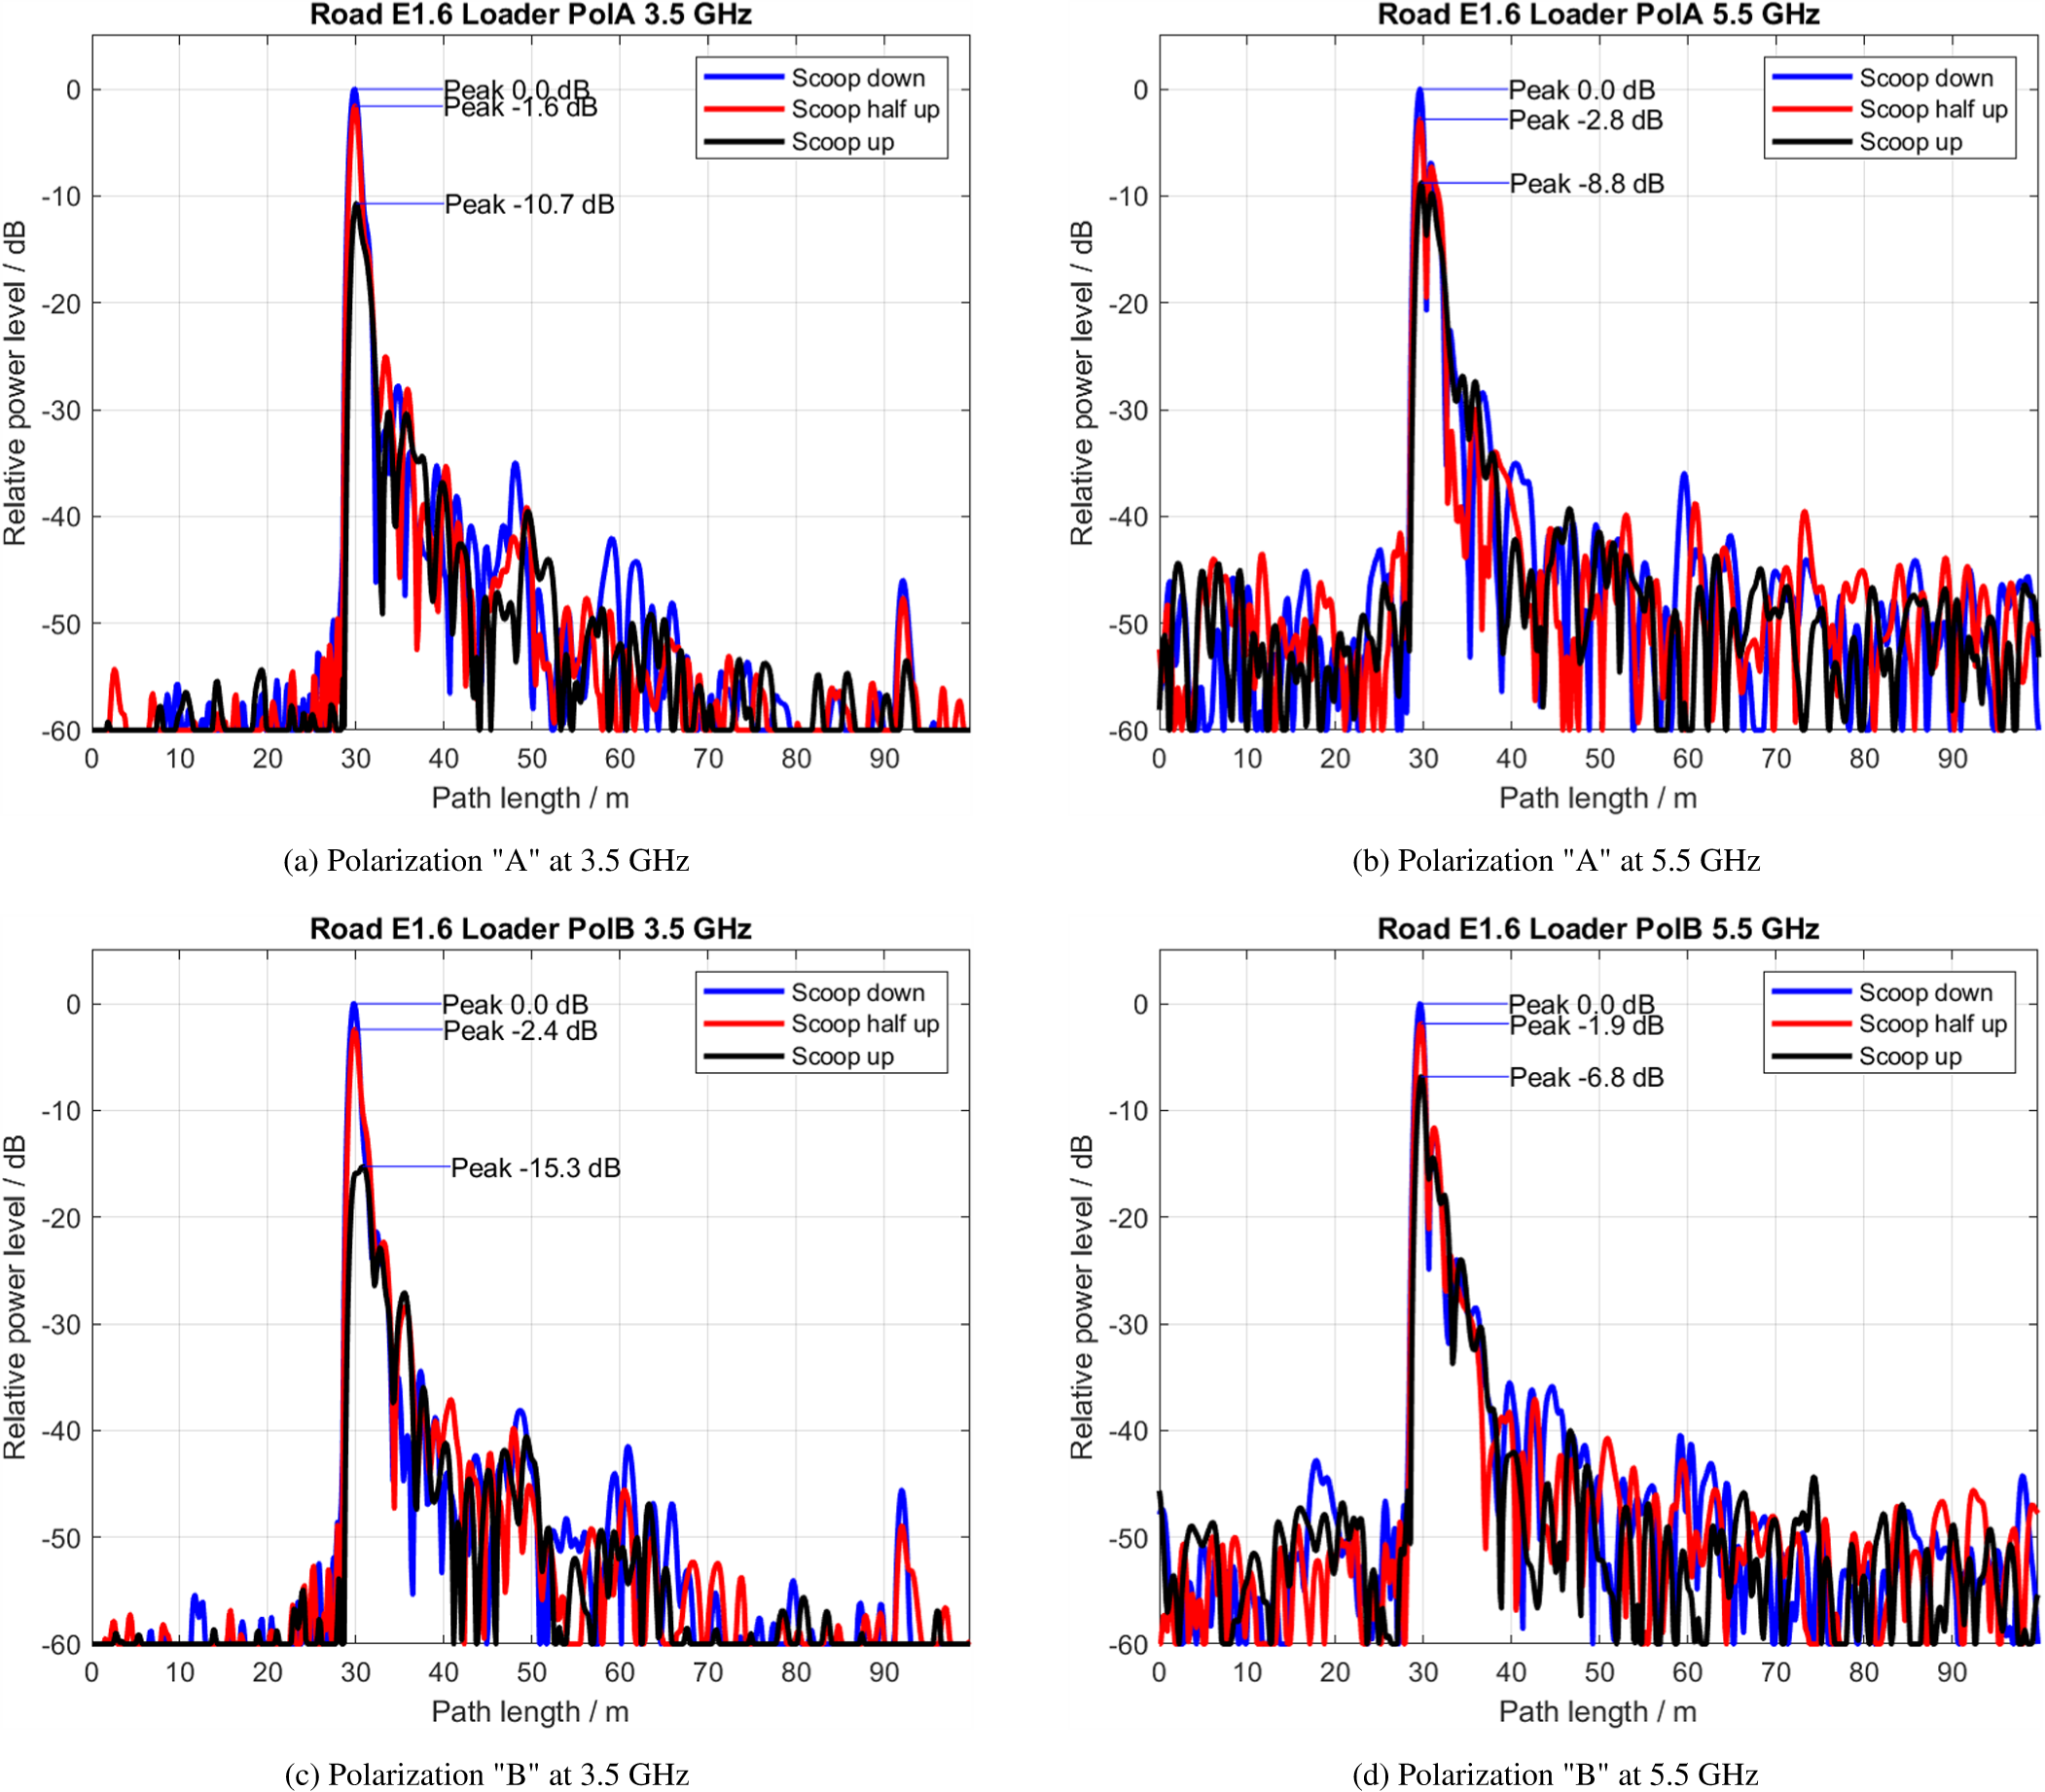
Figure 5. Effect of loader vehicle in a narrow tunnel.
Approximately a 2 dB signal attenuation was observed in all four measurement cases (two frequencies with two polarizations) as shown in Figure 5(a)–(d), when the scoop was raised to halfway of the tunnel height from the bottom as shown in Figure 3(b).
In the topmost scoop position, 10–15 dB signal attenuation was observed at 3.5 GHz frequency as shown in Figure 5(a) and (c). The results of 5.5 GHz case in Figure 5(b) and (d) indicate the scoop effect from 7 to 9 dB due to smaller wavelength and thus effectively a larger clearance from the scoop to the ceiling of the tunnel. These results indicate that wireless communication in 5G at 3.5 GHz and WiFi at 5 GHz frequencies are feasible even if a mining vehicle blocks a substantial area of the cross-section of the mining tunnel.
Signal attenuation in mining tunnel crossroads
The attenuation characteristics of the signal received for crossroad 1 are shown in Figure 6. These results in crossroad 2 case are presented in Figure 7. These results demonstrate how the FR1 signal level drops significantly when the corner of a side tunnel starts to shadow the LOS signal path toward the TX antenna. The measurement distance was 30 m in crossroad 1 and 18 m in crossroad 2, a difference that is evident in the signal levels between the two figures. This difference is visible in the signal levels between Figures 6 and 7. The results also indicate that varying TX trajectories within the side tunnels affect the LOS pathfront, causing different skewing patterns. Additionally, it is observed that polarization “B” performs better in penetrating the tunnel compared to polarization “A” at both frequencies.

Figure 6. Crossroad 1, normalized received signal power as a function of propagation path length and ECV’s (transmitter location) movement into side tunnel starting from the baseline.

Figure 7. Crossroad 2, normalized received signal power as a function of propagation path length and TX movement into side tunnel starting from the baseline.
In these two FR1 crossroad scenarios, the TX antenna on the ECV was pointing at 45∘ with respect to the center line of the main tunnel (the baseline), while the fixed RX antenna was oriented along the main tunnel, see Figure 1(b) and (c). This causes the signal to bounce from the tunnel walls, which is seen as single and double reflection signatures appearing at larger delays in Figures 6 and 7.
In both scenarios, the zero position of the TX vehicle marks the starting point at the baseline. As the results show in Figures 6 and 7, the LOS path diminishes rapidly once the TX antenna reaches the edge of the side tunnel.
The diffraction measurement can be considered as a special case of the signal attenuation measurement. When the data of crossroad 2 in Figure 7 is viewed from the vehicle position’s perspective as shown in Figure 8, the results reveal that the LOS signal attenuates at a rate of 15 dB/m. The measured attenuation rate of the signal was 10 dB/m in crossroad 1 based on the results presented in Figure 9. The side tunnel entrance of crossroad 1 was sharper than in crossroad 2, thus the signal diffraction in crossroad 1 follows more of a knife edge diffraction explaining the lower attenuation rate of crossroad 1.
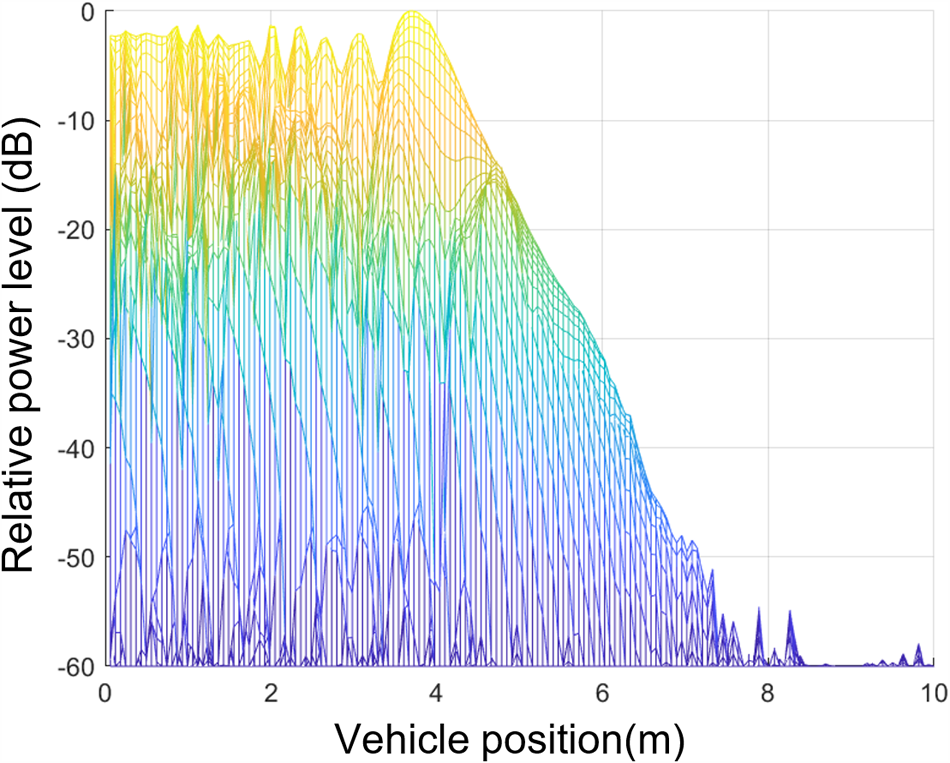
Figure 8. Signal attenuation of FR1 LOS signal at 3.5 GHz in polarization “B” into the side tunnel in crossroad 2 due to diffraction.
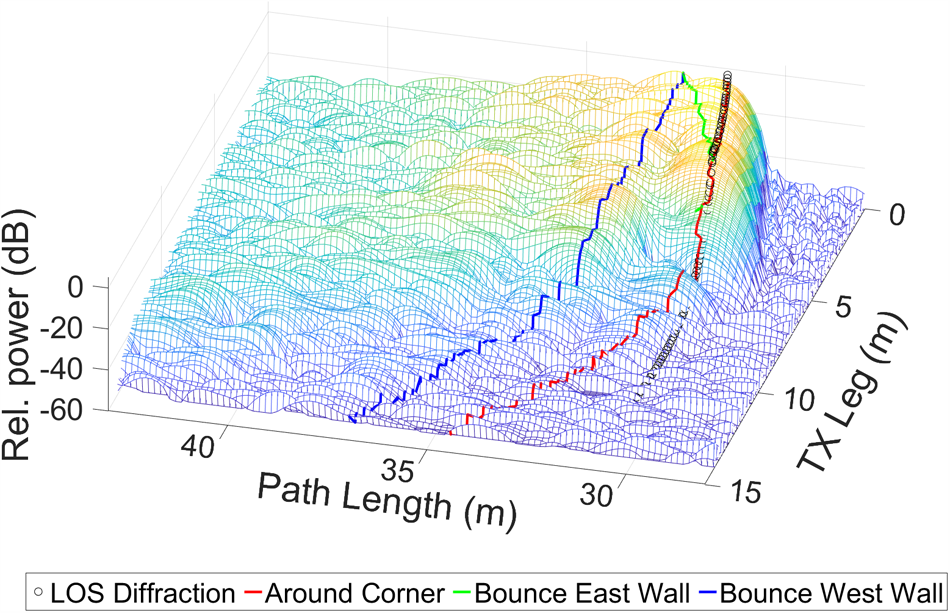
Figure 9. Signal attenuation in crossroad 1 at 3.5 GHz. Red curve presents total path length around the tunnel corner or diffraction edge. Green and blue curves present single bounce paths from east and west side walls of the main tunnel, respectively.
The measurement result data have been recorded and stored to enable the development of a ray tracer simulator and to validate simulation results. One example of the ray tracing simulation setup with single signal bounce paths is presented in Figure 10. The red curve illustrates the total signal path length around a diffraction edge or a tunnel edge. The green and blue curves present single bounce paths of the east and west side walls of the main tunnel, respectively. The total signal path starts to curve notably when the TX is inside the side tunnel, and the signal bends around the corner in Figure 9. The same phenomenon is visible in the blue curve when the signal bounces from the west side of the main tunnel wall. The east side bounce is visible until the TX enters the side tunnel.
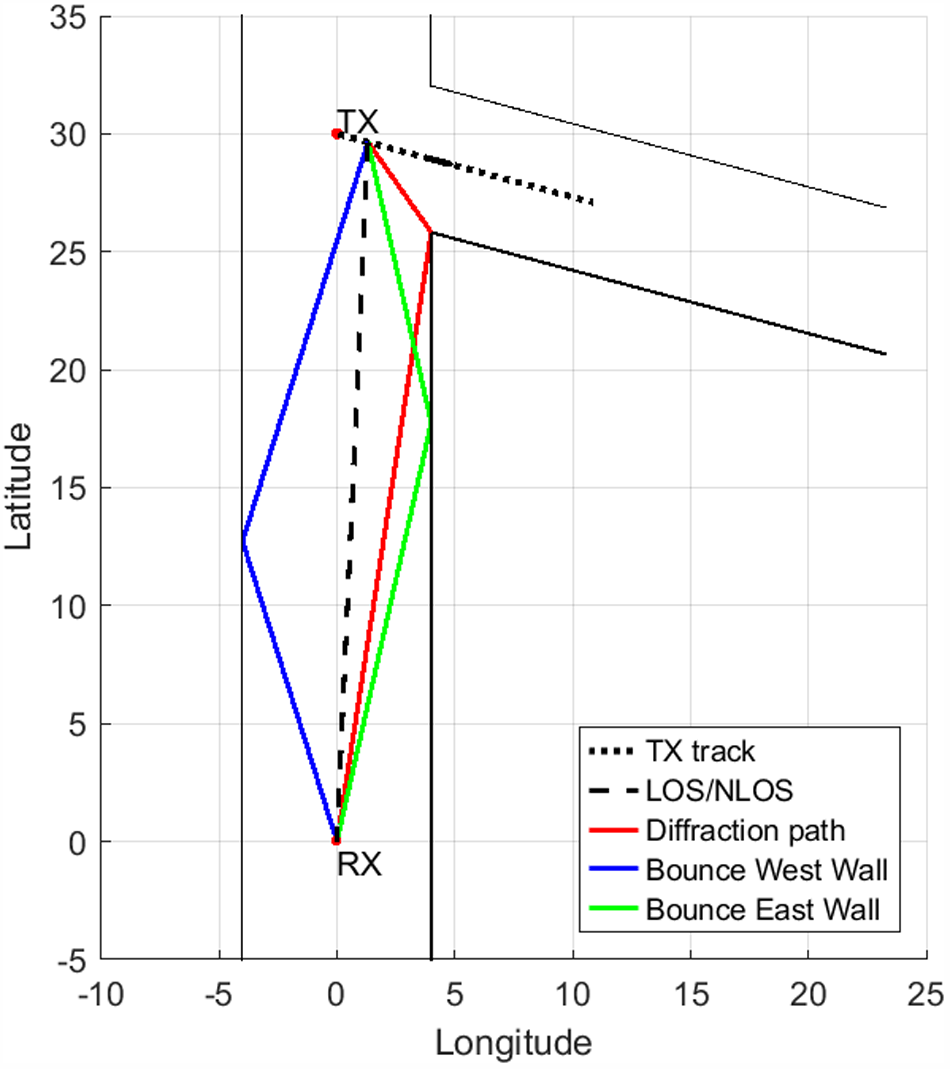
Figure 10. Signal reflection paths in crossroad 1.
Delay spread in mining tunnel crossroads
In the delay spread measurements, the TX antenna was pointing in a 45∘ direction toward the RX antenna as shown in Figure 3(a). The data were measured moving at a constant velocity of 5 cm/s from the baseline deeper into the side tunnel.
The delay spread characteristics of the radio channel were calculated based on data collected in the FR1 band at 3.5 GHz frequency in both crossroads. The post-processing of the raw complex value measurement data of S21 is described in Figure 11. First, the raw S21 measurement data were normalized with the separately measured cable response. Then, the normalized data were Kaiser-windowed to suppress the side lobes of the sinc-function below −60 dB level to improve the dynamic range. The frequency domain data were converted to the time domain with a circular Z-transformation, and the delay spread was calculated from the selected samples of the time domain data. The root mean square (RMS) delay spread S provides a measure of the variability of signal arrival via the communication channel and is defined as [38]
 \begin{equation}
S = \sqrt{\frac{\sum_{i=1}^N (\tau_i - \bar{\tau})^2 p_i}{\sum_{i=1}^N p_i}},
\end{equation}
\begin{equation}
S = \sqrt{\frac{\sum_{i=1}^N (\tau_i - \bar{\tau})^2 p_i}{\sum_{i=1}^N p_i}},
\end{equation}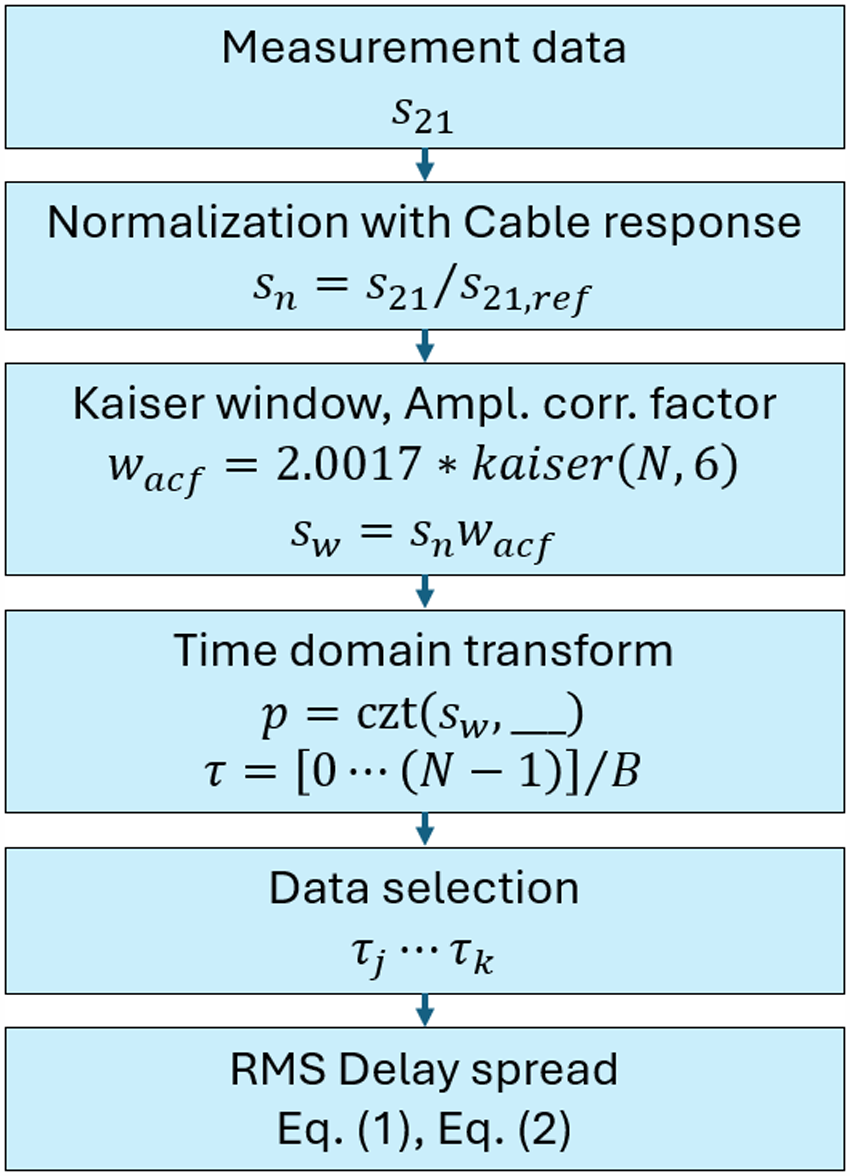
Figure 11. Measurement results post-processing flow chart with RMS delay spread calculation.
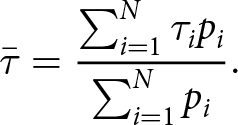
where τi is the delay of the i-th multipath component exceeding the cut-off threshold as shown in Figure 12, pi is the power of the i-th multipath component, N is the number of multipath components, and  $ \bar{\tau} $ is the mean delay defined as
 \begin{equation}
\bar{\tau} = \frac{\sum_{i=1}^N \tau_i p_i }{\sum_{i=1}^N p_i}.
\end{equation}
\begin{equation}
\bar{\tau} = \frac{\sum_{i=1}^N \tau_i p_i }{\sum_{i=1}^N p_i}.
\end{equation}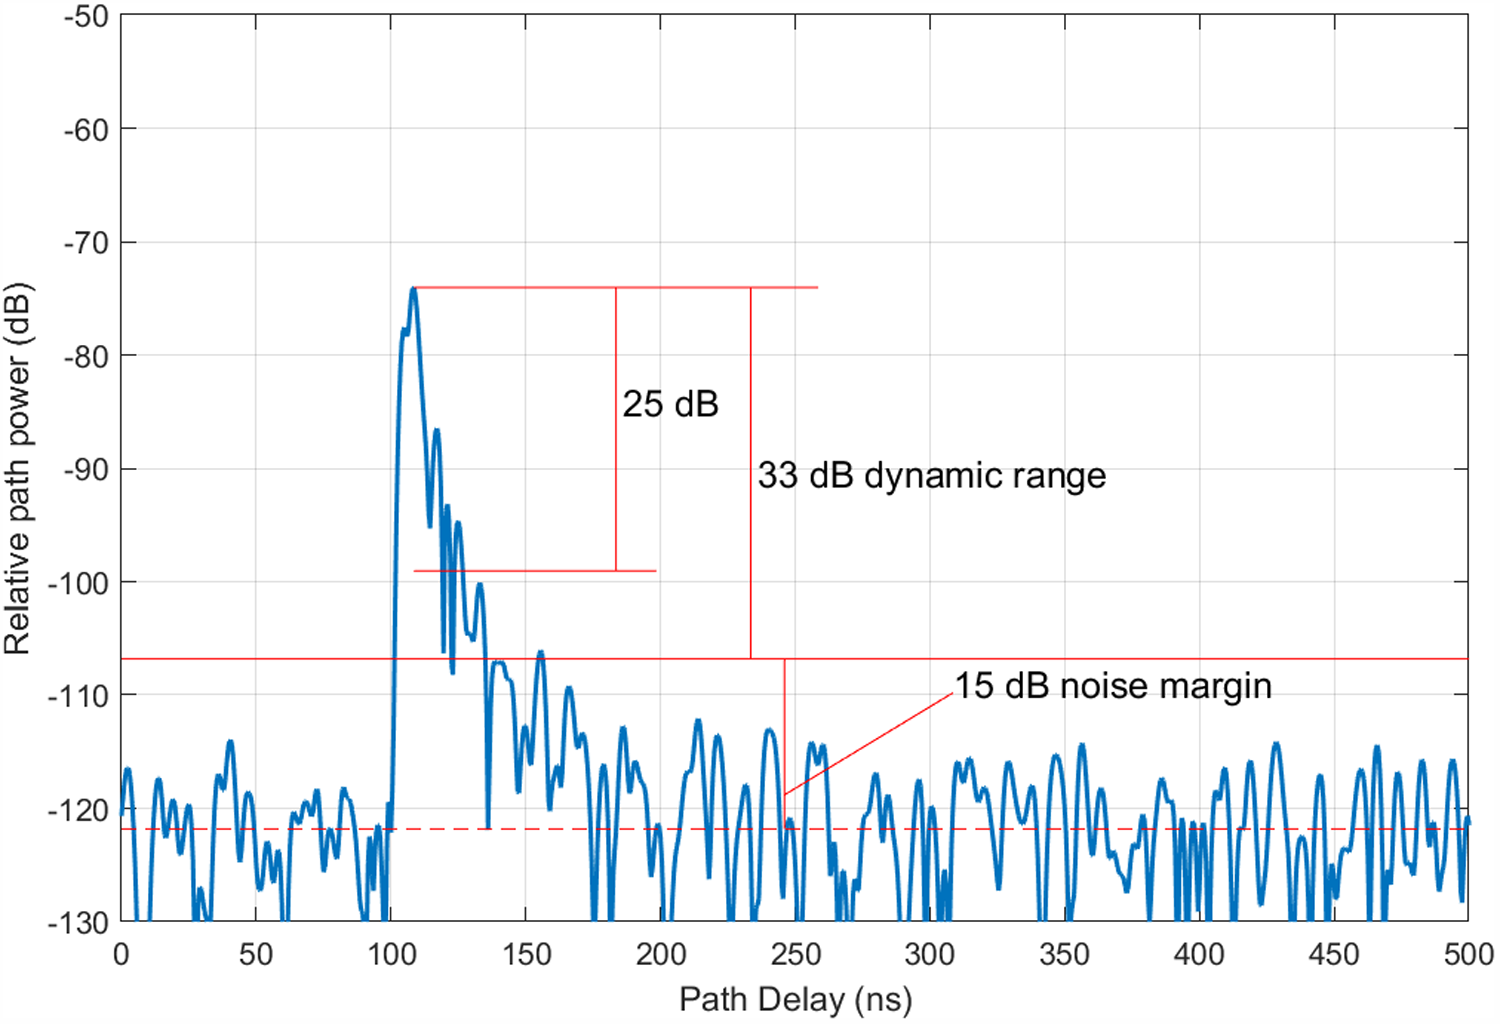
Figure 12. Definition of signal cut-off levels for RMS delay spread calculation with example thresholds of −25 dB below peak and +15 dB above average noise level.
The delay spread results were calculated based on a data acceptance level of -25 dB signal level below the maximum path power level.The second threshold level of 15 dB above average noise level was applied to eliminate contributions of weak signal paths and noise on the delay spread calculation. The definitions of the threshold levels are illustrated in Figure 12. A 15-point moving average of the RMS delay spreads in two crossroads is presented in Figure 13(a) and (b) with a red solid line.
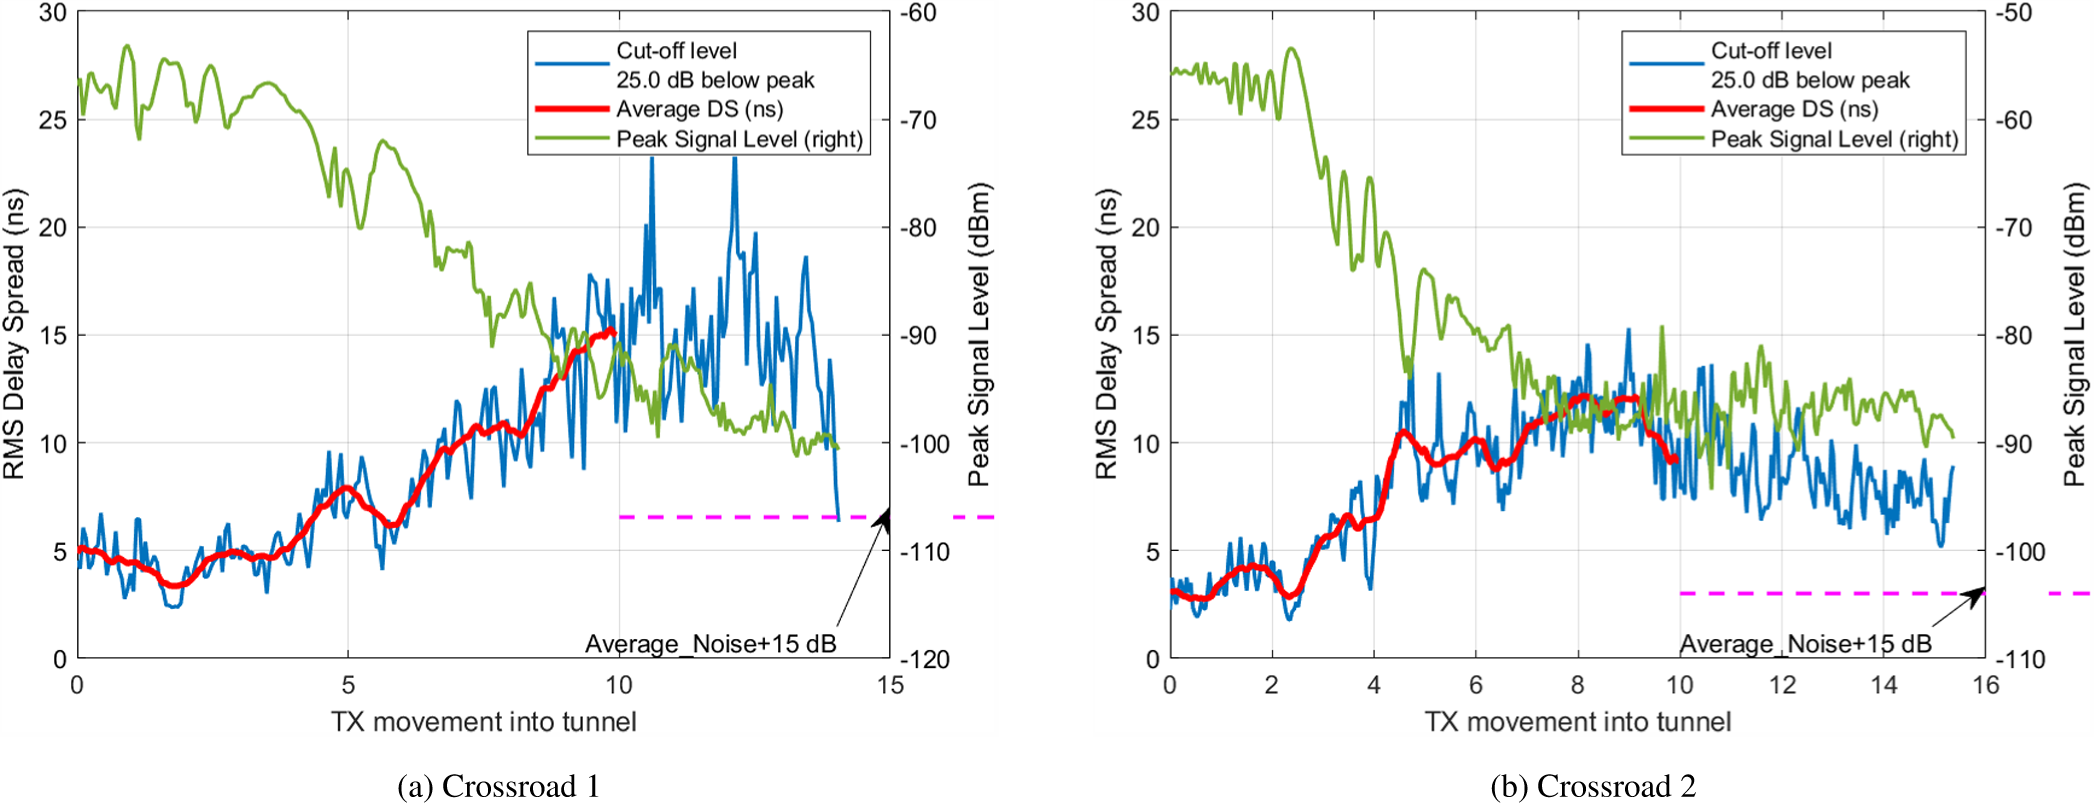
Figure 13. Measured RMS delay spreads at 3.5 GHz in two crossroad scenarios. Movement into side tunnel is starting from the baseline.
The RMS delay spread results for crossroads 1 and 2 are shown in Figure 13(a) and (b), respectively. The peak signal level in crossroad 2 is roughly 10 dB higher than in crossroad 1 case, which can be explained by measurement distances (18 m vs. 30 m) and antenna radiation pattern orientations with respect to each other.
The delay spread remains almost constant at 4–5 ns until the TX antenna starts to enter the side tunnel in crossroad 1 as shown in Figure 13(a). At a distance of 7 m or from the baseline in the side tunnel with a cut-off threshold of 25 dB, the delay spread increases to 10 ns. In crossroad 2 case, the delay spread rises from 3 to 9 ns in the same 7 m from the baseline to the side tunnel. The delay spread of 3 ns was achieved in the middle of the main tunnel.
A radio channel’s coherence BW can be estimated based on the average delay spread. The 3 and 10 ns delay spreads correspond to coherence BWs of 300 and 100 MHz, respectively. These results indicate that a 5G at FR1 system with a 100 MHz channel operates in the studied mine crossroads until the coverage limit.
Selected FR2 results
The FR2 measurement campaign concentrated on crossroad 1 scenario, covering six TX positions. The campaign began with the baseline position and progressed deeper into the side tunnel. At each measurement position, the TX antenna was carefully adjusted to specific azimuth angles and moved in half-wavelength increments along a 0.30 m linear slide, aligned with the direction of the side tunnel.
The LOS path disappeared at FR2 when the corner began to obstruct the direct signal path as observed during the FR1 measurements. The data were recorded using a sampling BW of 10 kHz for the intermediate frequency in order to improve the dynamic range. The azimuth scan results for the 26.5 GHz measurement, taken at a distance of 10 m from the baseline or 6 m inside the side tunnel, are illustrated in Figure 14. In this position, the LOS signal component is completely absent. However, depending on the TX azimuth angle, significant reflections from various surfaces can be detected at longer path delays. The first weak cluster of paths, observed at around 17–18 m, represents corner propagation around the tunnel entry. In contrast, a series of stronger clusters starting at 22 m indicates propagation through bounces from the side walls. In Figure 14, the blue shading marks the TX location at a nominal distance of 7 m from the tunnel entry, while the red shading signifies a position shift of 0.25 m (which corresponds to 22 wavelengths) deeper into the tunnel. In both positions, the signal was averaged over two bursts of data, each comprising frequency sweeps recorded at intervals of  $1/2\lambda$ over a span of 2 wavelengths. Notably, the bursts were separated by a distance of 0.084 m (or 7.45 wavelengths).
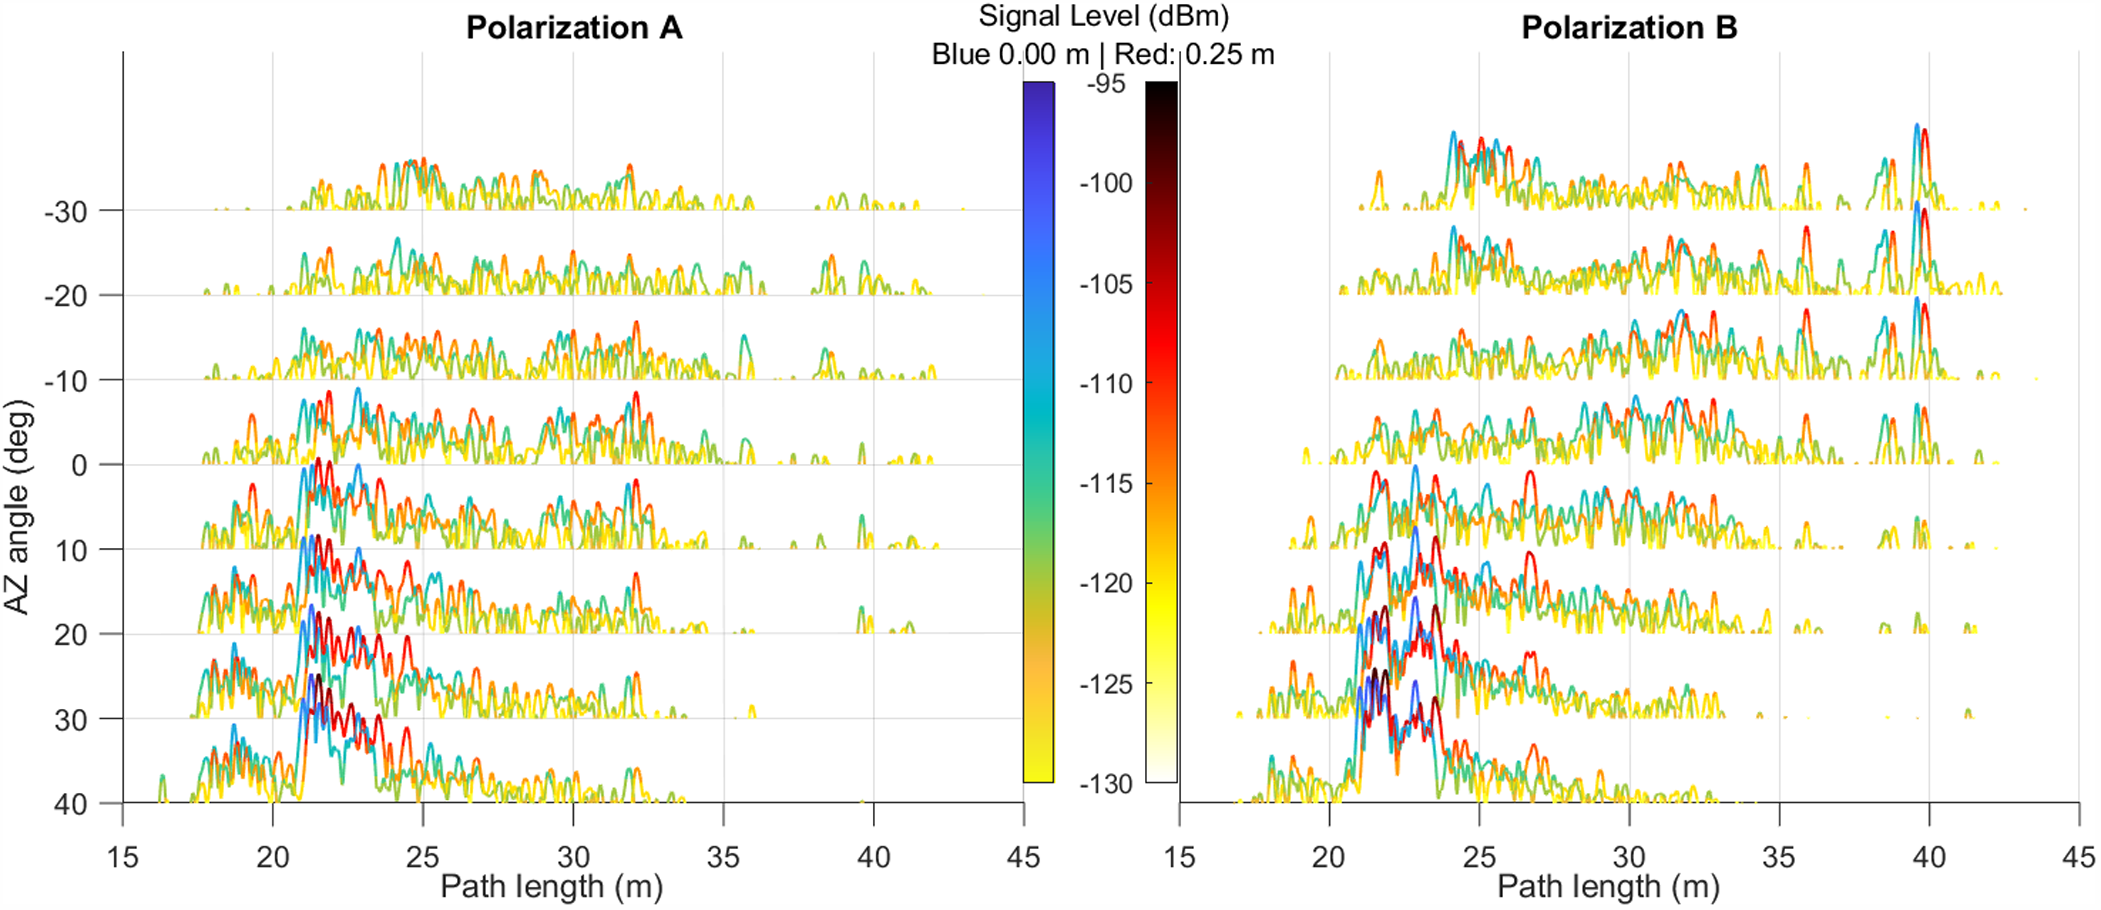
Figure 14. Multipath profiles at different azimuth angles in FR2 crossroad 1 scenario at 26.5 GHz measured at 10 m distance from the baseline. The blue shade presents the results at a nominal distance and the red shade indicates a position shift of 0.25 m (22λ) deeper into the tunnel. The profiles are cut at noise level for visual clarity.
Conclusion
Measurements for radio channel characterization were conducted in underground mine tunnels at both main 5G operational frequency ranges: FR1 (3.5 and 5.5 GHz) and FR2 (26.5 GHz). The developed radio channel measurement system employs RFoF technology to minimize signal attenuation in long distances, particularly at millimeter wave frequencies. The measured signal attenuation due to the blocking of the tunnel by a scoop and a large loader vehicle was in the range of 10 dB at FR1 frequencies.
The propagation path length measurements revealed significant signal reflections from the side tunnels to the main tunnel in the FR1 and FR2 frequency bands. However, the signal level decreases rapidly when the radio link’s other end moves inside the side tunnel. The measured attenuation rates were 10 and 15 dB/m at 3.5 GHz in crossroad 1 and crossroad 2, respectively.
Delay spread behavior of the wireless channel was evaluated at 3.5 GHz at both crossroads. The measurements indicate that the communication signal can effectively cover a side tunnel extending about 7 m. The average RMS delay spreads ranged from 3 ns in the middle of the main tunnel to 10 ns within the side tunnel, with corresponding coherence BWs of 300 and 100 MHz, respectively. These findings suggest that 5G and Wi-Fi networks will need to position base stations and access points within a few meters of tunnel crossroads to ensure continuous wireless connectivity for mine vehicles.
Furthermore, the analysis of signal reflections off the tunnel walls was conducted by varying the azimuth angles of the transmitting antenna at the FR2 band (26.5 GHz). The measurement taken 6 m into the side tunnel revealed strong reflections from the side walls which are seen from path length amplitude results. The reflection signal was the strongest in the case where the TX signal was directed toward the opposite side tunnel wall and from there bounced in the main tunnel and the RX end of the wireless link. The FR2 signal experiences significantly faster attenuation compared with FR1 counterparts when the other end of the radio link enters the side tunnel.
Acknowledgements
This research was supported in part by 6G Flagship (Grant Number 369116) funded by the Research Council of Finland and Business Finland project NG Mining (44049/31/2020). Keysight Technologies Inc. has supported research with measurement equipment donation. The authors would like to thank Mr. Jani Latvakoski, Ms. Martyna Szydlowska, and Sandvik Mining and Rock Solutions for their valuable support during the research.
Competing interests
The author(s) declare none.

Marko E. Leinonen (Senior Member, IEEE) received the M.Sc., Lic. in Tech., and Dr. Sc. degrees in electrical engineering from the University of Oulu, Finland, in 1996, 2002, and 2020, respectively. From 1994 to 2012 he was with Nokia Mobile Phones, Oulu, Finland working in various positions with radio engineering and technology management. From 2006 to 2007, he was a Senior Engineering Manager in Bangalore, India. From 2012 to 2016 he was a Master Developer with Ericsson, Oulu, Finland. Since 2017, he has been with the University of Oulu, Centre for Wireless Communications, Oulu, Finland, where he is currently a research director. His research interests include wireless radio systems, RF measurement technologies, advanced RF prototyping activates, and quality topics in radio engineering. He holds over 40 granted international patent families concentrating on radio engineering. He published as a main or a co-author of over 90 papers in peer-reviewed conferences or journal publications.

Veikko Hovinen received the M.Sc. degree in electrical engineering from the University of Oulu, Finland. In 1998, he joined the Centre for Wireless Communications (CWC), University of Oulu, where he pioneered in research on ultra-wideband technology. His current research interests include radio channel measurements and modeling wideband radio propagation channels. He is a recipient and a coauthor of the Best Paper Award at the IEEE VTC 2019-Fall.
Risto Vuohtoniemi (Member, IEEE) received the M.Sc. (Tech.) and Lic.Tech. degrees in electrical engineering from the University of Oulu, Finland. He is currently a University Teacher with the Faculty of Information Technology and Electrical Engineering, University of Oulu, where he is also a Research Scientist with the Centre for Wireless Communications (CWC). His research interests are in RF technology, especially in future wireless communication systems, cognitive radio, power line communication, and passive radar applications. He has served as a member of technical program committees in numerous IEEE conferences. He is a recipient and a coauthor of the Best Paper Award at the IEEE VTC 2019-Fall.

Aarno Pärssinen (Fellow, IEEE) received the Doctor of Science degree in electrical engineering from the Helsinki University of Technology, Finland, in 2000. From 2000 to 2011 he was with Nokia Research Center, Helsinki, Finland where he served as a member of Nokia CEO Technology Council from 2009 to 2011. From 2011 to 2013, he was at Renesas Mobile Corporation and joined Broadcom as part of a business acquisition in September 2014. Since September 2014 he has been with the University of Oulu, Centre for Wireless Communications, Finland where he is currently a professor. His research interests include wireless systems and transceiver architectures for wireless communications with emphasis on the RF and analog integrated circuit and system design. He has authored and co-authored 1 book, 2 book chapters, more than 250 international journal and conference papers, and holds several patents. He is the recipient of the European Microwave Prize for the best paper of European Microwave conference 2020.


 Open access